cardiac hypertrophy -...
TRANSCRIPT
Cardiac Hypertrophy - transcription patterns, hypertrophic progression
and extracellular signalling
Nina Gennebäck
Department of Public Health and Clinical Medicine,
Medicine
901 87 Umeå
Umeå 2012

Experimental studies on Cardiac Hypertrophy
2
Responsible publisher under Swedish law – the Dean of the Faculty of Medicine
Copyright© 2012 Nina Gennebäck
New series No. 1516
ISBN: 978-91-7459-468-3
ISSN: 0346-6612
Cover by:Nina Gennebäck
E-version available at http://umu.diva-portal.org/
Printed by: Print och Media
Umeå, Sweden 2012

3
To Conny, in memoriam.
The way is not in the sky. The way is in the heart.
Buddha, Hindu Prince Gautama Siddharta,
the founder of Buddhism, 563-483 B.C
Experimental studies on Cardiac Hypertrophy
4
Table of Contents
Table of Contents ............................................................................................................................... 4 Abstract ............................................................................................................................................. 6 Populärvetenskaplig sammanfattning ................................................................................................. 8 List of papers .................................................................................................................................... 10 Thesis overview ................................................................................................................................ 11 Abbreviations ................................................................................................................................... 12 Introduction ..................................................................................................................................... 14
Why study cardiovascular disease? ................................................................................................... 14 Cardiovascular epidemiology ............................................................................................................. 14 The heart ........................................................................................................................................... 14
Function ...................................................................................................................................... 15 The heart cycle ............................................................................................................................ 15 Histology of the cardiac muscle .................................................................................................. 15
Cardiac hypertrophy .......................................................................................................................... 16 Hypertrophic signalling pathways ............................................................................................... 17 Fetal gene program ..................................................................................................................... 20 Hypertrophic cardiomyopathy .................................................................................................... 20
Extracellular signalling ....................................................................................................................... 21 Vesicles ....................................................................................................................................... 21 Extracellular vesicles ................................................................................................................... 21 Function ...................................................................................................................................... 24 Extracellular vesicles in disease ................................................................................................... 24 Extracellular vesicles in the cardiovascular system ..................................................................... 25
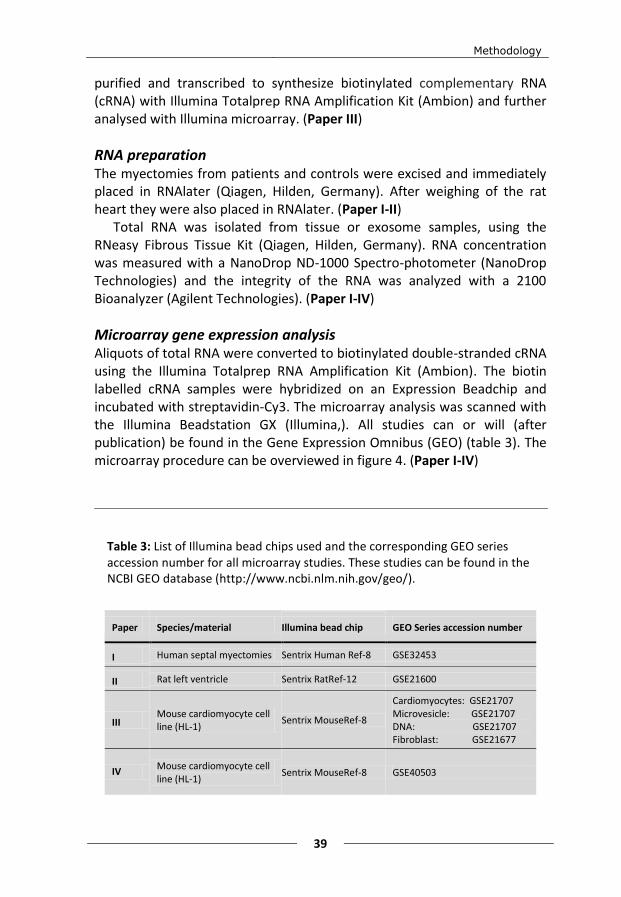
Gene expression ................................................................................................................................ 25 The central dogma of life ............................................................................................................ 25 Different RNAs ............................................................................................................................ 25 Whole genome miroarray ........................................................................................................... 26 Analyzing microarray data .......................................................................................................... 26 Gene expression in cardiac hypertrophy ..................................................................................... 27
Aims of the thesis ............................................................................................................................. 29 Overall aim ......................................................................................................................................... 29 Specific aims ...................................................................................................................................... 29
Presentation of papers ..................................................................................................................... 30 Paper I ................................................................................................................................................ 30 Paper II ............................................................................................................................................... 30 Paper III .............................................................................................................................................. 31 Paper IV ............................................................................................................................................. 32
Methodology.................................................................................................................................... 33 Patient material .......................................................................................................................... 33 Rat model .................................................................................................................................... 33
Table of content
5
Cell culture .................................................................................................................................. 33 Cell stimulation and harvest ........................................................................................................ 34 Extracellular vesicle isolation ...................................................................................................... 34 Co-culturing of microvesicles and target cells ............................................................................. 35 Flow cytometry analysis .............................................................................................................. 36 Electron microscopy .................................................................................................................... 37 Confocal microscopy ................................................................................................................... 37 Western blot ............................................................................................................................... 37 Dynamic Light Scattering ............................................................................................................ 38 DNA preparation ......................................................................................................................... 38 RNA preparation ......................................................................................................................... 39 Microarray gene expression analysis .......................................................................................... 39 Microarray gene expression data analysis .................................................................................. 40 Bioinformatics ............................................................................................................................. 41 Real-time PCR ............................................................................................................................. 41 Statistics ...................................................................................................................................... 42 Multivariate data analysis .......................................................................................................... 42
Results .............................................................................................................................................. 45 Paper I ................................................................................................................................................ 45 Paper II ............................................................................................................................................... 46 Paper III .............................................................................................................................................. 47 Paper IV ............................................................................................................................................. 48
Discussion ......................................................................................................................................... 49 Paper I ................................................................................................................................................ 49 Paper II ............................................................................................................................................... 50 Paper III .............................................................................................................................................. 51 Paper IV ............................................................................................................................................. 52
Conclusions ...................................................................................................................................... 54 Overall conclusions ............................................................................................................................ 54 Specific conclusions ........................................................................................................................... 54
Acknowledgments ............................................................................................................................ 56 Dedication .......................................................................................................................................... 59
References ........................................................................................................................................ 60 Figure and table references ............................................................................................................... 64
Experimental studies on Cardiac Hypertrophy
6
Abstract
“Cardiac Hypertrophy - transcription patterns, hypertrophic progression and extracellular signalling”
Background: The aim of this thesis was to study transcription patterns and extracellular signalling of the hypertrophic heart to better understand the mechanisms initiating, controlling and maintaining cardiac hypertrophy.
Cardiac hypertrophy is a risk factor for cardiovascular morbidity and mortality. Hypertrophy of the myocardium is a state, independent of underlying disease, where the myocardium strives to compensate for an increased workload. This remodelling of the heart includes physiological changes induced by a changed gene expression, alteration of the extracellular matrix and diverse cell-to-cell signalling.
Shedding microvesicles and exosomes are membrane released vesicles derived from the plasma membrane, which can mediate messages between cells and induce various cell-related processes in target cells. Methods and materials: Two different microarray studies on different materials were performed. In the first study, cardiac myectomies from 8 patients with hypertrophic obstructive cardiomyopathy (HOCM) and 5 controls without cardiac disease were used. In the second study, myocardial tissue from 6 aorta ligated and 6 sham operated (controls) rats at three different time points (1, 6 and 42 days post-surgically) were analysed. To reveal differences in gene expression the materials were analyzed with Illumina whole genome microarray and multivariate data analysis (PCA and OPLS-DA).
Cultured cardiomyocytes (HL-1) were incubated with and without growth factors (TGF-β2 or PDGF BB). Microvesicles and exosomes were collected and isolated after differential centrifugations and ultracentrifugations of the cell culture medium. The microvesicles and exosomes were characterized with dynamic light scattering (DLS), flow cytometry, western blot, electron microscopy and Illumina whole genome microarray. Results: The two different microarray studies revealed differentially expressed gene transcripts and groups of transcripts. When comparing HOCM patients to controls significant down-regulation of the MYH6 gene transcript and two immediate early genes (IEGs, EGR1 and FOS), as well as significant up-regulation of the ACE2, JAK2 and HDAC5 gene transcripts
Abstract
7
were found. In the rat model, 5 gene groups showed interesting clustering after multivariate data analysis (OPLS-DA) associated with the hypertrophic development: “Atherosclerosis”, “ECM and adhesion molecules”, “Fatty acid metabolism”, “Glucose metabolism” and “Mitochondria”.
The shedding microvesicles were rounded vesicles, 40-300 nm in size and surrounded by a bilayered membrane. Chromosomal DNA sequences were identified in the microvesicles. The microvesicles could be taken up by fibroblasts resulting in an altered gene expression in the fibroblasts. The exosomes from cultured cardiomyocytes (incubated with TGF-β2 or PDGF BB) had an average diameter of 50-80 nm, similar to the unstimulated control exosomes. A large, for all cardiomyocyte derived exosomes, common pool of mRNA seems stable and a smaller pool varied in mRNA content according to treatment of the cardiomyocyte. Of the common mRNA about 14% were ribosomal, 14% were of unknown locus and 5% connected to the function of the mitochondria. Conclusions: The microarray studies showed that transcriptional regulation at a stable stage of the hypertrophic development is a balance of pro and anti hypertrophic mechanisms and that diverse gene groups are differently regulated at different time points in the hypertrophic progression.
OPLS-DA is a very useful and powerful tool when analyzing gene expression data, especially in finding clusters of gene groups not seen with traditional statistics.
The extracellular vesicle studies suggests that microvesicles and exosomes released from cardiomyocytes contain DNA and can be involved in events in target cells by facilitating an array of processes including gene expression changes. Different treatment of the cardiomyocyte influence the content of the exosome produced, indicating that the signal function of the exosome might vary according to the state of the cardiomyocyte.
Experimental studies on Cardiac Hypertrophy
8
Populärvetenskaplig sammanfattning
”Hjärthypertrofi - transkriptionsmönster, hypertrofisk progression och extracellulär signalering”
Bakgrund: Syftet med den här avhandlingen var att studera transkriptions-mönster och extracellulär signalering vid hjärthypertrofi för att bättre förstå de mekanismer som startar, styr och underhåller tillväxten. Hjärthypertrofi, onormal tillväxt av hjärtmuskeln, är en riskfaktor för andra hjärt-kärlsjukdomar och dödlighet. Hypertrofi av hjärtmuskeln är ett tillstånd, oberoende av bakomliggande sjukdom, där hjärtmuskeln strävar efter att kompensera för ökad arbetsbelastning. Denna omställning av hjärtat innefattar fysiologiska förändringar orsakade av ett förändrat genuttryck, modifiering av miljön utanför cellen och ändrad cell-till-cell signalering.
Mikrovesiklar och exosomer är små membranomslutna bubblor som frisätts från cellmembranet, ut i cellens omgivning. De kan förmedla budskap mellan celler och påverka olika processer i målceller. Metoder och material: Avhandlingen innefattar två olika microarraystudier på olika material. I den första studien användes hjärtbiopsier från 8 patienter med hypertrofisk obstruktiv kardiomyopati (HOCM) och 5 kontroller utan hjärtsjukdom. I det andra projektet användes hjärtvävnad från 6 aortaligerade och 6 skenopererade (kontroller) råttor vid tre olika tidpunkter (1, 6 och 42 dagar efter kirurgiskt ingrepp). För att påvisa skillnader i genuttryck analyserades proverna med Illumina helgenom microarray och multivariat dataanalys.
Avhandlingens andra del innehåller två studier om mikrovesiklar och exosomer. Odlade hjärtmuskelceller (HL-1) stimulerades med tillväxt-faktorer (TGF-β2 eller PDGF BB) och ostimulerade celler användes som kontroll. Mikrovesiklar och exosomer renades fram med centrifugeringar och ultracentrifugering av cellodlingsmediet för att sedan karakteriseras med olika metoder för att studera storlek, ytmarkörer och innehåll. Illumina helgenom microarray användes för att studera microvesiklarnas och exosomernas mRNA innehåll. Resultat: I de två olika microarraystudierna hittades gentranskript och grupper av gentranskript som skiljde sig mellan kontroller och den hypertrofa hjärtvävnaden. När HOCM patientproverna jämfördes med kontroller hittades nedreglering av MYH6, EGR1 och FOS samt uppreglering av ACE2, JAK2 och HDAC5. Efter multivariat dataanalys av materialet från råtta, hittades 5 grupper av gentranskript med intressanta mönster som
Populärvetenskaplig sammanfattning
9
kunde kopplas till den hypertrofiska utvecklingen av hjärtmuskeln: "Ateroskleros", "ECM och adhesionsmolekyler", "Fettsyrametabolism", "Glukosmetabolis-men" och "Mitokondrien".
Mikrovesiklarna hade en diameter på 40-300 nm och innehöll kromosomala DNA-sekvenser. När mikrovesiklarna överfördes till en annan celltyp (fibroblaster) resulterade det i ett förändrat genuttryck i fibroblasterna. Exosomer från hjärtmuskelcellerna som odlats med eller utan tillväxtfaktor hade en diameter på 50-80 nm. En stor pool av olika gentranskript var gemensam för alla exosomer oavsett stimulering eller ej. En mindre pool av gentranskript varierade i innehåll mellan de stimulerade och ostimulerade hjärtmuskelcellerna. I den gemensamma gentranskript poolen var ca 14 % ribosomala, ca 14 % var okända och ca 5 % var associerade till mitokondrien och dess funktion. Slutsats: Microarraystudierna visade att transkriptionsreglering i ett stabilt skede av hypertrofiutvecklingen är en balans mellan pro- och anti-hypertrofiska mekanismer och att olika gengrupper var olika reglerade vid olika tidpunkter i hjärtmuskeltillväxten.
OPLS-DA är ett mycket användbart och kraftfullt verktyg när man analyserar genexpressionsdata, särskilt för att hitta grupper av gen-transkript som är svåra att upptäcka med traditionell statistik.
Microvesikel- och exosomstudierna visade att mikrovesiklar och exosomer som frisätts från hjärtmuskelceller innehåller både DNA och RNA och kan vara inblandade i händelserna i målceller genom att underlätta en rad processer, inklusive ändringar av genuttryck. Olika stimulering av hjärtmuskelcellen kan påverka innehållet i exosomernas som produceras, vilket indikerar att exosomernas signalfunktion kan variera beroende på hjärtmuskelcellens tillstånd.
Experimental studies on Cardiac Hypertrophy
10
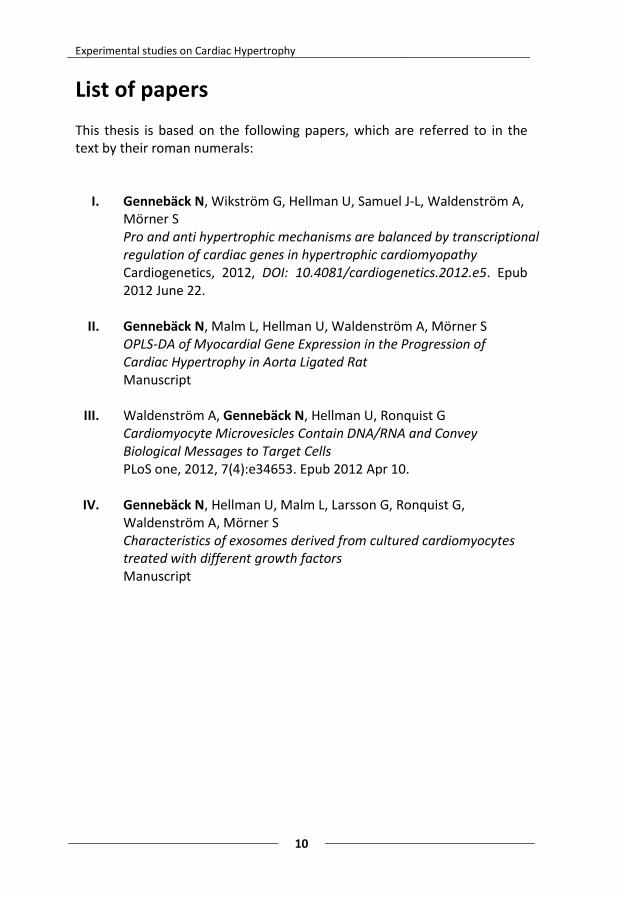
List of papers This thesis is based on the following papers, which are referred to in the text by their roman numerals:
I. Gennebäck N, Wikström G, Hellman U, Samuel J-L, Waldenström A, Mörner S Pro and anti hypertrophic mechanisms are balanced by transcriptional regulation of cardiac genes in hypertrophic cardiomyopathy Cardiogenetics, 2012, DOI: 10.4081/cardiogenetics.2012.e5. Epub 2012 June 22.
II. Gennebäck N, Malm L, Hellman U, Waldenström A, Mörner S
OPLS-DA of Myocardial Gene Expression in the Progression of Cardiac Hypertrophy in Aorta Ligated Rat Manuscript
III. Waldenström A, Gennebäck N, Hellman U, Ronquist G Cardiomyocyte Microvesicles Contain DNA/RNA and Convey Biological Messages to Target Cells PLoS one, 2012, 7(4):e34653. Epub 2012 Apr 10.
IV. Gennebäck N, Hellman U, Malm L, Larsson G, Ronquist G,
Waldenström A, Mörner S Characteristics of exosomes derived from cultured cardiomyocytes treated with different growth factors Manuscript
Thesis overview
11
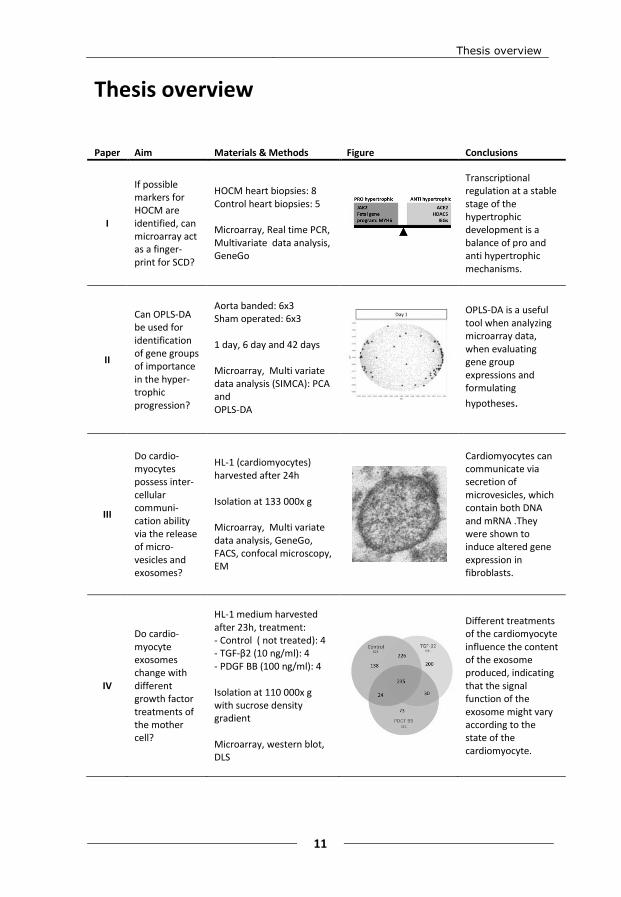
Thesis overview Paper Aim Materials & Methods Figure Conclusions
I
If possible markers for HOCM are identified, can microarray act as a finger-print for SCD?
HOCM heart biopsies: 8 Control heart biopsies: 5 Microarray, Real time PCR, Multivariate data analysis, GeneGo
Transcriptional regulation at a stable stage of the hypertrophic development is a balance of pro and anti hypertrophic mechanisms.
II
Can OPLS-DA be used for identification of gene groups of importance in the hyper-trophic progression?
Aorta banded: 6x3 Sham operated: 6x3 1 day, 6 day and 42 days Microarray, Multi variate data analysis (SIMCA): PCA and OPLS-DA
OPLS-DA is a useful tool when analyzing microarray data, when evaluating gene group expressions and formulating
hypotheses.
III
Do cardio-myocytes possess inter-cellular communi-cation ability via the release of micro-vesicles and exosomes?
HL-1 (cardiomyocytes) harvested after 24h Isolation at 133 000x g Microarray, Multi variate data analysis, GeneGo, FACS, confocal microscopy, EM
Cardiomyocytes can communicate via secretion of microvesicles, which contain both DNA and mRNA .They were shown to induce altered gene expression in fibroblasts.
IV
Do cardio-myocyte exosomes change with different growth factor treatments of the mother cell?
HL-1 medium harvested after 23h, treatment: - Control ( not treated): 4 - TGF-β2 (10 ng/ml): 4 - PDGF BB (100 ng/ml): 4 Isolation at 110 000x g with sucrose density gradient Microarray, western blot, DLS
Different treatments of the cardiomyocyte influence the content of the exosome produced, indicating that the signal function of the exosome might vary according to the state of the cardiomyocyte.

Experimental studies on Cardiac Hypertrophy
12
Abbreviations ACE2 angiotensin converting enzyme 2
AO acridine orange
Ang I angiotensin I
Ang II angiotensin II
Ang 1-7 angiotensin 1-7
ANP atrial natriuretic peptide
AP-1 activating protein-1
APOA1 apolipoprotein A1
CABG coronary artery bypass graft
CD40 CD40 molecule, TNF receptor superfamily member 5
CD63 CD63 molecule
CD9 CD9 molecule
cDNA complementary DNA
CO2 carbon dioxide
cRNA complementary RNA
DLS dynamic light scattering
DMEM Dulbecco’s modified Eagle’s medium
DNA deoxyribonucleic acid
dsRNA double stranded RNA
ECG electrocardiogram
ECM extracellular matrix
EDN endothelin
EGR1 early growth response 1
EM electron microscopy
ER endoplasmatic reticulum
FACS fluorescence-activated cell sorting
FGF fibroblast growth factor
FOS FBJ murine osteosarcoma viral oncogene homolog
GAPDH glyceraldehyde-3-phosphate dehydrogenase
GATA4 GATA binding protein 4
GEO gene expression omnibus
HBW heart-to-body weight
HCM hypertrophic cardiomyopathy
HDAC5 histone deacetylase 5
HOCM hypertrophic obstructive cardiomyopathy
IEG immediate early genes
IGF insulin-like growth factor
JAK2 janus kinase 2
JAK-STAT janus kinase - signal transducers and activators of transcription
JUN jun proto-oncogene
Abbreviations
13
LA left atrium
LV left ventricle
LVH left ventricular hypertrophy
LVWT left ventricular wall thickness
MAPK mitogen-activated protein kinase
MEF2 myocyte enhancer factor 2
mRNA messenger RNA
miRNA micro RNA
MVB multivesicular bodies
MVDA multivariate data analysis
MYC myelocytomatosis viral oncogene homolog
MYH6 myosin heavy chain 6 cardiac muscle alpha
MYH7 myosin heavy chain 7 cardiac muscle beta
NFAT5 Nuclear factor of activated T-cells 5
NPPA atrial natriuretic peptide gene
OPLS orthogonal partial least squares
OPLS-DA orthogonal partial least squares - discrimination analysis
PASW predictive analytics software
PBS phosphate buffered saline
PCA principal component analysis
PCR polymerase chain reaction
PDGF BB platelet-derived growth factor BB
PE phycoerythrin
PI propidium iodide
PLS partial least squares
PPAR peroxisome proliferator-activated receptor
PPIA human cyclophilin A
RA right atrium
RAAS renin–angiotensin–aldosterone system
RNA ribonucleic acid
rRNA ribosomal RNA
RPLPO large ribosomal protein (RPLPO).
RT-PCR real time PCR
RV right ventricle
SDS-PAGE sodium dodecyl sulfate - polyacrylamide gel electrophoresis
siRNA small interfering RNA
TGF-β transforming growth factor - beta
TS test set
TSG101 tumor susceptibility gene 101
tRNA transfer RNA
WHO World Health Organization
WS working set
Experimental studies on Cardiac Hypertrophy
14
Introduction
Why study cardiovascular disease? For the past 50 years several breakthroughs in the treatment of cardiovascular diseases have been made: the pacemaker (1958), coronary artery bypass grafts (CABG, 1960s), heart transplantation (1967), coronary angioplasty (1977) and so on. These interventions have, together with improved medication (e.g. β-blockers and ACE-inhibitors), decreased the number of deaths. But still cardiovascular disease remains as the main cause of death in the western world.
Today, cardiovascular research is focused on improving existing interventions and medications, but also on personalising treatment and diagnosis by discovery of new biomarkers and disease patterns that can stage the disease. By staging the disease development, medication can be focused and diagnosis can be made earlier and more efficient.
Cardiovascular epidemiology According to the World health organization (WHO), the most common cause of death in the world is cardiovascular disease1, which is true when taking both high and low income countries into account. In low income countries alone, infectious diseases account for the most number of deaths.
Sweden, classified as a “high income” country, is not different. According to the Swedish National Board of Health and Welfare (Socialstyrelsen) cardiovascular disease was the underlying cause of death in 39.3 percent of women and in 37.8 percent of men in 20112.
The heart A healthy human heart normally weighs between 250 and 350 grams and is about a fist in size. The heart is a muscular organ that supplies oxygen and nutrients to the body by pumping blood through the arteries. Carbon dioxide rich blood is then returned to the heart via the veins. This pumping is upheld with rhythmic contractions.
The heart is composed of four chambers and is enclosed by the pericardium. The pericardium protects the heart and prevents it from overfilling with blood. The four chambers are functionally divided two-and-two and are separated by the septum. The right side consists of the right atrium (RA) and right ventricle (RV) and is responsible for pumping the carbon dioxide rich blood to the lungs. The left side consists of the left atrium (LA) and left ventricle (LV) and is accountable for pumping the oxygenated blood out to the body. On both sides, the ventricles, the lower
Introduction
15
chambers, have thicker walls than the two atria. Furthermore, the LV is thicker then the RV due to the higher force needed for pumping the blood to the whole body (as in contrast to only the lungs).
Function The carbon dioxide rich blood reaches the heart via the superior and inferior vena cava to the RA. The blood passes the tricuspid valve into the RV, were the blood is pumped through the pulmonary valve via the pulmonary arteries to the lungs. From the lungs oxygenated blood returns through the pulmonary veins into the LA, via the mitral valve into the LV. From the LV the blood is pumped through the aortic valve into the aorta, further into the arteries and out to the body.
The heart cycle A heart beat is about 0.8 seconds long. During this time the heart cycle is completed once. To make the heart contract in a coordinated fashion a pace making system is needed together with self-excitable specialized myocyte fibres that repeatedly produce action potentials, generating an electrical pulse. The autonomic nervous system modifies the heartbeat but does not generate it. The action potential is turned into a contraction by the rise of Ca+ inside the contractile cells, Ca+ binds to troponin which in turn allows actin and myosin filaments to slide past each other, creating a tension.
At the sinoatrial node (the pacemaker) an action potential is created that in turn generates an electrical pulse that sets the rate and timing of the contraction. The pulse spreads to the atrial walls, contracting the atria in unison. The pulse also passes through the atrioventricular node were the pulse is delayed for approximately 0.1 seconds, this to ensure that the atria are empty before contracting the ventricles. The Purkinje fibres are specialized muscle fibres that spread the pulse all through the ventricular walls, contracting them in a coordinated fashion.
The pulse generated during the heart cycle produce electrical currents that are conducted through body fluids to the skin, where they can be detected by electrodes and recorded as an electrocardiogram (ECG).
Histology of the cardiac muscle The ventricular walls and septum are mainly composed of myocardium, cardiac muscle, where fibroblast cells provide structural support for the cardiomyocytes (heart muscle cells) and are responsible for extracellular matrix synthesis3.
Experimental studies on Cardiac Hypertrophy
16
In quantity, the myocardium consists of about 40 percent cardio-myocytes and 60 percent fibroblasts but with some regional differences influenced by the physiological nature of the region3-4. However, if considering volume, the myocardium is composed of 75% cardiomyocytes and about 25% fibroblast3.
Cardiomyocytes differ in a number of ways from skeletal- and smooth muscle cells. Cardiomyocytes can form branches, has larger T-tubules that are located along the Z-disc, they contain more mitochondria and the muscle fibers are connected by intercalated discs5. These features combined are the condition for an efficient contraction function by optimizing the way the electrical pulse is conducted throughout the cardiac walls.
Cardiomyocytes can regenerate, although slowly. It was recently estimated that a 20-year-old human renews approximately 1 percent of heart muscle cells every year, and in a 50-year-old about 45 percent were regenerated after birth6.
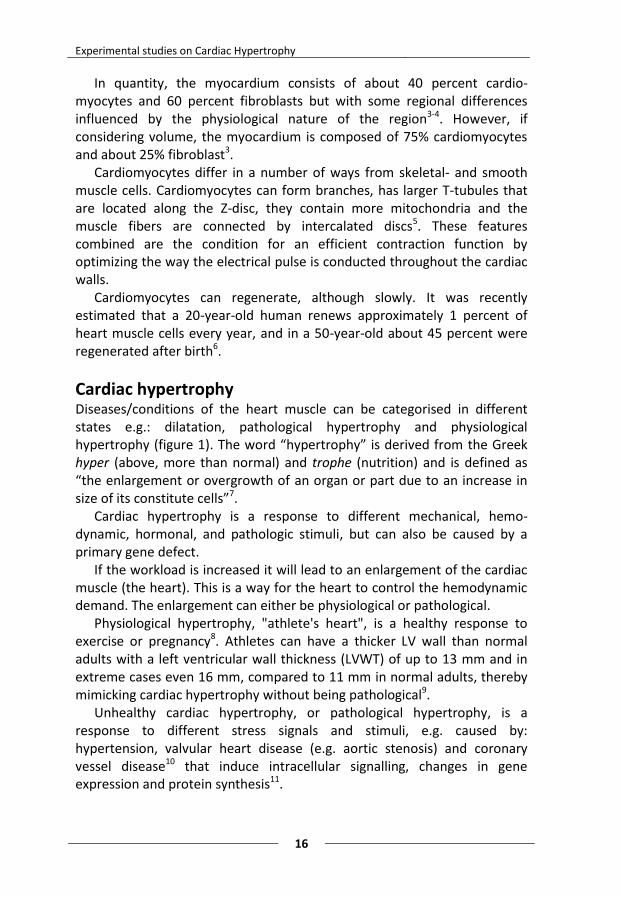
Cardiac hypertrophy Diseases/conditions of the heart muscle can be categorised in different states e.g.: dilatation, pathological hypertrophy and physiological hypertrophy (figure 1). The word “hypertrophy” is derived from the Greek hyper (above, more than normal) and trophe (nutrition) and is defined as “the enlargement or overgrowth of an organ or part due to an increase in size of its constitute cells”7.
Cardiac hypertrophy is a response to different mechanical, hemo-dynamic, hormonal, and pathologic stimuli, but can also be caused by a primary gene defect.
If the workload is increased it will lead to an enlargement of the cardiac muscle (the heart). This is a way for the heart to control the hemodynamic demand. The enlargement can either be physiological or pathological.
Physiological hypertrophy, "athlete's heart", is a healthy response to exercise or pregnancy8. Athletes can have a thicker LV wall than normal adults with a left ventricular wall thickness (LVWT) of up to 13 mm and in extreme cases even 16 mm, compared to 11 mm in normal adults, thereby mimicking cardiac hypertrophy without being pathological9.
Unhealthy cardiac hypertrophy, or pathological hypertrophy, is a response to different stress signals and stimuli, e.g. caused by: hypertension, valvular heart disease (e.g. aortic stenosis) and coronary vessel disease10 that induce intracellular signalling, changes in gene expression and protein synthesis11.
Introduction
17
The characteristics of the hypertrophic heart include: increased myocyte length and width, fibrosis and cardiac dysfunction that might lead to heart failure4,12-13.
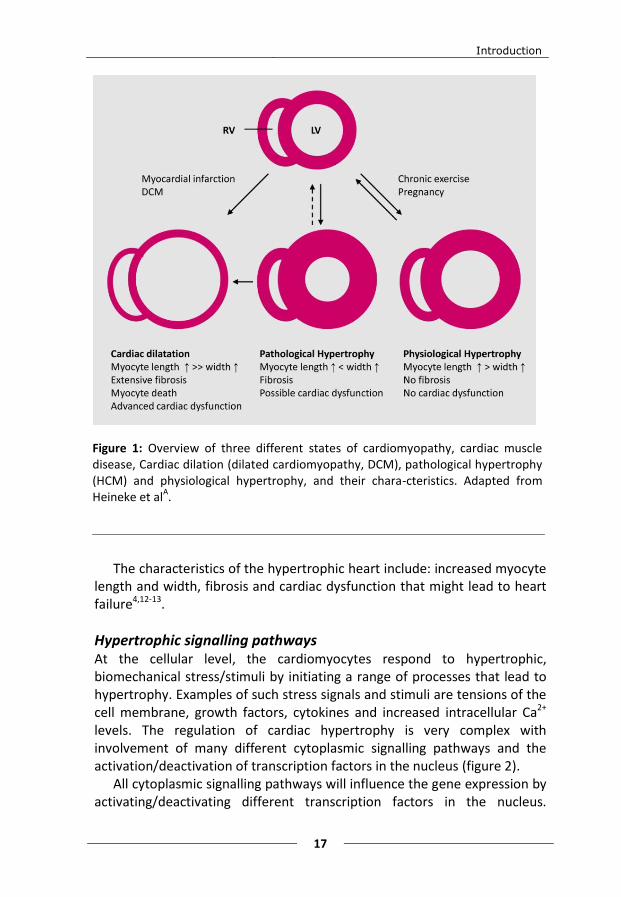
Hypertrophic signalling pathways At the cellular level, the cardiomyocytes respond to hypertrophic, biomechanical stress/stimuli by initiating a range of processes that lead to hypertrophy. Examples of such stress signals and stimuli are tensions of the cell membrane, growth factors, cytokines and increased intracellular Ca2+ levels. The regulation of cardiac hypertrophy is very complex with involvement of many different cytoplasmic signalling pathways and the activation/deactivation of transcription factors in the nucleus (figure 2).
All cytoplasmic signalling pathways will influence the gene expression by activating/deactivating different transcription factors in the nucleus.
Figure 1: Overview of three different states of cardiomyopathy, cardiac muscle disease, Cardiac dilation (dilated cardiomyopathy, DCM), pathological hypertrophy (HCM) and physiological hypertrophy, and their chara-cteristics. Adapted from Heineke et al
A.
Experimental studies on Cardiac Hypertrophy
18
Ultimately, it is the changed gene expression that will change the cell from a normal to a hypertrophic state by adjustment of mRNA production and protein synthesis.
Cytoplasmic signalling pathways A growing number of intracellular signalling pathways have been characterised and identified as important in the hypertrophic development and progression. These signalling pathways include signalling trough: G-proteins, calcineurin , mitogen-activated protein kinase (MAPK), and janus kinase - signal transducers and activators of transcription (JAK-STAT)14. Each of these signalling pathways has been implicated as an important factor in the hypertrophic response and together they make up the intricate balance of maintaining the hypertrophic machinery.
In the JAK-STAT pathway, JAK2 is known be activated to the onset of cardiac hypertrophy and has an important role in mediating signals from the sarcolemma cytokine gp130 receptor and angiotensin receptor AT1 to the nucleus for transcriptional regulation15.
Transcription factors and other nuclei regulators An early response in the initial hypertrophic development is the activation of the immediate early genes (IEGs), which are known as early regulators of cell growth and differentiation. IEGs are activated in response to stimuli mediated by Ang II and/or other mechanical factors and are the first response to stimuli by activating the genome, before the onset of protein synthesis. Examples of known IEGs are, early growth response 1 (EGR1), FBJ murine osteosarcoma viral oncogene homolog (FOS) and jun proto-oncogene (JUN)16.
Examples of other transcription factors that regulate cardiac hyper-trophy at a transcriptional level are: GATA binding protein 4 (GATA4), activating protein-1 (AP-1), myocyte enhancer factor 2 (MEF2) and nuclear factor of activated T-cells 5 (NFAT5) 17. NFAT5, a member of the NFAT-family, is a transcription factors regulated by calcineurin/ calcium that are involved in cellular proliferation; NFAT5 mRNA expression is particularly high in proliferating cells18.
Another transcriptional regulator of hypertrophic genes is histone deacetylase 5 (HDAC5). HDAC5 can repress the expression of pro-hypertrophic genes by histone deacetylation, which restrict transcriptional activation by promoting chromatin condensation.19 HDAC5 can also regulate differentiation of mesoderm cells into cardiomyocytes20.
Introduction
19
Growth factors and hypertrophic stimulus Polypeptide growth factors; transforming growth factor (TGF), insulin-like growth factor (IGF) and fibroblast growth factor (FGF), are involved in the signalling transduction of the cardiomyocyte and in regulation of myo-cardial growth and differention21-23. Transforming growth factor-beta 2 (TGF-β2) can differentiate embryonic stem cells into cardiomyocytes and is involved in cardiac development24-25. TGF-β2 is also a regulator of cardiac
Figure 2: A schematic overview of major signalling pathways implicated to be involved in cardiac hypertrophy, such as G-proteins, RhoA, calcineurin , RAS-MAPK-MEK, and JAK-STAT, and the relation to receptors and transcription factors.
Experimental studies on Cardiac Hypertrophy
20
remodelling in cardiac hypertrophy and promotes the fetal gene program by alteration of expression by binding to the TGF-β receptor, thereby activating cytoplasmic signalling pathways26-27.
Another type of growth factor that has been implicated in cardiac hypertrophy is the platelet derived growth factor BB (PDGF BB). The expression of PDGF BB rises as a response to stress and pressure overload and PDGF BB is, in turn, can promote hypertrophy28-29.
Angiotensin II (Ang II) and endothelin 1 (EDN1) are hypertrophic stimuli that bind to the G-protein coupled receptor, activating signalling cascades. Ang II is a pro-hypertrophic octapeptide that is produced by conversion of Angiotesin-1 (Ang I) by the angiotensin converting enzyme (ACE). Ang II can, in turn, be converted to angiotensin 1-7 (Ang 1-7) by the angiotensin converting enzyme 2 (ACE2). Ang II is released from the cardiomyocyte as an initial response to hypertrophy but can also bind to the G-protein coupled receptor to promote hypertrophic signalling inside the cardiomyocyte30. EDN1 is a protein that, just like Ang II, is both released from the cardiomyocytes as a response to cardiac hypertrophy and a stimulus when binding to a G-protein coupled receptor of the cardiomyocyte31.
Fetal gene program In a fetus, before birth, energy supply of the cardiac metabolism primarily consists of carbohydrates. After birth, the cardiac metabolism switches to the use of oxidation of fatty acids32. A feature of the failing heart muscle, such as cardiac hypertrophy, is the return to expressing fetal genes. This switch to “the fetal gene program” is accompanied by the expression of different isoforms of metabolic enzymes and other proteins with the purpose of helping the heart to adapt to an increased workload.
Specific features include: increased expression of atrial natriuretic peptide (ANP), TGF-β, IEGs, isoform switches of many other proteins including metabolic enzymes and sarcomeric proteins (relative increase of myosin heavy chains 7 (MYH7) compared to myosin heavy chains 6 (MYH6), and α-actins)11.
Hypertrophic cardiomyopathy Hypertrophic cardiomyopathy (HCM) is defined as “myocardial hypertrophy without obvious cause”, meaning that no hemodynamic stress signal can be associated to have caused the hypertrophic myocardium33.
HCM can show a high degree of variability particularly in the age of onset and the clinical severity. HCM is most commonly caused by 1 of over
Introduction
21
1000 different mutations found in one of 11 (or more) sarcomeric genes with a prevalence of about 0.2 percent of the general population33.
HCM is inherited in an autosomal dominant fashion, children of carriers are generally considered to have 50 percent risk of inheriting the mutation. However, approximately half of all cases are sporadic with no previous family history of HCM34.
Extracellular signalling Cell-to-cell communication is enabled in many different ways via direct cell-cell contact and soluble mediators. However, another way for cells to communicate is via the release of membrane enclosed vesicles that transport signals and information, protected from the extracellular environment, from donor- to recipient cell locally and/or at a distance.
Vesicles “Vesicle” is typically an expression used for membrane enclosed bodies that transfer signals between different compartments/organelles inside the cell (e.g. the endoplasmatic reticulum (ER) and the Golgi complex). Depending on the protein surrounding them, these vesicles can generally be divided into three groups,: coat protein I (COPI)-coated, coat protein II (COPII)- coated and clathrine-coated vesicles35. However the term “vesicles” are also used as a collective expression for membrane enclosed bodies secreted into the extracellular environment.
Extracellular vesicles Today, several different types of extracellular vesicles have been identified36. The difference between these vesicles can be found in their cellular origin/their biogenesis. An attempt has been made to separate them by size and density since such characteristics can act as a suitable feature used for isolation and purification. However, this attempt has not been resolved and remains unclear37, even to the extracellular vesicle society.
The most common types of extracellular vesicles that are named in literature are: microvesicles, exosomes, prostasomes and apoptotic bodies. Microvesicles and exosomes will be presented in detail further down. Prostasomes are generally considered to be larger in size (40-490 nm in diameter) and, as told by the name, originate from the prostate38. Apoptotic bodies are between 1-4 µm in size, irregular in shape and originate from cells undergoing apoptosis39 . The glucose-regulated protein 78 (GRP78) is a protein that are commonly used as a marker for apoptotic
Experimental studies on Cardiac Hypertrophy
22
bodies since it is associated with the endoplasmatic reticulum and is released in response to cellular stress40.
The issue of nomenclature The confusion in nomenclature in the literature makes it hard to clearly elucidate the differences in function and characteristics between the different types of extracellular vesicles. Further on, in this thesis the distinction between different extracellular vesicles are made by size, since this is the most common way of separation in literature, today.
To make this topic even more confusing, some scientists have taken upon themselves to name the extracellular vesicles according to the cell type that release them. This might be appropriate if this was done in consensus.
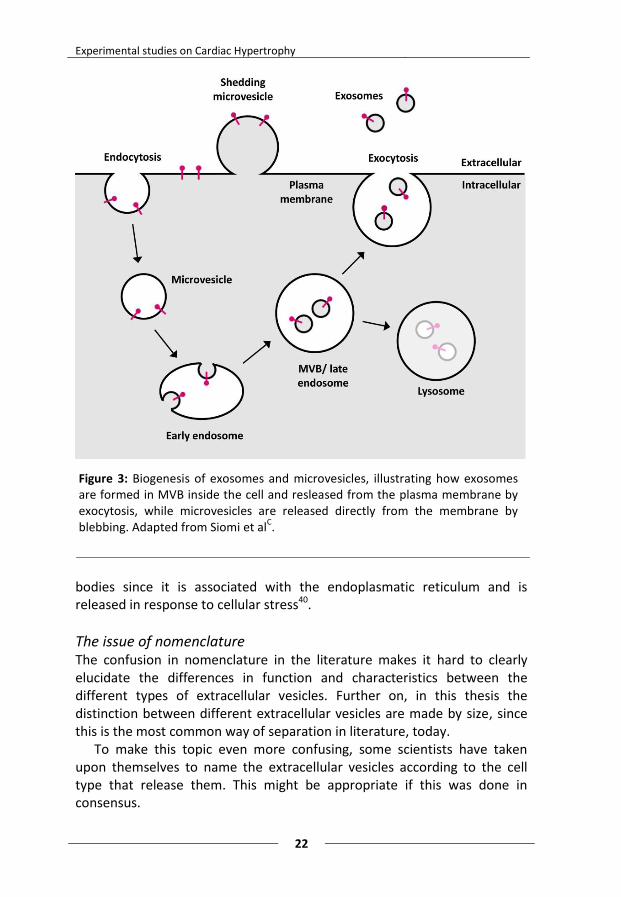
Figure 3: Biogenesis of exosomes and microvesicles, illustrating how exosomes are formed in MVB inside the cell and resleased from the plasma membrane by exocytosis, while microvesicles are released directly from the membrane by blebbing. Adapted from Siomi et al
C.
Introduction
23
Microvesicles The term microvesicles most often refers to extracellular vesicles that are over 100 nm in size and are secreted from the cell by blebbing directly from the cell membrane (figure 3)37. Microvesicles are released from a wide range of cells and commonly used biomarkers are integrins and cell specific markers depending on the mother cell (table 1)41.
Exosomes Exsosomes are another type of extracellular vesicle and are generally known as nano-sized particles (30-100 nm in diamtere) generated in multivesicular bodies (MVB) inside the cell and released by exocytosis after the fusion of MVB to the plasma membrane (figure 3)42-43. Exosomes are produced by a variety of cells, e.g. immune cells, epithelial cells and tumor cells. Commonly used markers for identification of exosomes are: the CD63 molecule (CD63), the CD9 molecule (CD9) and the tumor susceptibility gene 101 (TSG101) (table 1)44.
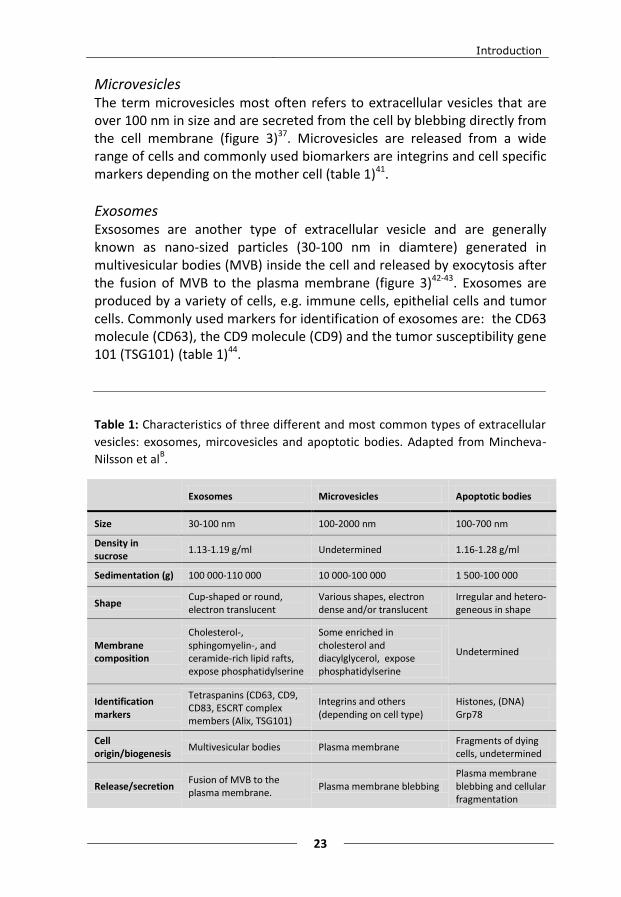
Table 1: Characteristics of three different and most common types of extracellular
vesicles: exosomes, mircovesicles and apoptotic bodies. Adapted from Mincheva-
Nilsson et alB.
Exosomes Microvesicles Apoptotic bodies
Size 30-100 nm 100-2000 nm 100-700 nm
Density in sucrose
1.13-1.19 g/ml Undetermined 1.16-1.28 g/ml
Sedimentation (g) 100 000-110 000 10 000-100 000 1 500-100 000
Shape Cup-shaped or round, electron translucent
Various shapes, electron dense and/or translucent
Irregular and hetero-geneous in shape
Membrane composition
Cholesterol-, sphingomyelin-, and ceramide-rich lipid rafts, expose phosphatidylserine
Some enriched in cholesterol and diacylglycerol, expose phosphatidylserine
Undetermined
Identification markers
Tetraspanins (CD63, CD9, CD83, ESCRT complex members (Alix, TSG101)
Integrins and others (depending on cell type)
Histones, (DNA) Grp78
Cell origin/biogenesis
Multivesicular bodies Plasma membrane Fragments of dying cells, undetermined
Release/secretion Fusion of MVB to the plasma membrane.
Plasma membrane blebbing Plasma membrane blebbing and cellular fragmentation
Experimental studies on Cardiac Hypertrophy
24
Function All cells secrete extracellular vesicles. The functions of these are diverse but can roughly the divided in three areas: communication (near and far), elimination of cellular compartments/contents and antigen presentation. These functions are used in different ways in physiological processes as well as in disease states.
The function of eliminating cellular compartments and components, without apoptosis is well studied. In the example of maturing red blood cells were the decrease in size and loss of nucleus is partly executed by the release of exosomes45. This way cellular material can be recycled and used by other cells or simply discarded.
With antigen presentation, exosomes are involved in protecting the fetus from the maternal immune response46. Exosomes derived from the placenta contain maternal antigens and surround the fetus, thereby “hiding” the fetus antigens from foreign recognition by the maternal immune system. Instead the maternal immune system recognizes the exosomes as maternal.
However, since the vesicles contain proteins, ribonucleic acid (RNA) and deoxyribonucleic acid (DNA), the most obvious function of extracellular vesicles must be communication47-48. The biological content can serve as a signalling system protected from the extracellular environment by a lipid membrane and released into target cells. Inside the target cell the content can change gene expression and influence other metabolic and functional pathways.
Extracellular vesicles in disease Extracellular vesicles with a range of functions and contents have been associated with different diseases and syndromes. Most research regarding extracellular vesicles involved in disease has been made with regard to different cancers, where it has clearly been shown that extracellular vesicles are involved in the pathological process49. Examples of other diseases and disease states with involvement of extracellular vesicles are: kidney injury50, liver cirrhosis51, inflammation52 and Alzheimer’s disease53.
The main goals for many types of research on extracellular vesicles involved in disease are the possibility of using extracellular vesicles as a future way of treatment or as biomarkers. Isolating organ-, tumour- or disease specific extracellular vesicles from serum of a patient, loading the extracellular vesicles with suitable medication and then give the extracellular vesicles back to the patient is a vision for many scientists. The hope is to only medicate the disease, not the whole body. Another clinical way of using extracellular vesicles is as a biomarker for different diseases or
Introduction
25
disease states. Circulating extracellular vesicles are easily isolated and purified from patient plasma. If extracellular vesicles originating from diseased cells are different from extracellular vesicles originating from healthy, normal cells, they could serve as biomarkers. This could also be useful when a disease onset differs between individuals or if the diseases have to be followed over time, enabling the right treatment at the right time.
Extracellular vesicles in the cardiovascular system In the cardiovascular system extracellular vesicles with different cellular origins have been identified. It is now known that both cardiac fibroblasts54 and cardiomyocytes55 possess the ability to release and communicate via extracellular vesicles.
In cardiovascular disease smooth muscles cells in the vascular system release extracellular vesicles that may be involved in vascular calcification56. It has also been shown that exosomes derived from mesenchymal stem cells have been found to reduce infarction size in a mouse model of myocardial ischemia ischemia57.
Gene expression
The central dogma of life The central dogma of life is a simplified way of describing the way that cells convert DNA to messenger RNA (mRNA) which is then translated to proteins. DNA is the map of how proteins should be assembled and is located in the cell nucleus (and mitochondria) where it is protected from degradation. Proteins are produced by ribosomes in the cell cytoplasm. This discrepancy in cellular compartments has been solved with an intermediate transcription of DNA to mRNA. mRNA is transcribed inside the nucleus after which it is transported to the cytoplasm. In the cytoplasm the ribosomes translate mRNA to proteins. This way the DNA stays protected while the proteins are assembled directly in the cytoplasm.
Different RNAs There are different types of RNA in the human body. Roughly they can be divided into coding and non-coding RNAs, where the coding RNAs consist of mRNA. The non-coding RNAs are, as told by the name, not translated to proteins but are instead involved in the regulation of transcription and translation.
The RNAs that directly are involved in transcription and translation are: mRNA, rRNA and transfer RNA (tRNA). Where mRNA is the blueprint from
Experimental studies on Cardiac Hypertrophy
26
which the protein is constructed, rRNA is part of the ribosome structure and tRNA is responsible for matching the right amino acid to the right position in the protein assembly.
RNAs that are strictly regulatory are: microRNA (miRNA), small interfering RNA (siRNA) and double stranded RNA (dsRNA). These types of RNAs regulate the transcription in a negative fashion. miRNA inhibit the translation by binding to a corresponding mRNA and thereby accelerating the degradation of specific mRNA. siRNA act in a similar way as miRNA and dsRNA is also involved in mRNA degradation.
Whole genome miroarray In microarray, the amount of mRNA is measured and compared between different states (control and disease/treated). In whole genome microarray the amount of all mRNAs are measured at the same time, compared to real time PCR where mRNAs are measured one at a time. The amount of mRNA mirrors the activity of which the genes in the nucleus are transcribed to mRNA and gives a snapshot of the transcriptional activity at a certain time point. The mRNA measured is often referred to as “gene transcripts” and microarray as a method is often referred to as analysis of the transcriptome in the literature. Transcriptome is an expression that is used when discussing all gene transcripts at the same time, just as the term genome is used when talking about all genes.
Microarrays that include a large amount of genes, but not all, are also available. They are often specialized on gene transcripts associated with a specific disease or condition.
Analyzing microarray data When analyzing microarray data there are a lot of aspects to consider before actual conclusions can be drawn. Normalization, statistical filtering, validation and conclusions must be carefully handled and evaluated. Evaluation of the internal controls must be made for each specific run. They will give information on how good the hybridization, labelling, background and signal intensity are. This information is further used in the normalization of the data at analysis.
Normalization Normalization is a necessary step in the analysis of microarray when comparing data from different arrays. The laboratory procedure of microarrays can be systematically biased in many ways, in the: RNA extraction, reverse transcription, label incorporation and exposure.
Introduction
27
Systematic variations can also appear due to characteristics of the array, such as effects of different probes, spotting- and region effects.
With the use of internal controls, normalization attempts to compensate for such effects. It is also necessary to make sure that the data is actually comparable. Normalization will always make data look increasingly similar. However, this will only work if the data is comparable.
Normalization consists of several steps: background correction, transformation/scaling and robust estimation of a “rescaling” factor (e.g. median of differences). There are many normalization methods to choose from. Which method that is the most stable and gives the best results is dependent on the type of data. It is, therefore good to try several methods initially and then inspect and compare the results before choosing which method to use.
Statistical filtering Statistical filtering of the microarray data is used to find trustworthy results to discuss. It is important to set the statistical significances to the appropriate levels. The signal intensity should be well over noise, the detection and signal p-value should be significant, false discovery rate58 must be considered and fold-change should be set so that the difference in differential expression is significant. All this must be done, the same way, to all data if it is to be compared.
Validation Microarray is a method with both strengths and weaknesses. A strength is the high throughput; it is a rather quick and easy method for analysis of the whole transcriptome at the same time. The data generated is vast and a lot of conclusions can be drawn and new hypotheses can be found. However, a weakness is that this vast amount of data is produced at the expense of sensitivity and accuracy. After filtering it is, therefore, important to validate the results by choosing interesting gene transcripts that are also analysed with real time PCR. If the results are similar the PCR validates that the microarray run was trustworthy.
Gene expression in cardiac hypertrophy To gain insights into the underlying genetics and transcriptomics of cardiac remodelling and hypertrophy, several gene expression microarray studies have been carried out.
Gene expression studies on different animal models (mice and rat) have made it possible to relate gene expression patterns to sex, acute and late aortic constriction-induced hypertrophies, myocardial infarction, hyper-
Experimental studies on Cardiac Hypertrophy
28
tension, different mutations and quantitative measurements of cardiac growth59-67. These studies have provided insights into the underlying genetics and transcriptomics of cardiac remodeling and hypertrophy.
However, very few human HCM gene expression studies have been carried out, to my knowledge only two projects on heart biopsies. In 2001, Lim et al. performed a DNA subtraction hybridization analysis of tissue from septal myectomies, performed on a single human heart with HCM and compared to a normal heart. Confirmation of the results was done in six more HCM hearts. Up regulation of markers of cardiac hypertrophy such as alpha skeletal actin, isoforms of myosin light chains and BNP was found68. In 2002, Hwang et al. investigated end-stage heart failure due to HCM in 2 patients as well as dilated cardiomyopathy (DCM) in 3 patients by using an in-house spotted cDNA microarray from cardio-vascular cDNA libraries. A total of 192 genes were highly expressed in both HCM and DCM (e.g. ANP, decorin, elongation factor 2 and heat shock protein 90) and 51 genes were down-regulated in both conditions (e.g. elastin and sarco-/endoplasmic reticulum Ca ATPase, SERCA)69.
Introduction
29
Aims of the thesis
Overall aim The overall aim of this thesis was to study transcription patterns and extracellular signalling of the hypertrophic heart to better understand the mechanisms initiating, controlling and maintaining cardiac hypertrophy.
Specific aims
Paper I To study if differences in gene expression between healthy and hypertrophic hearts contribute to a better insight into how the genes are regulated and translated and to elucidate whether microarray gene expression can be a candidate for biomarker identification of disease state.
Paper II To find a way of exploring the vast amount of data that microarray gene expression produces. To investigate if OPLS-DA can be used as a screening method to find interesting expression patterns among known gene groups in the microarray gene expression data, thereby formulating new hypotheses.
Paper III To investigate if cardiomyocytes can communicate extracellularly by secretion of microvesicles and exosomes.
Paper IV To study if there are differences in the characteristics and contents of exosomes derived from growth factor stimulated cardiomyocytes and, if so, can these differences be used as candidate biomarkers for cardiac hypertrophy.
Experimental studies on Cardiac Hypertrophy
30
Presentation of papers
Paper I “Pro and anti hypertrophic mechanisms are balanced by transcriptional regulation of cardiac genes in hypertrophic cardiomyopathy”
Cardiac myectomies/biopsies from 8 patients with HOCM and 5 controls without cardiac disease were studied with whole genome Illumina microarray gene expression (detecting 18 189 mRNA) to disclose differences in gene expression. In the HOCM myocardium compared to controls, there was a significant transcriptional down-regulation of the MYH6 gene, two immediate early genes; EGR1 and FOS, and a significant transcriptional up-regulation of the ACE2, JAK2 and HDAC5 genes. The transcriptional regulation revealed both pro and anti hypertrophic mechanism and processes. The pro hypertrophic response is represented by the transcriptional down-regulation of MYH6, indicating that the switch to the fetal gene program is maintained, and the transcriptional up-regulation of JAK2 in JAK-STAT pathway. The anti hypertrophic response was represented by the transcriptional down-regulation of the IEGs, FOS and EGR1, and a transcriptional up-regulation of ACE2 and HDAC5. This can be interpreted as a transcriptional “terror balance” in the heart of the HOCM patients, neither growing nor suppressing the already hypertrophic myocardium.
Paper II “OPLS-DA of Myocardial Gene Expression in the Progression of Cardiac Hypertrophy in Aorta Ligated Rat” Aorta ligated rats were sacrificed at the acute (1 day), the adaptive (6 days) and the stable phase/stage (42 days) of hypertrophy. Myocardial tissue from 6 aorta ligated and 6 sham operated (controls) were analyzed with whole genome Illumina microarray gene expression and MVDA (PCA and OPLS-DA) to reveal differences and patterns in the gene expression over time.
Presentation of papers
31
Of the 43 groups of gene transcripts analyzed, ultimately 6 gene groups were found to have interesting clusters associated with the sham operated and/or the aorta ligated rats: “atherosclerosis”,” cardiotoxicity”, “ECM and adhesion molecules”, “fatty acid metabolism”, “glucose metabolism” and “mitochondria”. These results were confirmed by the finding that the “ECM and adhesion molecule” group were different in aorta ligated compared to controls which had previously been shown in a study by Hellman et al.70. This finding also highlights that extracellular processes play an important role in the hypertrophic progression. To conclude, OPLS-DA is a very useful and powerful tool when analyzing gene expression data, especially in finding clusters of gene groups not seen with traditional statistics (e.g. fold-change). New hypotheses can be generated and further analyzed in detail. OPLS-DA is a good complement to traditional statistics.
Paper III
“Cardiomyocyte Microvesicles Contain DNA/RNA and Convey Biological Messages to Target Cells”
Microvesicles derived from cultured cardiomyocytes (HL-1) were isolated by differential ultracentrifugation. The microvesicles were identified by transmission electron microscopy and flow cytometry. mRNA and DNA (by conversion of DNA to cRNA with dGPT and TdT) were identified and analysed with whole genome Illumina microarray gene expression (detecting 18 189 mRNA).The electron microscopy (EM) and flow cytometry revealed that the microvesicles were surrounded by a bilayered membrane and contained caveolin-3 and flotillin-1. Three hundred and forty three different chromosomal DNA sequences were identified in the microvesicles. The microvesicles were co-cultured with fibroblasts (NIH 3T3) and by staining of the microvesicle DNA, confocal microscopy could be used to identify microvesicles in the fibroblast cytosol and in the nuclei. Gene expression in the co-cultured fibroblasts was affected. These results suggest that microvesicles are released from cardiomyocytes, that they contain DNA and that they might be involved in processes and events in target cells by including gene expression changes.
Experimental studies on Cardiac Hypertrophy
32
Paper IV
“Characteristics of exosomes derived from cultured cardiomyocytes treated with different growth factors”
To further analyze and characterize exosomes released from cultured cardiomyocytes (HL-1), the HL-1 cells were incubated with growth factors (TGF-β2 or PDGF BB) for 23 h at 37°C. Exosomes were isolated and collected from harvested cell culture medium. The exosomes were characterized with dynamic light scattering (DLS), western blot, electron microscopy (EM) and Illumina whole genome microarray gene expression. The growth factor incubated exosomes had an average diameter of 50-80 nm that was similar to the one of control exosomes. The control group contained 623 mRNA after filtering with detection p-value <0,01. The TGF-β2 group contained 691 mRNA and the PDGF BB group contained 362 mRNA with detection p-value <0,01. A large, for all exosomes common pool of mRNA seems stable and a smaller pool varied in mRNA content according to treatment of the maternal cardiomyocyte. Thus 235 mRNA are common for all exosomes. Control exosomes contained 138 specific mRNA and TGF-β2 exosomes contained 200 specific mRNA and PDGF BB exosomes contained 73 specific mRNA. Of the common mRNA 14% were ribosomal, 5% had connection to the energy supply system and the mitochondria and 14% of unidentified locus. We conclude that different treatments of the cardiomyocyte influence the characteristics of the exosome produced, indicating that the signal function of the exosome varies according to the state of the cardiomyocyte.
Methodology
33
Methodology
Patient material Following receipt of written consent, 8 myectomies from unrelated patients with hypertrophic obstructive cardiomyopathy (HOCM) were collected between November 2005 and April 2007. The HOCM patients were diagnosed using criteria proposed by McKenna et al71. Three of the patients were also diagnosed with mild hypertension, not sufficient to be the underlying cause of the severe hypertrophic phenotype. The ECG grading of the left ventricular hypertrophy (LVH) was interpreted using the Romhilt-Estes score72. As controls myectomies/biopsies collected from 5 respirator patients, without cardiac disease and lost in accidents were used. Consent was given to the hospital administration of Hôpital Lariboisière in Paris according to French legislation. The ethical committees of Umeå, Uppsala and Paris approved of this study. (Paper I)
Rat model One hundred twenty two male Wistar rats with a body weight of approximately 200 g were sacrificed at 1, 6 and 42 days after operation. The animals were anesthetized with 0.2 ml pentobarbital intra-abdominally after which they had their aorta ligated (hypertrophic model) or sham operated (controls). In the aorta ligated animals a titanium clip with an inner diameter of 0.15 mm was placed around the aorta, just proximal to the renal arteries after abdominal incision. Control rats were age-matched and operated with exactly the same procedure but without ligation of the aorta. The heart-to-body weight (HBW) ratio was calculated to determine if cardiac hypertrophy had occurred in the ligated aorta hearts. The 6 hearts with the highest HBW ratio from each ligated aorta group were used for analysis. Handling and procedures of laboratory animals were performed according to the French regulation. (Paper II)
Cell culture Cell cultures were kept in an atmosphere of 95% air-5% CO2, 37ºC at a relative humidity of approximately 95%.
Cardiomyocytes HL-1 is an immortalized cardiomyocyte cell line derived from adult mouse heart, was obtained from Dr. W.C. Claycomb (Louisiana State University Medical Center, New Orleans)73. Cardiomyocytes were cultured in Claycomb medium (JRH. Biosciences) supplemented with 10% fetal bovine
Experimental studies on Cardiac Hypertrophy
34
serum (ultracentrifuged, JRH. Biosciences), 0.1 mmol/L norepinephrine (10 mmol/L norepinephrine (Sigma-Aldrich, St Louis, USA) was diluted 100-fold in 30 mmol/L ascorbic acid (Sigma-Aldrich, St Louis, USA)), 2 mmol/L L-glutamine (Life Technologies) and 100 U/mL penicillin, 100 µg/mL streptomycin (Life Technologies). During culture, the medium was changed every 24 h. (Paper III and IV)
Fibroblasts NIH 3T3 cells74 (ATCC CRL-1658, LGC Standards AB), a mouse embryonic fibroblast cell line, were cultured in Dulbecco’s modified Eagle’s medium (DMEM, Fisher Scientific) containing 10% calf serum (JRH, Biosciences), 2 mmol/L L-glutamine, 100 U/mL penicillin, and 100 µg/mL streptomycin. (Paper III)
Cell stimulation and harvest The HL-1 cells had, after approximately 72 h, grown to confluence. All media were then replaced with serum- and antibiotic-free media. The media were collected after 23, 24h or 48h of incubation. (Paper III-IV)
The HL-1 cells were stimulated with two different growth factors, TGF-β2 (10 ng/mL) and PDGF BB (100 ng/mL) (Biosource, Invitrogen). Cell cultures with no growth factor added were used as controls. After 23 h, the media from each growth condition was collected. (Paper IV)
The HL-1 and NIH 3T3 cells were washed with ice-cold phosphate buffered saline (PBS) (without calcium and magnesium, Fisher Scientific), and subsequently harvested by scraping and placed in RNAlater (Qiagen Hilden, Germany). (Paper III)
HL-1 cells were also harvested by trypsination after which they were washed twice in PBS and stored in -80°C. (Paper IV)
Extracellular vesicle isolation
Differential ultracentrifugation Collected cell culture media were centrifuged three times at 3 000x g for 20 min at 4°C to remove cell debris, followed by centrifugation three times at 10 000 x g for 20 min at 4°C. The acquired supernatants were ultra-centrifuged at 130 000 x g (49 000 rpm) for 2h at 4°C in a Beckman Optima™ MAX-E Ultracentrifuge (Beckman Coulter) with a MLS-50 rotor. The obtained pellet contained microvesicles and the supernatant contained soluble molecules. The pellets were dissolved in phosphate buffered saline (PBS).
Methodology
35
A similar ultracentrifugation of the fetal bovine serum was carried out before culture to rule out the contamination of microvesicles and exosomes in the culture medium. (Paper III)
Differential and gradient ultracentrifugation Collected cell culture media were centrifuged at 2 000 x g for 30 min at 4°C and at 10 000 x g for 35 min at 4°C, after which the supernatant was filtered on a 0.22-μm filter. The exosomes were then pelleted at 110,000 × g (25 300 rpm) for 2 hours at 4°C. The pellets were re-suspended in PBS. A sucrose gradient was prepared as ~9 mL each of 40%, and 20% sucrose. 1 mL of the exosome isolate was loaded on the top of the gradient, followed by immediate centrifugation at 110 000 × g for 2h at 4°C. After centrifugation, approximately a 2 mL fraction was collected from the band of the gradient. The fractions were washed with PBS at 110 000 × g for 2h t 4°C. The pellets were re-suspended in PBS. A similar ultracentrifugation of the fetal bovine serum alone was carried out to rule out the presence of any exosomes in the culture medium.
All ultracentrifugations were performed using a L-90 Beckman centrifuge (Beckman Instruments, Inc., Fullerton, CA) and the SW-41 rotor (Beckman Instruments, Inc., Fullerton, CA). (Paper IV)
Co-culturing of microvesicles and target cells NIH 3T3 cells (fibroblasts) were grown on 6-well plates and were incubated for 48h with serum-and antibiotic-free Claycomb medium that previously had been incubated for 24h with HL-1 cells (cardiomyocytes) (table 2, A). Table 2: The different supplements used in the co-culturing and microvesicle assay were fibroblasts were incubated with medium, medium supernatant and medium pellet, in paper III.
Fibroblast incubation with Remark Time
A Serum-and antibiotic-free Claycomb medium previously incubated for 24 h with HL-1 cells
Whole media 48h
B Ultra centrifuged Claycomb medium supernatant previously incubated with HL-1 cells was
Microvesicle free
48h
C Ultra centrifuged Claycomb medium pellet dissolved in DMEM previously incubated with HL-1 cells was
Microvesicles 48h
Experimental studies on Cardiac Hypertrophy
36
One part of the same Claycomb medium, previously incubated with HL-1 cells was ultra centrifuged at 130,000 x g for 2h at 4°C. The resulting supernatant (microvesicle free) was also incubated for 48h with NIH 3T3 cells (table 2, B). The isolated microvesicles/exosomes in the pellet disolved in DMEM and also incubated with NIH 3T3 cells for 48h (table 2, C). The stimulated fibroblasts were compared to control fibroblasts, incubated in fresh Claycomb medium or DMEM, respectively. (Paper III)
Flow cytometry analysis Microvesicles were analyzed on FACSCalibur (Becton Dickinson).
Membrane protein detection To detect proteins on the microvesicle surface a fluorescence-activated cell sorter (FACS) was used. The isolated microvesicles were stained with 250 ng mouse anti-annexin-2, mouse anti-clathrin heavy chain, mouse anti-flotillin-1 or mouse anti-caveolin-3 (BD Biosciences) in 100 µL PBS, for 20 min in the dark on ice. After adding 1.9 mL PBS and an additional ultra centrifugation to wash the pellet, it was resuspended in 100 µL PBS and 1 µL rat anti-mouse IgG phycoerythrin (PE) and incubated for 20 min, in the dark on ice. The ultracentrifugation was repeated and the pellet resuspended in PBS. (Paper III)
DNA detection To validate the presences of DNA on the in- or outside of the microvesicles, the FACS was used for analysis of DNA-stained microvesicles.
A 1 mL microvesicle stock solution was divided in four sub-samples; 250 µL was incubated with acridine orange (AO) (Invitrogen) to a final concentration of 20 µmol/L, 250 µL of the microvesicle/exosome stock solution was incubated with propidium iodide (PI) (Sigma) to a final PI concentration of 30 µmol/L, as a positive control an additional 250 µL was incubated with PI and genomic DNA to a final PI concentration of 30 µmol/L and the final unstained microvesicles 250 µL was used as control. AO is membrane permeable under ordinary conditions according to the manufacturer. PI is not membrane permeable under ordinary conditions according to the manufacturer.
Prepared staining solutions (PI (30 µmol/L) and AO (20 µmol/L), respectively) were incubated for 90 min at 21°C, protected from light. The microvesicles in the respective staining solution were pelleted by ultracentrifugation at 100,000 x g for 2 h. Supernatants were discarded and pellets were washed twice with PBS and the pellets were resolved in PBS
Methodology
37
and adjusted to the same starting volume (1 mL). The control sample was treated in the same way as the stained samples.
The DNA-stained microvesicle/exosome samples were prepared for flow cytometric analysis by adding 500 µL of the samples to four tubes. The fluorescence was analyzed at appropriate fluorescence emitting wavelengths; 525±15 nm for AO and 670/Long pass (LP) for PI. (Paper III)
Electron microscopy For the electron microscopy, the microvesicles were fixed for 6h in a solution containing 3% glutaraldehyde in 75 mmol/L sodium cacodylate buffer (pH 7.4) with 4% polyvinylpyrolidone and 2 mmol/L CaCl2. Then they were rinsed in the same buffer for one hour. Finally they were post-fixed in 1% osmium tetroxide over night at 4°C. After another rinse in buffer the sample was dehydrated in a graded series of acetone and then embedded in an epoxy resin. Ultrathin sections (70 nm) were cut, and collected on formvar coated copper grids. They were contrasted with uranyl acetate and lead citrate. The electron microscopy was performed with a JEOL 1200-EX (Jeol Ltd.). (Paper III)
Confocal microscopy To illustrate the microvesicle uptake into fibroblasts and to verify their DNA content the microvesicles were stained and incubated in the dark at room temperature for 90 min with 20 µmol/L AO. The sample was diluted to 4 mL and ultra centrifuged at 130,000 x g for 2h at 4°C after which the supernatant was removed to eliminate contamination of unincorporated AO. The AO-stained microvesicles were suspended in 1 mL PBS and were then put in a dialysis bag with a 3,500 MWCO dialysis membrane (Spectra/Por) and dialysed against 300 mL PBS for 24h. The dialysis buffer was changed once after 5h. The sample was once again ultra centrifuged and the pellet was dissolved and incubated in DMEM. The DMEM solution was incubated with fibroblasts for 3h and then grown for 24h on a cell culture microscope slide (Falcon). The slide was subsequently mounted with DAPI to stain fibroblast nuclei and studied in a Nikon Eclipse E800 confocal microscope. Light microscope was used to add a layer in images to visualize cell borders. (Paper III)
Western blot Before Wester blot the cells and exosomes were lysed with a standard lysis buffer and the protein concentrations were measured using a BCA protein assay kit (Pierce Protein Biology Products (USA).
Experimental studies on Cardiac Hypertrophy
38
Medium supernatant was separated by 10% SDS-PAGE. Protein was transferred to a polyvinylidene difluoride membrane using a Trans-blot Turbo Transfer system (Biorad, California, USA), according to the manufacturer's protocol. The blot was blocked with 5% bovine serum albumin (BSA) in Tris-buffered saline (TBS) containing 0.1% (v/v) Tween 20 (TBST). Mouse monoclonal anti-TSG101 (Abcam, UK), rabbit polyclonal anti-GRP78 (Abcam, UK) and mouse monoclonal anti-CD63 (BD Pharmingen, USA) were used as primary antibodies in the different experiments according to the manufacturer's protocols. Polyclonal rabbit anti-mouse or anti-rabbit IgG-horseradish peroxidase (HRP) secondary antibodies (Dako, Denmark) were used for 1h. After extensive washes with TBS, spots were detected by using ECL Advance Western Blotting Detection Kit (GE Healthcare Life sciences, UK). All Western blot experimental results were scanned using Molecular Imager® GelDoc™ (Biorad, California, USA). (Paper IV)
Dynamic Light Scattering Dynamic light scattering (DLS) is a method used to determine the size of small particles in suspension. DLS uses fluctuations in intensity of the scattered light, scattered by particles in solution as a function of time, to estimate size distribution. If a molecule was to be motionless, the amount of light scattered will be constant. However, since all molecules in solution diffuse with Brownian motion, the scattered light intensity will change over time. The slower the particles diffuse, the slower the intensity will change and vice versa. The speed of the intensity changes is, therefore, directly related to the movement of the molecule. The intensity of the scattered light change at a rate that is dependent upon the size of the particles; the bigger the molecules, the slower they move. The movement of the particles are also affected by the viscosity and temperature of the solution. By measuring the time scale of light intensity changes of molecules in the solution, DLS provides information regarding the average. (Paper IV)
DNA preparation Isolation of DNA was carried out on the HL-1 derived microvesicles with GenElute Mammalian Genomic DNA Miniprep Kit (Sigma-Aldrich, St Louis, USA). A microvesicular pellet was prepared from 18 mL Claycomb medium (one T75 culture flask) after 48h incubation with cardiomyocytes. Addition of a poly-T tail was performed by incubation of DNA with 25 µL 100 mmol/L dGTP (Gibco BRL, Life Technologies) and terminal deoxynucleotidyl transferase (TdT) (Invitrogen) for 30 min at 37°C, according to manu-facturer’s protocol. The constructed complementary DNA (cDNA) was
Methodology
39
purified and transcribed to synthesize biotinylated complementary RNA (cRNA) with Illumina Totalprep RNA Amplification Kit (Ambion) and further analysed with Illumina microarray. (Paper III)
RNA preparation The myectomies from patients and controls were excised and immediately placed in RNAlater (Qiagen, Hilden, Germany). After weighing of the rat heart they were also placed in RNAlater. (Paper I-II)
Total RNA was isolated from tissue or exosome samples, using the RNeasy Fibrous Tissue Kit (Qiagen, Hilden, Germany). RNA concentration was measured with a NanoDrop ND-1000 Spectro-photometer (NanoDrop Technologies) and the integrity of the RNA was analyzed with a 2100 Bioanalyzer (Agilent Technologies). (Paper I-IV)
Microarray gene expression analysis Aliquots of total RNA were converted to biotinylated double-stranded cRNA using the Illumina Totalprep RNA Amplification Kit (Ambion). The biotin labelled cRNA samples were hybridized on an Expression Beadchip and incubated with streptavidin-Cy3. The microarray analysis was scanned with the Illumina Beadstation GX (Illumina,). All studies can or will (after publication) be found in the Gene Expression Omnibus (GEO) (table 3). The microarray procedure can be overviewed in figure 4. (Paper I-IV)
Paper Species/material Illumina bead chip GEO Series accession number
I Human septal myectomies Sentrix Human Ref-8 GSE32453
II Rat left ventricle Sentrix RatRef-12 GSE21600
III Mouse cardiomyocyte cell line (HL-1)
Sentrix MouseRef-8
Cardiomyocytes: GSE21707 Microvesicle: GSE21707 DNA: GSE21707 Fibroblast: GSE21677
IV Mouse cardiomyocyte cell line (HL-1)
Sentrix MouseRef-8 GSE40503
Table 3: List of Illumina bead chips used and the corresponding GEO series accession number for all microarray studies. These studies can be found in the NCBI GEO database (http://www.ncbi.nlm.nih.gov/geo/).
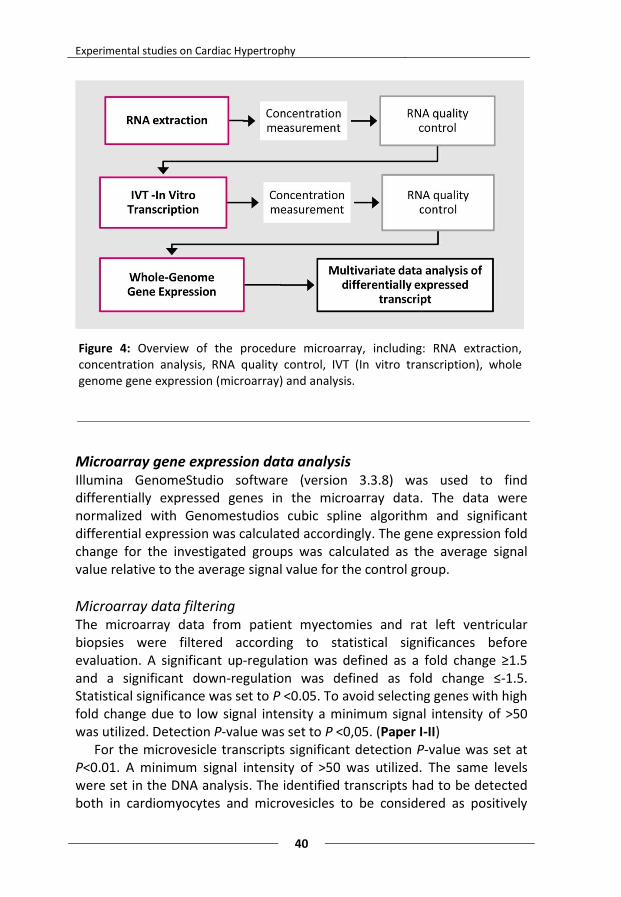
Experimental studies on Cardiac Hypertrophy
40
Microarray gene expression data analysis Illumina GenomeStudio software (version 3.3.8) was used to find differentially expressed genes in the microarray data. The data were normalized with Genomestudios cubic spline algorithm and significant differential expression was calculated accordingly. The gene expression fold change for the investigated groups was calculated as the average signal
value relative to the average signal value for the control group.
Microarray data filtering The microarray data from patient myectomies and rat left ventricular biopsies were filtered according to statistical significances before evaluation. A significant up-regulation was defined as a fold change ≥1.5 and a significant down-regulation was defined as fold change ≤-1.5. Statistical significance was set to P <0.05. To avoid selecting genes with high fold change due to low signal intensity a minimum signal intensity of >50 was utilized. Detection P-value was set to P <0,05. (Paper I-II)
For the microvesicle transcripts significant detection P-value was set at P<0.01. A minimum signal intensity of >50 was utilized. The same levels were set in the DNA analysis. The identified transcripts had to be detected both in cardiomyocytes and microvesicles to be considered as positively
Figure 4: Overview of the procedure microarray, including: RNA extraction, concentration analysis, RNA quality control, IVT (In vitro transcription), whole genome gene expression (microarray) and analysis.
Methodology
41
detected. Since cardiomyocytes reasonably are the source of microvesicular mRNA, they should themselves contain the same mRNA. Transcript from cultured the HL-1 and NIH 3T3 cells were filtered with the same steps as the patients myectomies and the rat biopsies. (Paper III)
For the statistical analysis of the exosome transcripts a significance level of P<0,01 was utilized on detection P-value. The detection P-value indicates that detection of the transcript is significant and thereby found in the exosome. (Paper IV)
Bioinformatics MetaCore™ (GeneGo Inc. USA) was used to find common transcriptional relations between transcription factors and genes in HCM to generate a direct interaction network. (Paper I)
MetaCore™ was also used to connect gene transcripts found in the microvesicles. (Paper III)
Real-time PCR Real time PCR was used to validate the microarray expression results. Three gene transcripts, found to be differentially expressed in the microarray analysis was analysed using an Applied Biosystems Prism 7900HT Sequence Detection System (Applied, California USA). Human cDNA-specific TaqMan Gene Expression Assays were used for the following genes: ACE2 (Assay ID Hs01085333_m1), EGR1 (Assay ID Hs00152928_m1) and MYH6 (Assay ID Hs00411908_m1) from Applied Biosystems (California, USA). Omniscript RT Kit (Qiagen, Hilden, Germany) was used to convert an aliquot of the remaining total RNA to cDNA.
As endogenous control the human cyclophilin A (PPIA; part number 432631E; Applied Biosystems) gene was chosen. It was chosen after confirmation as the most stable in myectomies when comparing with glyceraldehyde-3-phosphate dehydrogenase (GADPH) and large ribosomal protein (RPLPO).
All samples were run in triplicates and amplification was analyzed using Applied Biosystems Prism Sequence Detection Software (version 2.3). Relative quantification was calculated according to the comparative CT method (Applied Biosystems Inc, Foster City, CA) using a statistical confidence of 95%. The amount of target gene mRNA, normalized to an endogenous control and relative to a calibrator, is given by 2-ΔΔCT. The gene
expression fold change of the group of interest was calculated as the average 2-ΔΔCT value relative to the average 2-ΔΔCT value for the control.
(Paper I)
Experimental studies on Cardiac Hypertrophy
42
Statistics All analyses of the real-time RT-PCR data were performed with Predictive analytics software (PASW) (version 18.0, SPSS). Differences between two groups were compared using Mann-Whitney U test. Statistical significance was set to P <0.05. (Paper I)
Multivariate data analysis The gene expression data were arranged into a matrix (X = N x K) where N represents the rows for each individual and K denotes the columns of variables for each gene transcript measured. All data were normalized to unit variance. All multivariate data analyses were performed using the SIMCA-P+ 12.0.1 software (Umetrics, Umeå, Sweden).
Principal component analysis Principal component analysis (PCA)75 is a mathematical method that transforms a large set of variables into a smaller set of uncorrelated variables called principal components where the first principal component accounts for as much of the variability in the data as possible. Each subsequent component accounts for as much of the remaining variability as possible.
PCA is an unsupervised and non-parametric regression method (see Eq. 1) that is used to get an overview of the variation in the X matrix and detect outliers, trends and clusters in samples and variables. (Eq. 1) A latent variable is calculated such that the largest systematic variance in the X matrix is described. This variance is removed and a second latent variable is calculated which in turn explains the maximum proportion of the remaining variance, and so on. These latent variables or principal components are called scores (T). Each original variables (in this case the measured gene transcripts, K) weight, for the latent variables is described by the loading P. Any non-systematic variation is described by the residual E. Without loss of information, the dimensionality of the data is greatly reduced and the interpretation is simplified.
To summarize; PCA is a method where the principal components are linear combinations of the original variables weighted by their contribution to explaining the variance in a particular orthogonal dimension. (Paper I and II)
Methodology
43
Orthogonal partial least squares – discrimination analysis Orthogonal partial least squares (OPLS)76 is a supervised regression method developed from partial least squares (PLS)77 that includes an orthogonal signal correction filter. When OPLS is used in combination with a discrimination analysis you have Orthogonal partial least squares – discrimination analysis (OPLS-DA). The main benefit and difference between PLS-DA and OPLS-DA lies in the ability of OPLS-DA to separate predictive from non-predictive (orthogonal) variation.
In OPLS, the variation is described in the X matrix, which in turn is correlated with a response matrix Y. A categorical response matrix Y is created, with “dummy” variables for the different classes of samples. Sham operated animals were given a response of 1 and aorta ligated animals 0.
The variation in the Y matrix is used to divide the variation in the X matrix into three parts. Systematic variation in X correlated to Y (predictive), systematic variation in X non-correlated to Y (orthogonal) and non-systematic variation in X (residual) (see Eq. 2). TP and PP describe the Y predictive scores and loadings, respectively, while TO and PO described the Y orthogonal scores and loadings. The residual in matrix X is described by E. (Eq. 2) The WS was used for OPLS-DA model calculation and the TS were used for model validation. A working set (WS) and a test set (TS) are constructed from the PCA model using an in-house developed script for MatLab (v.7.9) using a space filling algorithm. (Paper II) Model construction and gene group evaluation A PCA model was constructed on the control and HOCM data matrices for evaluation of the influence of patient history on sample clustering. (Paper I)
A total of four data matrices were constructed by pre-filtering of the different time point data: three local matrices (one for each time point separately) and one global matrix containing all time points together (figure 5, 1). From these data matrices four PCA models were constructed in which outliers and sample clusters were evaluated (figure 5, 2).
Prior to OPLS-DA, the global matrix was extended with 43 functional gene lists (e.g. cell cycle, inflammation and mitochondria) gathered according to assumed relevance to cardiac hypertrophy from the catalogued array at SABiosciences website. Among the extended global matrix a global OPLS-DA model was constructed. From the 43 gene groups 12 showed clustering and associations to the animal groups in the OPLS-DA (figure 5, 3). Each local model for day 1, day 6 and day 42 were then
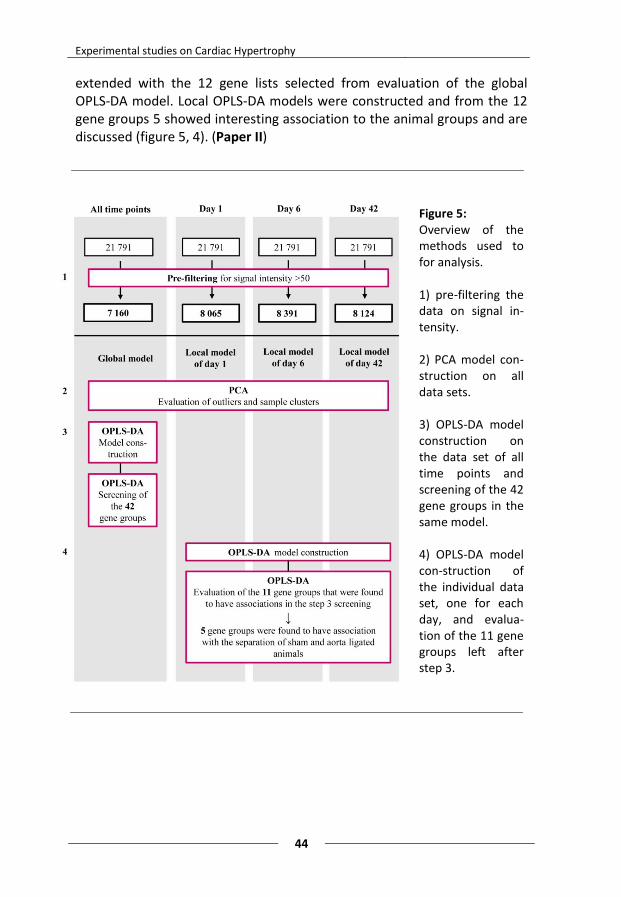
Experimental studies on Cardiac Hypertrophy
44
extended with the 12 gene lists selected from evaluation of the global OPLS-DA model. Local OPLS-DA models were constructed and from the 12 gene groups 5 showed interesting association to the animal groups and are discussed (figure 5, 4). (Paper II)
Figure 5: Overview of the methods used to for analysis. 1) pre-filtering the data on signal in-tensity. 2) PCA model con-struction on all data sets. 3) OPLS-DA model construction on the data set of all time points and screening of the 42 gene groups in the same model. 4) OPLS-DA model con-struction of the individual data set, one for each day, and evalua-tion of the 11 gene groups left after step 3.
Results
45
Results
Paper I
Clinical analysis of cohort The HOCM cohort (n = 8, 3 men and 5 females) had a mean age at diagnosis of 60.5±17.0 years with a mean maximum myocardial wall thickness of 18.6±2.5 mm and a mean LVOT-obstruction gradient of 79±46 mmHg. The mean NT pro BNP level was 5 253 ± 8 906 ng/l. All patients had a preserved systolic left ventricular function with normal fractional shortening.
The control group contained respirator patients without heart disease that were lost in accidents with a mean age of 61±17 years.
Multivariate data analysis The PCA analysis revealed a dispersed control group and three clusters in the HOCM patient group, which could not be explained by patient history (e.g. age, sex, medication and other diseases).
Illumina GEX
Designation Description P-value Fold change
ACE ↓ angiotensin I converting enzyme (peptidyl-dipeptidase A) 1 0,968 -1,09
ACE2 ↑ angiotensin I converting enzyme (peptidyl-dipeptidase A) 2 0,0016 6,50
EDN1 ↓ endothelin 1 0,703 -1,18
EDN2 ↓ endothelin 2 0,648 -1,30
EDN3 ↓ endothelin 3 0,708 -51,19
EGR1 ↓ early growth response 1 0,057 -2,27
FOS ↓ v-fos FBJ murine osteosarcoma viral oncogene homolog 0,0007 -9,57
HDAC5 ↑ histone deacetylase 5 0,008 2,52
JAK2 ↑ janus kinase 2 (a protein tyrosine kinase) 0,00001 2,85
JUN ↓ jun oncogene 0,216 -1,34
JUNB ↓ jun B proto-oncogene 0,892 -1,26
MYH6 ↓ myosin, heavy chain 6, cardiac muscle, alpha 0,000005 -3,51
MYH7 ↓ myosin, heavy chain 7, cardiac muscle, beta 0,86 -1,03
NPPA ↑ natriuretic peptide precursor A 0,029 6,28
NPPB ↑ natriuretic peptide precursor B 0,340 2,30
Table 3: List of gene transcripts with interesting results/regulations that will be discussed in paper I.
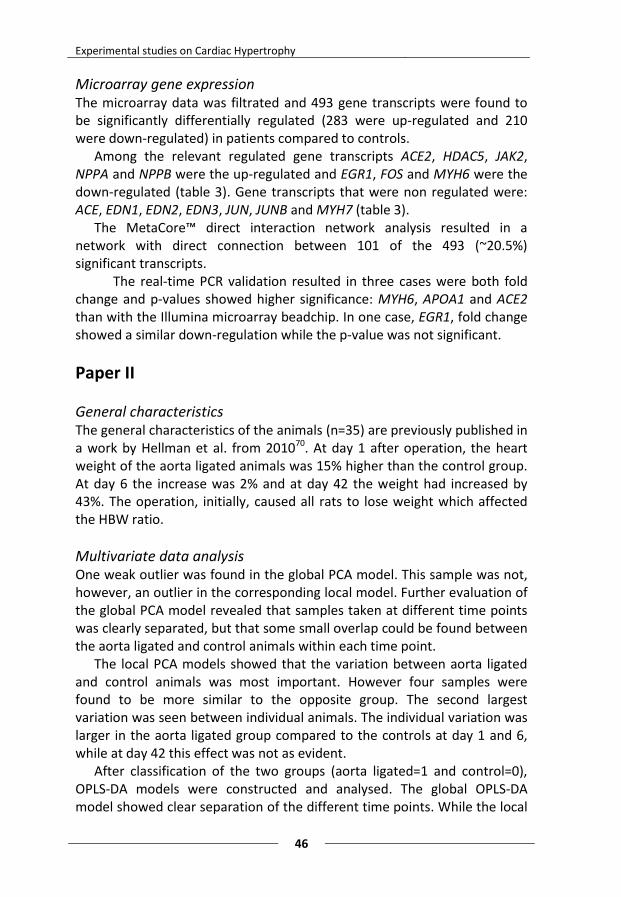
Experimental studies on Cardiac Hypertrophy
46
Microarray gene expression The microarray data was filtrated and 493 gene transcripts were found to be significantly differentially regulated (283 were up-regulated and 210 were down-regulated) in patients compared to controls.
Among the relevant regulated gene transcripts ACE2, HDAC5, JAK2, NPPA and NPPB were the up-regulated and EGR1, FOS and MYH6 were the down-regulated (table 3). Gene transcripts that were non regulated were: ACE, EDN1, EDN2, EDN3, JUN, JUNB and MYH7 (table 3).
The MetaCore™ direct interaction network analysis resulted in a network with direct connection between 101 of the 493 (~20.5%) significant transcripts.
The real-time PCR validation resulted in three cases were both fold change and p-values showed higher significance: MYH6, APOA1 and ACE2 than with the Illumina microarray beadchip. In one case, EGR1, fold change showed a similar down-regulation while the p-value was not significant.
Paper II
General characteristics The general characteristics of the animals (n=35) are previously published in a work by Hellman et al. from 201070. At day 1 after operation, the heart weight of the aorta ligated animals was 15% higher than the control group. At day 6 the increase was 2% and at day 42 the weight had increased by 43%. The operation, initially, caused all rats to lose weight which affected the HBW ratio.
Multivariate data analysis One weak outlier was found in the global PCA model. This sample was not, however, an outlier in the corresponding local model. Further evaluation of the global PCA model revealed that samples taken at different time points was clearly separated, but that some small overlap could be found between the aorta ligated and control animals within each time point.
The local PCA models showed that the variation between aorta ligated and control animals was most important. However four samples were found to be more similar to the opposite group. The second largest variation was seen between individual animals. The individual variation was larger in the aorta ligated group compared to the controls at day 1 and 6, while at day 42 this effect was not as evident.
After classification of the two groups (aorta ligated=1 and control=0), OPLS-DA models were constructed and analysed. The global OPLS-DA model showed clear separation of the different time points. While the local
Results
47
OPLS-DA models revealed that the aorta ligated group at day 6 were much more disperse than the corresponding control group. This diversity is not seen at day 1 and 42. By prediction of class identity of the TS animals, the robustness of the OPLS-DA model was evaluated. In the global model 34 animals were correctly predicted and in the local models 33 animals were correctly predicted. The incorrectly predicted animal in the global model remained incorrect in the local model together with another aorta ligated animal at day 1 that was predicted as control.
After screening for associations among the 42 gene groups in the sub-divided global model for each time point, 12 gene groups, where most gene transcript clustered, were selected for further evaluation in the local models. Five of the 12 gene groups were considered to have clear associations to the aorta ligated and/or the control group after evaluation in the local models.
Paper III
Microvesicle characteristics Transmission electron microscopy of the isolated microvesicles revealed small, rounded vesicles surrounded by a bilayered membrane with a diameter between 40-300 nm. Flow cytometry showed that approximately 80% of the microvesicle population was positive for flotillin-1 and 30% for caveolin-3, indicative of a certain degree of heterogeneity within the population. Annexin-2 and clathrin were not detected.
Microvesicle content In the DNA analysis, 343 different chromosomal DNA sequences were found. To further confirm presence of DNA inside the microvesicles flow cytometry was used. AO (membrane permeable)-stained microvesicles showed an enhanced fluorescence while PI (membrane impermeable)-stained microvesicles had low or no fluorescence, similar to the unstained microvesicles. This suggests that DNA is present only inside the thoroughly washed microvesicles. The AO-stained microvesicles also showed fluorescence for RNA, reflected by wavelength leakage into the 670/LP channel.
The microvesicles contained 1595 detected mRNA of which 1520 also were detected in the cardiomyocytes. Thirty five genes coding for proteins in the small and large ribosomal subunit and 33 genes coding for proteins in mitochondria could be detected.
Experimental studies on Cardiac Hypertrophy
48
Microvesicle DNA transfer into target fibroblasts Microvesicular DNA and RNA stained with AO were incubated with firbroblasts. Examination by confocal microscopy of the incubated fibroblasts revealed AO-stained, intracellular DNA and RNA spots localized to the cytoplasm and even inside the nuclear membrane.
Microvesicle effects on target cells When fibroblasts were transfected with microvesicles an effect on gene expression was found. Culture medium from cardiomyocytes induced 333 gene expression changes (175 up regulations and 158 down regulations) in the fibroblasts when compared to control medium. The culture medium gave rise to two compartments after ultracentrifugation: the microvesicle deficient supernatant that induced 96 changes (21 up, 75 down) and the microvesicle enriched pellet that induced about 161 changes (65 up and 96 down).
Paper IV
Microvesicle characteristics CD63 was found in all three exosome treatment groups but not in the cell suspension. TSG101 was found in all exosome samples as well as in the cell suspension. GRP78 was only found in the cell suspension and not in exosome samples.
The DLS analysis showed an average size between 50 and 80 nm in diameter, with no differences between the treatment groups.
Microvesicle content In the control group (n=4) 623 transcripts were found, 691 transcripts were found in the TFG-β2 treated group (n=4) and 362 in the PDGF BB treated group (n=3, where an outlier was found in the Illumina dendrogram analysis). Of these transcripts 235 were common for all three groups, 138 were specifically found in the control exosomes, 200 specific for the TGF-β2 exosomes and 73 were specific for the PDGF BB exosomes. The control group and TGF-β2 group shared 226 transcripts, the TGF-β2 group and PDGF BB group shared 30 transcripts and the PDGF BB group and control group shared 24 transcripts.
In the common pool of transcripts, found in all three treatment groups, about 14% were unknown loci and about 14% were ribosomal mRNAs and about 5% were connected to the energy supply system and the mitochondria.
Discussion
49
Discussion
Paper I The characterization (direct interaction network contained 20,5% of the differentially expressed transcripts and the biomarker finding (MYH6 and NPPA) validates microarray as an established method with representative results and that the findings were associated with the hypertrophic process in the myocardium of the HOCM patients.
Evaluation of PCA showed that patient history cannot be connected to the differential gene expression, indicating that the differences seen are related to the disease per se. The fact that fractional shortening was normal in all patients suggests that systolic function was preserved and that the differential gene expression seen is due to the hypertrophy itself. Genes associated with the early and instant hypertrophic response (FOS and EGR1 were down-regulated and JUN and JUNB were not differentially regulated at all) indicate that the early/acute stage of hypertrophy is not present in the HOCM patients. This is in accordance with the fact that the disease is at a significant stage that required surgical intervention. Up-regulation of HDAC5 is an anti-hypertrophic mechanism by the negative regulation of pro-hypertrophic genes. The significant down-regulation of MYH6 together with the significant up-regulation of NPPA and the non-significant up-regulation of natriuretic peptide precursor B (NPPB) to the same level with corresponding increases in serum levels of NT pro BNP suggests that the fetal gene program is still partially activated even in the chronic stage HOCM. The regulation of the JAK-STAT pathway (where JAK2 was up-regulated) suggests that upholding of the hypertrophy, seen in our patients, might well be preserved mainly via the JAK-STAT pathway.
The observed regulations, with up-regulation of ACE2 and no differential regulation of ACE, reflects an anti-hypertrophic response in the chronic stage HOCM.
Experimental studies on Cardiac Hypertrophy
50
Paper II The sample population was assessed with PCA and verified a clear separation of control and ligated animals as well as time points, which demonstrates the robustness of aorta ligation as a model for cardiac hypertrophy. The robustness of the classification models was assessed in the OPLS-DA analysis. Both the global and the local OPLS-DA models showed a clear separation of all time points. Both in the global and in the local models a majority of animals were correctly predicted. However, a few incorrect predictions were found at day 1 and might indicate that the ligated animals developed hypertrophy at different paces, possibly due to small differences in the ligation of the abdominal aorta and that this individuality is most pronounced in the acute phase. Nevertheless, these results demonstrate a good classification and that the OPLS-DA models are well suited for prediction of samples and evaluation of patterns. When using the OPLS-DA models for evaluation of clusters of gene transcripts within the 5 chosen gene groups it was evident that most of the associations with both control and/or aorta ligated animals were seen in the acute phase (day 1) of the hypertrophic development. However, related patterns were still seen, more loosely, at the adaptive phase (day 6) only to almost disappear at the stable phase (day 42). This outcome is clearly a response to the overwhelming initial events after the operation: development of hypertrophy and adaptation to increased workload. At day 42 the progression of hypertrophy was reduced and signalling pathways and other responses had reached a stable phase. Evaluation of the gene groups revealed clustering of “ECM and adhesion molecules” to the aorta ligated animals at day 1 and 6 which confirms previous results from Hellman et al. and highlights that processes outside the cell play an important role in the hypertrophic progression. These findings also confirmed that using OPLS-DA for evaluation of microarray gene expression data was reliable in finding patterns that afterwards can be further assessed with traditional statistics. OPLS-DA serves as an excellent screening method to uncover expression patterns and clusters. The evaluation of the gene groups “Fatty acid metabolism” and “Glucose metabolism” showed association to the control animals, at all time points, and not to the aorta ligated animals. The absence of association to the aorta ligated animals seen in “Fatty acid metabolism” is well in line with the

Discussion
51
metabolic switch toward glucose utilization of the fetal gene program. To be in line with the fetal gene program the “Glucose metabolism” should have been associated to the aorta ligated group. This confusing result might be a result of the fact that metabolic activity not always is directly related to regulations at a gene expression level. Another finding related to the energy supply system was the association of “Mitochondria” gene transcripts to the control animals. To summarize, at a gene expression level, the metabolism in the aorta ligated animals seems to be complex and not entirely in line with the fetal gene program. Evaluation of “Atherosclerosis” showed association to the aorta ligated animals both at day 1 and 6. Among the gene transcripts in “Athero-sclerosis” that was associated to the aorta ligated animals, an over representation of genes connected to vascularisation was found. This is in line with the known fact that in thyroxine induced left ventricular hypertrophy vascularisation is increased78. Since inflammation is mainly involved in atherosclerosis it is also interesting that neither the gene groups “Inflammation” nor “Cytokines and Chemokines” showed any associations. Apparent is, however, that cardiac disease can be traced with gene group evaluation with OPLS-DA. Absence of clusters for several pathways (e.g. JAK-STAT pathway and peroxisome proliferator-activated receptors (PPAR) targets), suggested to be important in the hypertrophic process, revealed that subtle changes and activations within a pathway cannot be seen in vast gene expression analysis. To study such subtle changes, a specific hypothesis must be focussed on the pathway of interest and should be tested with both gene expression and functional techniques.
Paper III After evaluation of the microvesicle characteristics it was confirmed that the microvesicles studied in this project are representative members of the exosome family. It should however be pointed out that the microvesicle population observed was not homogenous. 80% of the microvesicles were positive for flotillin-1, while only 30% were positive for caveolin-3. Some microvesicles displayed an electron dense appearance, while others were electron lucent. The large size distribution is notable, indicating presence of both exosomes and microvesicles with a majority of microvesicles, if categorising extracellular vesicles according to size. These signs of heterogeneity in characteristics could imply differences in cargo as well as target cells.
Experimental studies on Cardiac Hypertrophy
52
The finding of caveolin-3, which is the myocyte specific isoform of caveolins, in 30% of the microvesicles reflects the relationship to cardiomyocytes. Caveolin-3 forms caveolae in muscle tissue that has a key role in the maintenance of plasma membrane integrity and in the processes of vesicular trafficking and signal transduction. It was confirmed that microvesicles generated by cardiomyocytes contain genetic information, both DNA and RNA, which can be transferred to other cells. In the mRNA content both small and large ribosomal subunits mRNA were found as well as mRNA coding for proteins involved in mitochondrial energy generation. This implies that the genetic information found in the microvesicles might participate in protein synthesis in target cells, including involvement in energy generation at distant sites. The confocal microscopy findings indicate that internalisation of micro-vesicle content, even into the nucleus, was accomplished. The transfer of genetic information to target cells was in fact verified by clear cut down and up-regulation of gene products. This supports the idea that the content of microvesicles was indeed internalized in fibroblasts rather than just adhered to them.
Paper IV In the common poll of transcripts, found in all three exosome groups: 14% of the transcripts were ribosomal, 14% were of unknown locus and 5% were connected to the mitochondria and its function. A similar result was also seen in our characterisation study (Paper III). This content indicates that the exosomes are loaded with a basic package of transcripts which include structural ribosomal proteins and transcripts coding for proteins involved in generation of energy in the target cell. Two of the characteristics of cardiomyocytes is that they contain a large number of mitochondria, and that the turnover of proteins is high, which could explain the contents of the basic package. The control exosome group represent “the normal” cardiomyocyte state. In the group of specific transcripts only found in this group (138 transcripts) a variety of mRNAs were found with different functions and protein products, including transcripts coding for proteins involved in intracellular transport, MAPK-signalling pathways and nucleus. In the specific group of transcripts for the PDGF BB group (73 transcripts) hyaluronidase-3 (HYAL3) was found. HYAL3 is known to digest hyaluronan
Discussion
53
(HA). HA is a glycosaminoglycan found in the extracellular matrix and shown to be involved in cardiac development79. When PDGF BB is added to a cell culture, the amount of HA decreased dramatically with increasing concentration of PDGF BB70,80. This finding, of the exosomal HYAL3 mRNA, might indicate that HYAL3 is produced by a cell culture stimulated with PDGF BB and that HYAL3 is responsible for the decreased amount of HA. NFAT5 was found in the specific group of transcripts for the TGF-β2 group, which indicate that TGF-β2 affect the exosome content, adding both proliferation and hypertrophic signals. In the group of transcripts that were common for both growth factors (TGF-β2 and PDGF BB), HDAC5 was found. Since cardiomyocytes are proliferating at a high rate in culture, this finding might indicate that proliferation and cardiac development are favoured before hypertrophic progression in cell culture
Experimental studies on Cardiac Hypertrophy
54
Conclusions
Overall conclusions The overall aim of this thesis was to study transcription patterns and extracellular signalling of the hypertrophic heart to better understand the mechanisms initiating, controlling and maintaining cardiac hypertrophy. The transcription patterns in the hypertrophic heart changes over time, toward a state were both pro- and anti-hypertrophic genes are activated. Cardiomyocytes were shown to secret microvesicles and exosomes with changing content depending on the state of the cardiomyocte. These findings might be used to find new biomarkers and/or biomarker-patterns for each stage in the hypertrophic progression and thereby personalise the medication.
Specific conclusions Paper I Evidence for both pro- and anti-hypertrophic transcriptional regulations was seen, suggesting that pharmacological treatment according to the stage of hypertrophy could be valid. Dividing the hypertrophic progression in different stages may serve as a selection tool for treatment and intervention. Today myocardial biopsy is not a routine procedure, however, gene expression data on such material could be of value when determining the stage of the disease. The observed anti-hypertrophic ACE/ACE2 balance does not support the use of ACE-inhibitors for left ventricular (LV) remodelling treatment in HCM. This is in line with current therapy guidelines for HCM, where ACE-inhibitors are only recommended in a minority of the patients for treatment of end-stage heart failure. The synchronized up-regulation of the ACE2 gene together with the ANP and BNP genes (NPPA and NPPB) is an interesting clinical aspect. The diuretic and anti-hypertrophic effects of ANP and BNP and the repressive effect on RAAS by ACE2 can be interpreted as an “auto medication” of the hypertrophic heart in the chronic disease state. This might contribute to an endogenous protection system, neither growing nor suppressing the already hypertrophic myocardium.
Conclusions
55
Paper II PCA and OPLS-DA were found to be very useful in verifying robustness of physiological experimental models, which is a good complement to physiological assessment of the experimental model. The results clearly showed separation of samples and accurately predicted new samples into existing groups.
OPLS-DA was also very useful tool when analyzing gene expression data, especially in finding clusters of gene groups not seen with traditional statistics. It was shown to be useful in visualizing changes within gene groups over different time points and thereby presents an easy way of evaluating gene expression results and creating new hypotheses. The clear association to “Extracellular matrix” highlights that the processes of the extracellular matrix play an important role in the hypertrophic development. Paper III The somewhat controversial presence of DNA in the microvesicles derived from cultured cardiomyocyte was confirmed.
The microvesicles were found to be involved in a metabolic course of events in the microenvironment of the heart by facilitating an array of cellular processes through transfer of nucleic acids to target cells. Paper IV Exosomes contain a basic package of transcripts common for exosomes derived from unstimulated and growth factor treated cardiomyocytes. Cardiomyocyte derived exosomes might be used for cell-to-cell communication since signals of both hypetrophic and proliferating nature were found in the exosomes derived from growth factor treated cardiomyocytes and not in the normal cardiomyocyte exosomes. Exosomes derived from cardiomyocytes are loaded with a partly different content which might be used as a biomarker, if further investigated.

Experimental studies on Cardiac Hypertrophy
56
Acknowledgments
I would like to thank everyone that has helped me during my PhD-studies, without all of you, this thesis would never have been written. First, my supervisor Stellan Mörner for supporting me through these years with patience and expertise, whilst allowing me to develop into an independent scientist. Thank you for all the interesting discussions regarding cardiology and everyday chitchat. There have been some hiccups along the way, but finally we made it! My co-supervisor, Anders Waldenström, for teaching me about all the aspects of being a researcher: generation of new hypotheses, article-, grant application-writing and how to evaluate my own conclusions. Thank you for challenging me! And my other co-supervisor, Urban Hellman, for (in absence of other words) everything. You have helped me with your laboratory expertise, in writing and correcting my manuscripts and by being my friend. You have really been someone to lean on in difficult times. I also would like to thank my co-authors for giving me great advice and for correcting my articles over and over again (thank you for the endurance). Jane-Lise Samuel for expert knowledge on cardiac hypertrophy, great feedback and the quickest answers ever. Gerhard Wikström for making the HCM-project possible. Göran Larsson for consultations and great discussions on how to develop and extend my projects. Linus Malm for your excellent knowledge in the field of multivariate data analysis. Thank you for answering all my “stupid” questions. In 2001, as I was a newcomer in Umeå, you were my “fadder”. I must have done something right since you now, 11 years later, once again accepted the challenge of guiding me through unknown territories! Gunnar Ronquist for introducing me to the world of exosomes and microvesicles.

Acknowledgments
57
Then I would like to thank everyone else who has helped me (and my projects), whenever I needed it. Kerstin Rosenqvist, Eva Karlsson and Catrin Johansson, who makes the world go round. Without you I wouldn’t survive in this bureaucracy of Umeå University. Åsa Lundsten, Terry Persson and P-A Lundström for always helping me with issues regarding buy-ins and other matters concerning my work environment. Anna Engström-Laurent for being a true inspiration and a supporter. Malin Olsson for great times in the lab and for being the nice person that you are. Thank you for all the laughs and for being a friend! My past roommates. Nina Norgren for introducing me to “bugg” and for all the walks to “kiosken”. Honestly, we never were a great roommate match: we talked too much, had too much fun and forgot to work. Linda Köhn, my first roommate, who made me realize that bioinformatics really is fun and for welcoming me to medical genetic with an open heart. Marie Lundström, Mona Schröder och Åsa Larefalk for all the help in the entangled world of exosomes and microvesicles. Without your help I would never have mastered the ultracentrifuge or the FACS-machine. Thank you, Marie for a great time in Gothenburg, Mona for always having a smile on your faces when I appeared with even more questions and Åsa for sharing all the cute pictures of Ebba and for nice company in the cell culture room. Berith Lundström and Kristina Eriksson for great laboratory assistance. Berith, not only an expert on immunohistochemistry, but also a great detective in finding the truth about in situ hybridization. Thank you for great tips on all things cultural. Kristina, thank you for all the hours we spent in the cell culture room and for nice talk of all and nothing. I can’t believe that we finally became friends with the ultracentrifuge. Maria Lindberg och Maria Hörnberg for all the talks. Maria L, for sharing Håkans electrical knowledge when I needed it, for being a bugg-beginner together with me and for being the nice party girl that you truly are. Maria H, sometimes it feel like we share one mind, it seems like you always have

Experimental studies on Cardiac Hypertrophy
58
the same ideas and opinions that I do. I guess it is true that great minds think alike! Angelica Nordin for teaching men all about cell culturing and for always lightening up my life, especially my lunch time. You are an inspiration, working hard to reach your goals. Heidi Kokkonen for being wonder-Heidi. Your are the complete package: nice, intelligent, kind, good looking, mother of two, physician to be and cool. Someone to look up to. I am happy that someone else shares my obsession with “ordning och reda”. Thanks to everyone at the “fika” table, past and present members: Dan, Sofia, Nina FP, Sofie J, Monica, Lisbeth L, Martin, Lisbeth Ä, Susann, Stefan and Mikael L.
To all my friends and family outside of work that have supported me with love and cheerleading. The Everländer family. Emma Andersson Evelönn, for being you, for always being on my team, for teaching me that small children aren’t scary and for being a mastermind at “På spåret” (I will never forget about “retarderande toppar”). Johan Evelönn, for wanting to walk, for “kalsong-chocken”, for watching the royal wedding with me and for being there when I needed it the most. Elin Larsson for being a great friend, always caring about others. If I hadn’t bumped into you at “Mias” this thesis, truly, would never have been written. And, yes, Larry legs are “spinkiga”! Lina Petersson, my “bästis”! Thank you for all the happy times in Mjölby, it is really a relief to forget about work and spending time with you and your family, even though we don’t “går med gåvor” anymore. Thank you, Lina and Fredrik Johansson, for including me in your family as Olles godmother! My aunt, Birgit “Faster” Älvedal, you are an important part of my small family. Thank you for all the telephone talks about all and nothing. When I needed a break from thesis-writing, phoning you and chatting for half an hour was all I needed to get back into writing mood.

Acknowledgments
59
My mother, Gunnel Öman Gennebäck, who is my best friend! Words cannot express how much you mean to me. Without your love and support this book wouldn’t exist. You inspire me by being a strong, independent and intelligent woman who is not afraid to speak your mind. Thank you for teaching me that it is only to “bryta ihop och komma igen”!
Dedication This thesis is dedicated to my late stepfather, Conny Öman, whose goodness and intelligence will always motivate me to take good care of my ambitions and live my life to the fullest.
Experimental studies on Cardiac Hypertrophy
60
References 1. WHO. Causes of death 2008. (2011). 2. Socialstyrelsen. Dödsorsaker 2011 – Causes of Death 2011. 243 (2012). 3. Camelliti, P., Borg, T.K. & Kohl, P. Structural and functional
characterisation of cardiac fibroblasts. Cardiovasc Res 65, 40-51 (2005). 4. Vliegen, H.W., van der Laarse, A., Cornelisse, C.J. & Eulderink, F.
Myocardial changes in pressure overload-induced left ventricular hypertrophy. A study on tissue composition, polyploidization and multinucleation. Eur Heart J 12, 488-494 (1991).
5. Grabowski Gerard J & Sandra, R.T. Principles of Anatomy and Physiology, (John Wiley & Sons, 2002).
6. Bergmann, O., et al. Evidence for cardiomyocyte renewal in humans. Science 324, 98-102 (2009).
7. Newman Dorland, W.A. Dorland's Illustrated Medical Dictionary (Saunders).
8. Dorn, G.W., 2nd. The fuzzy logic of physiological cardiac hypertrophy. Hypertension 49, 962-970 (2007).
9. Pelliccia, A., Maron, B.J., Spataro, A., Proschan, M.A. & Spirito, P. The upper limit of physiologic cardiac hypertrophy in highly trained elite athletes. N Engl J Med 324, 295-301 (1991).
10. Zipes, D. & Braunwald, E. Heart disease: a textbook of cardiovascular medicine, (W.B. Saunders Co, Chicago, 2005).
11. Barry, S.P., Davidson, S.M. & Townsend, P.A. Molecular regulation of cardiac hypertrophy. Int J Biochem Cell Biol 40, 2023-2039 (2008).
12. Caspari, P.G., Newcomb, M., Gibson, K. & Harris, P. Collagen in the normal and hypertrophied human ventricle. Cardiovasc Res 11, 554-558 (1977).
13. Ho, K.K., Pinsky, J.L., Kannel, W.B. & Levy, D. The epidemiology of heart failure: the Framingham Study. J Am Coll Cardiol 22, 6A-13A (1993).
14. Heineke, J. & Molkentin, J.D. Regulation of cardiac hypertrophy by intracellular signalling pathways. Nat Rev Mol Cell Biol 7, 589-600 (2006).
15. Mascareno, E. & Siddiqui, M.A. The role of Jak/STAT signaling in heart tissue renin-angiotensin system. Mol Cell Biochem 212, 171-175 (2000).
16. Sadoshima, J. & Izumo, S. Molecular characterization of angiotensin II--induced hypertrophy of cardiac myocytes and hyperplasia of cardiac fibroblasts. Critical role of the AT1 receptor subtype. Circ Res 73, 413-423 (1993).
17. Akazawa, H. & Komuro, I. Roles of cardiac transcription factors in cardiac hypertrophy. Circ Res 92, 1079-1088 (2003).
18. Mak, M.C., et al. Embryonic Lethality in Mice Lacking the Nuclear Factor of Activated T Cells 5 Protein Due to Impaired Cardiac Development and Function. Plos One 6(2011).
19. Backs, J. & Olson, E.N. Control of cardiac growth by histone acetylation/deacetylation. Circ Res 98, 15-24 (2006).
References
61
20. Karamboulas, C., et al. HDAC activity regulates entry of mesoderm cells into the cardiac muscle lineage. J Cell Sci 119, 4305-4314 (2006).
21. Dobaczewski, M., Chen, W. & Frangogiannis, N.G. Transforming growth factor (TGF)-beta signaling in cardiac remodeling. J Mol Cell Cardiol 51, 600-606 (2011).
22. Friberg, P., et al. Cardiac hypertrophy and related growth processes: the role of insulin-like growth factor-I. Blood Press Suppl 2, 22-29 (1995).
23. Kardami, E., et al. Fibroblast growth factor 2 isoforms and cardiac hypertrophy. Cardiovasc Res 63, 458-466 (2004).
24. Azhar, M., et al. Transforming Growth Factor Beta2 Is Required for Valve Remodeling During Heart Development. Dev Dynam 240, 2127-2141 (2011).
25. Kumar, D. & Sun, B. Transforming growth factor-beta2 enhances differentiation of cardiac myocytes from embryonic stem cells. Biochem Biophys Res Commun 332, 135-141 (2005).
26. Azhar, M., et al. Transforming growth factor beta in cardiovascular development and function. Cytokine Growth Factor Rev 14, 391-407 (2003).
27. Parker, T.G., Packer, S.E. & Schneider, M.D. Peptide growth factors can provoke “fetal” contractile protein gene expression in rat cardiac myocytes. J Clin Invest, 507-514 (1990).
28. Chintalgattu, V., et al. Cardiomyocyte PDGFR-β signaling is an essential component of the mouse cardiac response to load-induced stress. J Clin Invest. , 472-484 (2010).
29. Romano, F., et al. Platelet-derived growth factor-BB-induced hypertrophy of peritubular smooth muscle cells is mediated by activation of p38 MAP-kinase and of rho-kinase. J Cell Physiol 207, 123-131 (2006).
30. Keidar, S., Kaplan, M. & Gamliel-Lazarovich, A. ACE2 of the heart: From angiotensin I to angiotensin (1-7). Cardiovasc Res 73, 463-469 (2007).
31. Yamazaki, T., et al. Endothelin-1 is involved in mechanical stress-induced cardiomyocyte hypertrophy. J Biol Chem 271, 3221-3228 (1996).
32. Lopaschuk, G.D., Collinsnakai, R.L. & Itoi, T. Developmental-Changes in Energy Substrate Use by the Heart. Cardiovascular Research 26, 1172-1180 (1992).
33. Maron, B.J. & Maron, M.S. Hypertrophic cardiomyopathy. The Lancet (2012).
34. Marian, A.J. Hypertrophic cardiomyopathy: from genetics to treatment. Eur J Clin Invest 40, 360-369 (2010).
35. Spang, A. The life cycle of a transport vesicle. Cell Mol Life Sci 65, 2781-2789 (2008).
36. Schifferli, J.A. Microvesicles are messengers. Semin Immunopathol 33, 393-394 (2011).
37. Gyorgy, B., et al. Membrane vesicles, current state-of-the-art: emerging role of extracellular vesicles. Cell Mol Life Sci 68, 2667-2688 (2011).
Experimental studies on Cardiac Hypertrophy
62
38. Ronquist, G. & Brody, I. The prostasome: its secretion and function in man. Biochim Biophys Acta 822, 203-218 (1985).
39. Henson, P.M., Bratton, D.L. & Fadok, V.A. Apoptotic cell removal. Curr Biol 11, R795-805 (2001).
40. Xu, C., Bailly-Maitre, B. & Reed, J.C. Endoplasmic reticulum stress: cell life and death decisions. J Clin Invest 115, 2656-2664 (2005).
41. Cocucci, E., Racchetti, G. & Meldolesi, J. Shedding microvesicles: artefacts no more. Trends Cell Biol 19, 43-51 (2009).
42. Simons, M. & Raposo, G. Exosomes--vesicular carriers for intercellular communication. Curr Opin Cell Biol 21, 575-581 (2009).
43. Keller, S., Sanderson, M.P., Stoeck, A. & Altevogt, P. Exosomes: from biogenesis and secretion to biological function. Immunol Lett 107, 102-108 (2006).
44. Mathivanan, S. & Simpson, R.J. ExoCarta: A compendium of exosomal proteins and RNA. Proteomics 9, 4997-5000 (2009).
45. Pan, B.T., Teng, K., Wu, C., Adam, M. & Johnstone, R.M. Electron microscopic evidence for externalization of the transferrin receptor in vesicular form in sheep reticulocytes. J Cell Biol 101, 942-948 (1985).
46. Mincheva-Nilsson, L. & Baranov, V. The role of placental exosomes in reproduction. Am J Reprod Immunol 63, 520-533 (2010).
47. Ronquist, K.G., Ronquist, G., Carlsson, L. & Larsson, A. Human prostasomes contain chromosomal DNA. Prostate 69, 737-743 (2009).
48. Valadi, H., et al. Exosome-mediated transfer of mRNAs and microRNAs is a novel mechanism of genetic exchange between cells. Nature Cell Biology 9, 654-U672 (2007).
49. Pap, E. The role of microvesicles in malignancies. Adv Exp Med Biol 714, 183-199 (2011).
50. Zhou, H., et al. Exosomal Fetuin-A identified by proteomics: a novel urinary biomarker for detecting acute kidney injury. Kidney Int 70, 1847-1857 (2006).
51. Witek, R.P., et al. Liver cell-derived microparticles activate hedgehog signaling and alter gene expression in hepatic endothelial cells. Gastroenterology 136, 320-330 e322 (2009).
52. Kim, S.H., Bianco, N.R., Shufesky, W.J., Morelli, A.E. & Robbins, P.D. MHC class II+ exosomes in plasma suppress inflammation in an antigen-specific and Fas ligand/Fas-dependent manner. J Immunol 179, 2235-2241 (2007).
53. Rajendran, L., et al. Alzheimer's disease beta-amyloid peptides are released in association with exosomes. Proc Natl Acad Sci U S A 103, 11172-11177 (2006).
54. Bang, C., Dangwal, S., Zeug, A. & Thum, T. Paracrine miRNA-crosstalk via exosomes between cardiac fibroblasts and cardiomyocytes. in 1st International Society for Extracellular Vesicles (ISEV) Conference (Gothenburg, Sweden, 2012).
References
63
55. Gupta, S. & Knowlton, A.A. HSP60 trafficking in adult cardiac myocytes: role of the exosomal pathway. Am J Physiol Heart Circ Physiol 292, H3052-3056 (2007).
56. Kalra, S., Kapustin, A. & Shanahan, C. Vascular smooth muscle cell-derived exosomes isolated from human blood are enriched with fetuin-A, and may be involved in the mechanisms of vascular calcification. in 1st International Society for Extracellular Vesicles (ISEV) Conference (Gothenburg, Sweden, 2012).
57. Lai, R.C., et al. Exosome secreted by MSC reduces myocardial ischemia/reperfusion injury. Stem Cell Res 4, 214-222 (2010).
58. Benjamini, Y. & Hochberg, Y. Controlling the False Discovery Rate: A Practical and Powerful Approach to Multiple Testing. Journal of the Royal Statistical Society 57, 289-300 (1995).
59. Cerutti, C., et al. Transcriptional alterations in the left ventricle of three hypertensive rat models. Physiol Genomics 27, 295-308 (2006).
60. Mirotsou, M., Watanabe, C.M., Schultz, P.G., Pratt, R.E. & Dzau, V.J. Elucidating the molecular mechanism of cardiac remodeling using a comparative genomic approach. Physiol Genomics 15, 115-126 (2003).
61. Rajan, S., et al. Microarray analysis of gene expression during early stages of mild and severe cardiac hypertrophy. Physiol Genomics 27, 309-317 (2006).
62. Sheehy, S.P., Huang, S. & Parker, K.K. Time-warped comparison of gene expression in adaptive and maladaptive cardiac hypertrophy. Circ Cardiovasc Genet 2, 116-124 (2009).
63. Strom, C.C., et al. Identification of a core set of genes that signifies pathways underlying cardiac hypertrophy. Comp Funct Genomics 5, 459-470 (2004).
64. Wagner, R.A., Tabibiazar, R., Powers, J., Bernstein, D. & Quertermous, T. Genome-wide expression profiling of a cardiac pressure overload model identifies major metabolic and signaling pathway responses. J Mol Cell Cardiol 37, 1159-1170 (2004).
65. van den Bosch, B.J., et al. Early and transient gene expression changes in pressure overload-induced cardiac hypertrophy in mice. Genomics 88, 480-488 (2006).
66. Zhao, M., Chow, A., Powers, J., Fajardo, G. & Bernstein, D. Microarray analysis of gene expression after transverse aortic constriction in mice. Physiol Genomics 19, 93-105 (2004).
67. Weinberg, E.O., et al. Sex dependence and temporal dependence of the left ventricular genomic response to pressure overload. Physiol Genomics 12, 113-127 (2003).
68. Lim, D.S., Roberts, R. & Marian, A.J. Expression profiling of cardiac genes in human hypertrophic cardiomyopathy: insight into the pathogenesis of phenotypes. J Am Coll Cardiol 38, 1175-1180 (2001).
Experimental studies on Cardiac Hypertrophy
64
69. Hwang, J.J., et al. Microarray gene expression profiles in dilated and hypertrophic cardiomyopathic end-stage heart failure. Physiol Genomics 10, 31-44 (2002).
70. Hellman, U., Mörner, S., Engström-Laurent, A., Samuel, J.-L. & Waldenström, A. Temporal correlation between transcriptional changes and increased synthesis of hyaluronan in experimental cardiac hypertrophy. Genomics 96, 73-81- (2010).
71. McKenna, W.J., Spirito, P., Desnos, M., Dubourg, O. & Komajda, M. Experience from clinical genetics in hypertrophic cardiomyopathy: proposal for new diagnostic criteria in adult members of affected families. Heart 77, 130-132 (1997).
72. Romhilt, D.W. & Estes, E.H., Jr. A point-score system for the ECG diagnosis of left ventricular hypertrophy. Am Heart J 75, 752-758 (1968).
73. Claycomb, W.C., et al. HL-1 cells: a cardiac muscle cell line that contracts and retains phenotypic characteristics of the adult cardiomyocyte. Proc Natl Acad Sci U S A 95, 2979-2984 (1998).
74. Todaro, G.J. & Green, H. Quantitative studies of the growth of mouse embryo cells in culture and their development into established lines. J Cell Biol 17, 299-313 (1963).
75. Wold, S., Esbensen, K. & Geladi, P. Principal components analysis Chemometr. Intell. Lab. System 2, 37-52 (1987).
76. Bylesjö, M., et al. OPLS discriminant analysis: combining the strengths of PLS-DA and SIMCA classification. Journal of Chemometrics 20, 341-351 (2006).
77. Wold, S., Sjostrom, M. & Eriksson, L. PLS-regression: a basic tool of chemometrics. Chemometr. Intell. Lab. System 58, 109-130 (2001).
78. Chilian, W.M., Wangler, R.D., Peters, K.G., Tomanek, R.J. & Marcus, M.L. Thyroxine-induced left ventricular hypertrophy in the rat. Anatomical and physiological evidence for angiogenesis. Circ Res 57, 591-598 (1985).
79. Camenisch, T.D., et al. Disruption of hyaluronan synthase-2 abrogates normal cardiac morphogenesis and hyaluronan-mediated transformation of epithelium to mesenchyme. J Clin Invest 106, 349-360 (2000).
80. Jacobson, A., Brinck, J., Briskin, M.J., Spicer, A.P. & Heldin, P. Expression of human hyaluronan synthases in response to external stimuli. Biochem J 348 Pt 1, 29-35 (2000).
Figure and table references A. Heineke, J. & Molkentin J. D. Regulation of cardiac hypertophy by
intracellular signalling pathways. Nature Reviews Molecular Cell Biology 7, 589-600 (2006).
B. Siomi, H. & Siomi, M. C. RISC hitches onto endosome trafficking. Nature Cell Biology 11, 1049-1051 (2009).
C. Mincheva-Nilsson L & Baranov V. The Role of Placental Exosomes in Reproduction. Am J Reprod Immunol, 63, 520–533 (2010).