dr. mohammedali abdulhadi & dr. a. m. hassan internal … · 2018-01-19 · dr. mohammedali...
TRANSCRIPT
Dr. Mohammedali Abdulhadi & Dr. A. M. Hassan ـــــــــــــــــــــــــــــــــــــــــــــــــــــــــــــــــــــــــــــــــــــــــــــــــ
2
INTERNAL COMBUSTION ENGINES
Syllabus 1. Engine classification and engine components.
2. Air standard cycles.
3. Cycles having the Carnot cycle efficiency.
4. Comparison of Otto, Diesel and dual cycles.
5. Fuel- Air cycles; variation of specific heats.
6. Fuel- Air cycles; effect of engine variables.
7. Internal combustion engines fuels.
8. Combustion; basic chemistry.
9. Combustion; stoichiometry.
10. Combustion; exhausts gas analysis.
11. Combustion; Dissociation.
12. Combustion; internal energy, enthalpy of combustion and enthalpy of formation, and calorific value of fuels.
13. Real cycles.
14. Spark ignition engine and its components.
15. Compression ignition engine and its components.
16. Four stroke engine.
17. Two stroke engine
18. Scavenging in two - stroke engines.
19. Rotary engines; Gas turbine.
20. Rotary engines; Wankel engine.
21. Engine testing and performance; performance parameters.
22. Performance characteristics.
23. Testing and basic measurement of I.C. engines.
Dr. Mohammedali Abdulhadi & Dr. A. M. Hassan ـــــــــــــــــــــــــــــــــــــــــــــــــــــــــــــــــــــــــــــــــــــــــــــــــ
3
24. Supercharging and its effect on engine performance.
25. Turbo - charging.
26. I.C.E. fuel systems, carburetion, fuel injection.
27. Valves (ports) timing.
28. Firing order.
References:
يونس عبد المالك . د: بي شارما، ترجمة. ماثيور آر. أل. أم: تأليف -محركات االحتراق الداخلي .1 .العراق -ة التكنولوجيةالجامع: الفخري، الناشر
: ھارون كاظم، الناشر. د: ريتشارد ستون، ترجمة: تأليف -مقدمة إلى محركات االحتراق الداخلي .2 .العراق -جامعة البصرة
3. Internal combustion engines and air pollution by: E.F.Obert Publisher: intext educational publishers (1973).
4. Internal combustion engine fundamentals, by: John Heywood, pub.: McGraw- Hill (1988) - USA.
5. Internal combustion engines Applied Thermodynamics, by: Colin R Ferguson and Allan T. Kirkpatrick, pub.: John Wiley & sons – 2001.
6. Introduction to internal combustion engines, by: Richard stone, pub.: MacMillan (1992) - USA.
7. A course in internal combustion engines, by: M. L. Mathur And R.P. Sharma, pub.: Dhanpat Rai& sons- India.
8. Internal combustion engines, by: H. B .Keswani, pub.: Standard Book House-India.
9. Internal combustion engines. Theory and Practice, by: S .P. Sen, pub.: Khanna publishers- India.
10. The internal combustion engines in theory and practice, 2 vols. by: C. F. Taylor, pub.: Wily.
Dr. Mohammedali Abdulhadi & Dr. A. M. Hassan ـــــــــــــــــــــــــــــــــــــــــــــــــــــــــــــــــــــــــــــــــــــــــــــــــ
4
CHAPTER (1)
ENGINE CLASSIFICATION
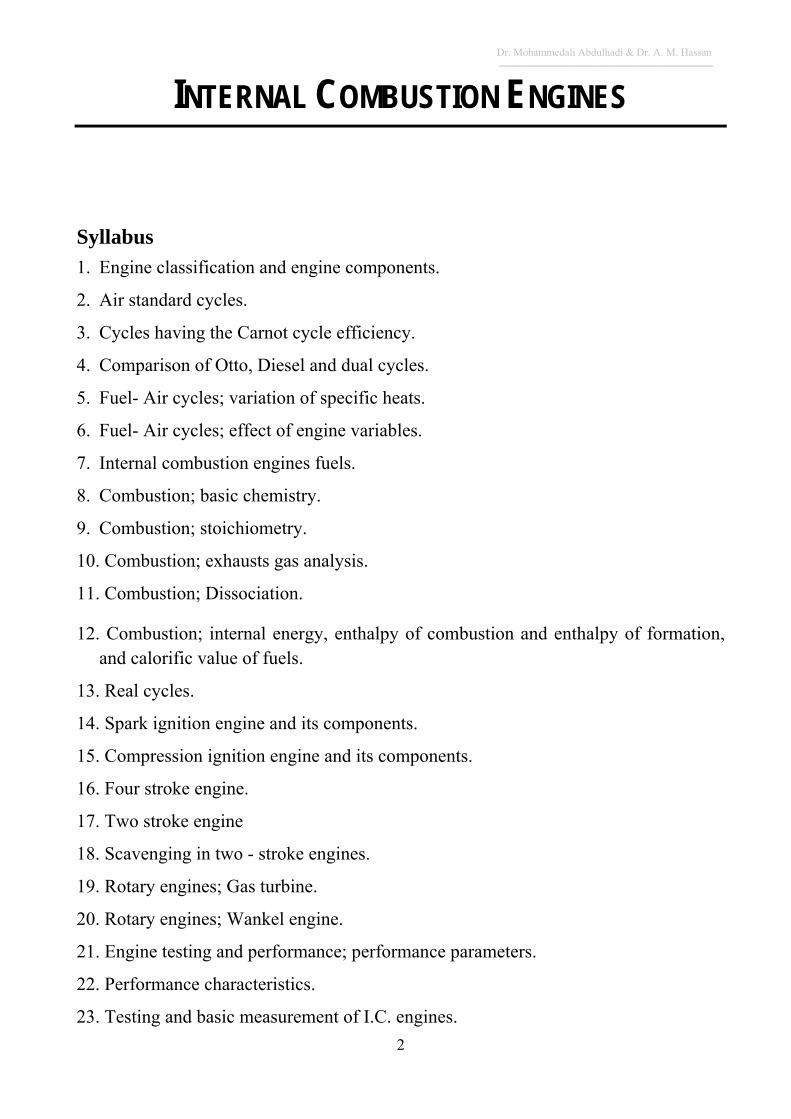
Classification of Heat Engines:
Figure (1-1): Engine Classification
Heat engines can be classified as in figure (1-1); external combustion type in which the working fluid is entirely separated from the fuel- air mixture (ECE), and the internal - combustion (ICE) type, in which the working fluid consists of the products of combustion of the fuel- air mixture itself.
Comparison between the Different Kinds:
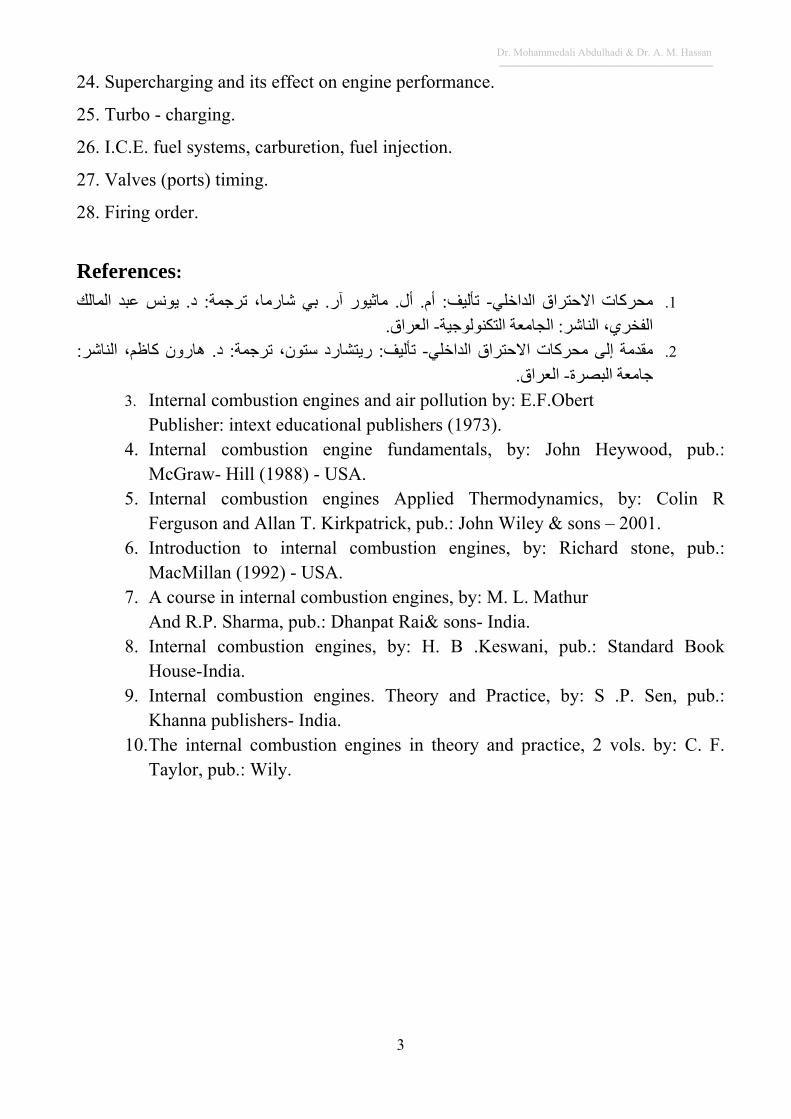
1. The Reciprocation Piston Engine:
Figure (1-2): Diagrammatic
representation of reciprocating
piston engine
Dr. Mohammedali Abdulhadi & Dr. A. M. Hassan ـــــــــــــــــــــــــــــــــــــــــــــــــــــــــــــــــــــــــــــــــــــــــــــــــ
5
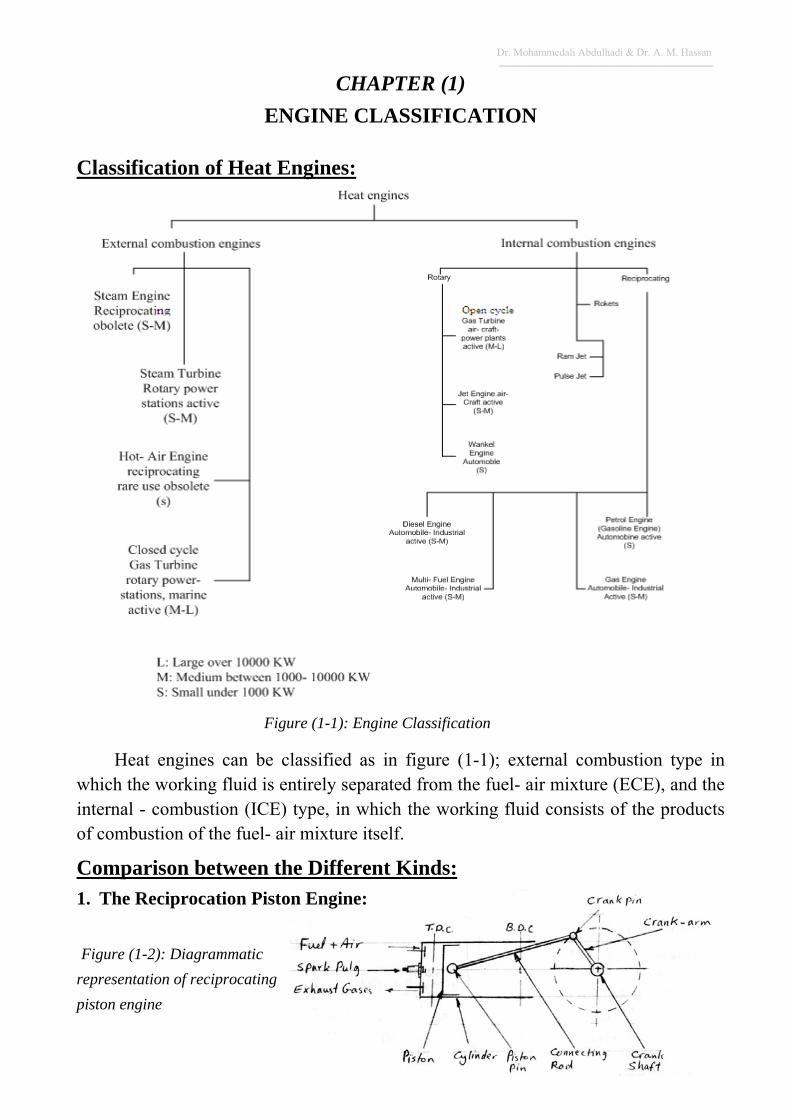
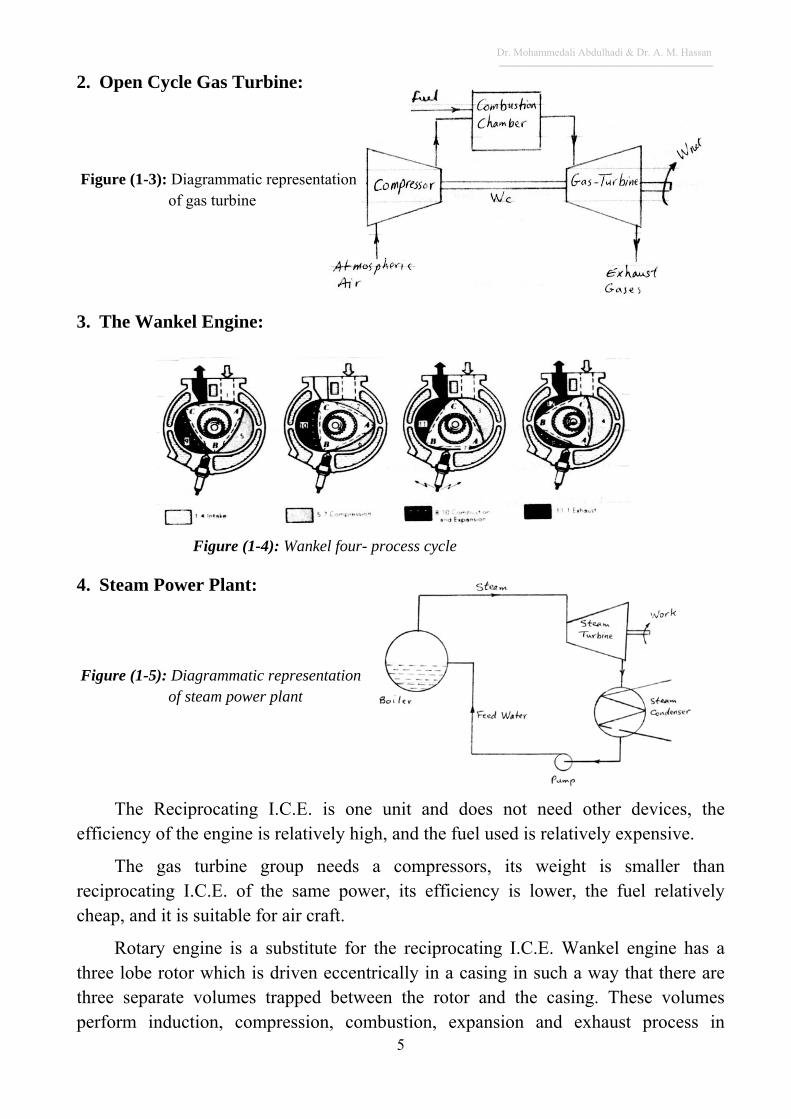
2. Open Cycle Gas Turbine:
Figure (1-3): Diagrammatic representation of gas turbine 3. The Wankel Engine:
Figure (1-4): Wankel four- process cycle
4. Steam Power Plant:
Figure (1-5): Diagrammatic representation of steam power plant
The Reciprocating I.C.E. is one unit and does not need other devices, the efficiency of the engine is relatively high, and the fuel used is relatively expensive.
The gas turbine group needs a compressors, its weight is smaller than reciprocating I.C.E. of the same power, its efficiency is lower, the fuel relatively cheap, and it is suitable for air craft.
Rotary engine is a substitute for the reciprocating I.C.E. Wankel engine has a three lobe rotor which is driven eccentrically in a casing in such a way that there are three separate volumes trapped between the rotor and the casing. These volumes perform induction, compression, combustion, expansion and exhaust process in
Dr. Mohammedali Abdulhadi & Dr. A. M. Hassan ـــــــــــــــــــــــــــــــــــــــــــــــــــــــــــــــــــــــــــــــــــــــــــــــــ
6
sequence. This design has a good power/volume ratio. Seal wear and heat transfer, were some of the initial development problems of the Wankel engine. These problems have now been largely solved.
The steam turbine is suitable for very large powers, its efficiency is reasonable; the fuel used in the boiler is cheap. The steam turbine needs a boiler, condenser and a continuous supply of water.
Modern Developments of I.C.E.:
The modern I.C.E. is a product of research and developments extending over a long period of time many engines were proposed and tested, these include:
1. Stratified charge engine.
2. Dual Fuel and Multi- Fuel engines.
3. Sterling engine.
4. Free Piston engine.
5. Variable compression Ratio engine.
6. Combination of reciprocating engine with gas turbine.
Advantages of I.C.E. over E.C.E.:
1. More mechanical simplicity and lower weight/power ratio.
2. They do not need auxiliary equipment, such as boiler & condenser.
3. They could be started and stopped in a short time.
4. Their thermal efficiency is higher than other heat engines.
5. Their initial cost is low.
These advantages make I.C.E. more suitable in the transport sector; motor cars, small ships, submarines, and small aircrafts.
Types of Internal Combustion Engines:
I.C.E. can be divided into several groups according to different features as characteristics: operating cycles, method of charging the cylinder, fuel used, general design (position and number of cylinders, method of ignition, rotating speed, etc.), and method of cooling the engine.
Fuel Used:
1. Liquid Fuels
a. Volatile liquid fuels: petrol, Alcohol, benzene. Fuel /Air mixture is usually ignited by a spark; Spark ignition.
Dr. Mohammedali Abdulhadi & Dr. A. M. Hassan ـــــــــــــــــــــــــــــــــــــــــــــــــــــــــــــــــــــــــــــــــــــــــــــــــ
7
b. Viscous liquid fuels: fuel oil, heavy and light diesel oil, gas-oil, bio-fuels. Usually combustion of fuel takes place due to its contact with high temperature compressed air (self-ignition); Compression ignition.
2. Gaseous fuels: Liquid Petroleum Gas ( LPG ), Natural gas ( NG ), Town gas, Blast Furnace gas; ignition usually by a spark.
3. Dual and Multi-Fuels: Dual fuel engines are operated with two types of fuels, either separately or mixed
together. Multi-fuel engines could be operated by a mixture of more than two fuels, gaseous; such as: Hydrogen, methane, L.P.G. etc., combined with one or more of liquid fuels, such as alcohol, ethers, esters, gasoline, diesel etc...
Method of Charging the Engine:
1. Naturally aspirated engine: Admission of charge at near atmospheric pressure.
2. Supercharged engine: Admission of charge at a pressure above atmospheric.
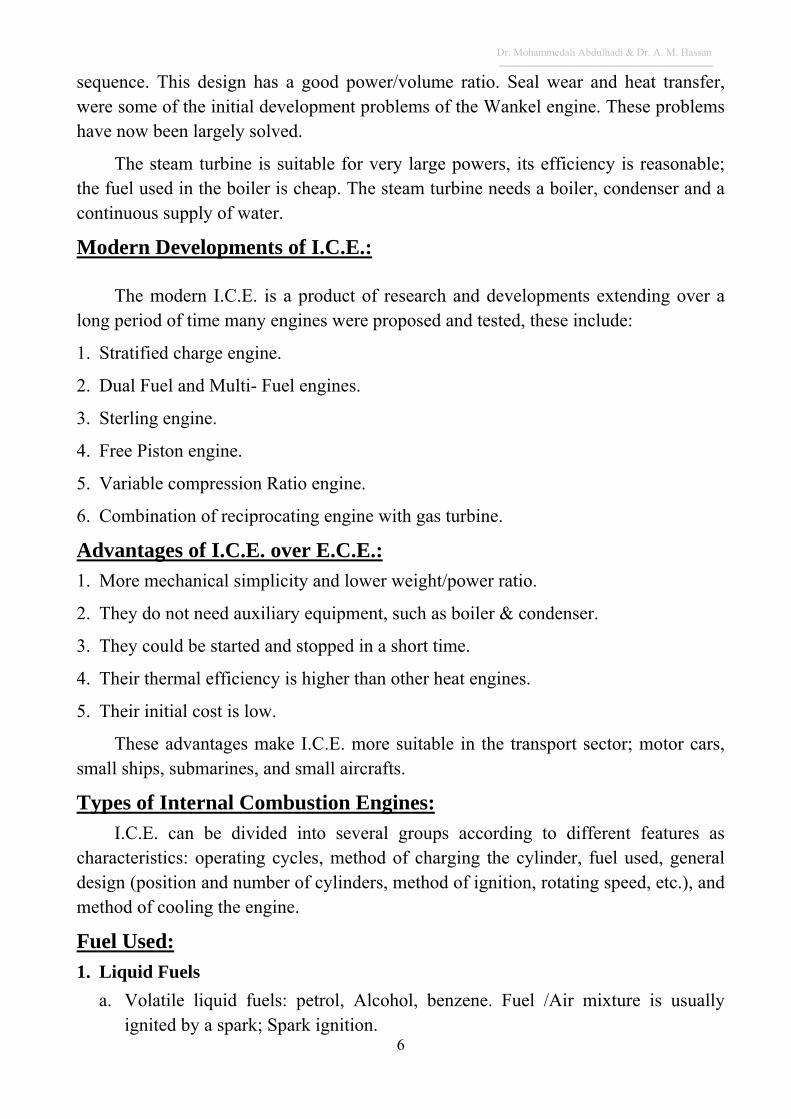
Number of Piston Stroke to Complete the Thermodynamic Cycle:
Figure (1-6): Cylinder events of four- stroke cycle
Dr. Mohammedali Abdulhadi & Dr. A. M. Hassan ـــــــــــــــــــــــــــــــــــــــــــــــــــــــــــــــــــــــــــــــــــــــــــــــــ
8
Four stroke engines: the cycle of operation is completed in four strokes of the
piston or two revolution of the crank shaft. Each stroke consists of 180of crank shaft rotation. The series of operations are shown in figure ( 1 – 6 ):
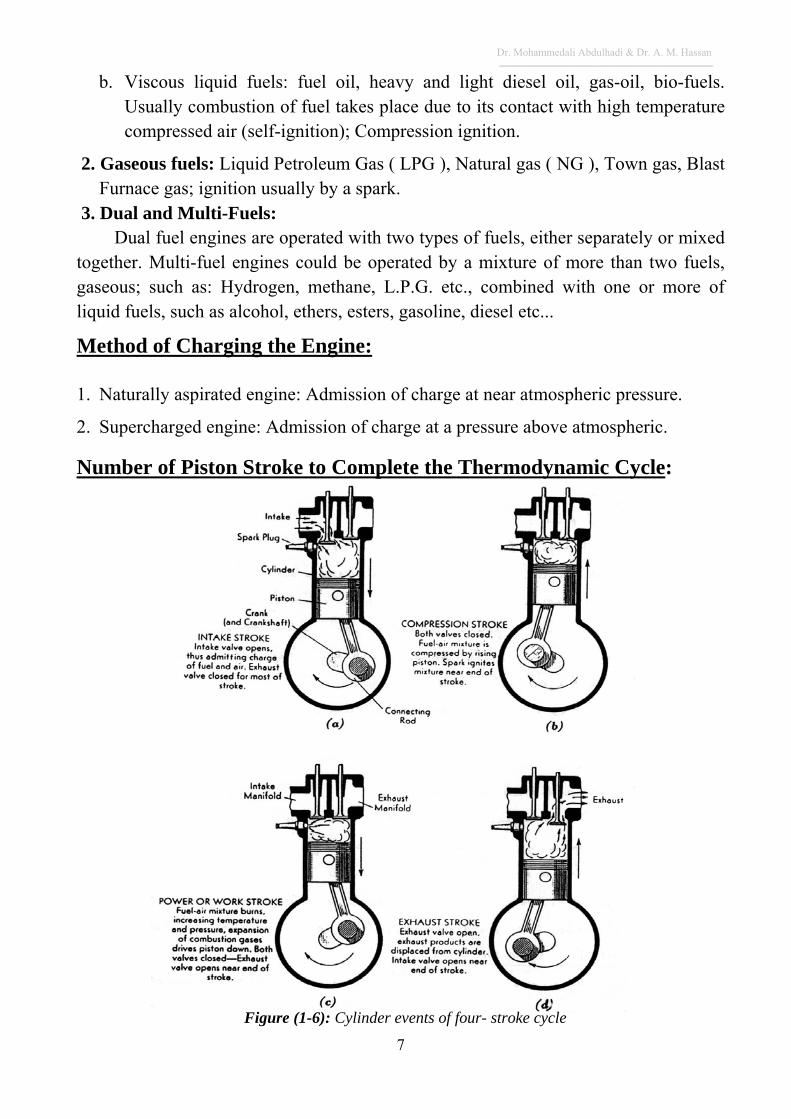
1. Two strokes engine: In two-stroke engine the cycle is completed in two strokes, i.e. one revolution of the crank shaft. The difference between two-stroke and four-stroke engines is in the method of filling the cylinder with the fresh charge and removing the products of combustion. The sequence of events shown in figure (1 – 7):
Figure (1-7): Cylinder events of two- stroke cycle
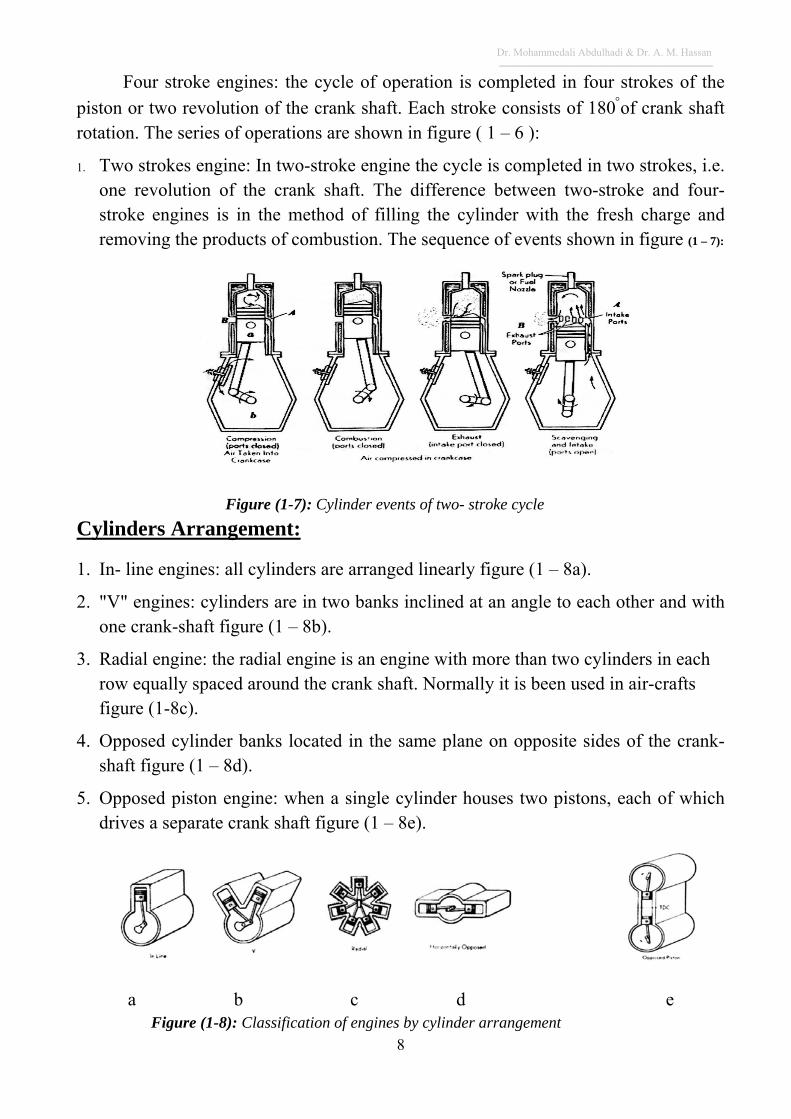
Cylinders Arrangement:
1. In- line engines: all cylinders are arranged linearly figure (1 – 8a).
2. "V" engines: cylinders are in two banks inclined at an angle to each other and with one crank-shaft figure (1 – 8b).
3. Radial engine: the radial engine is an engine with more than two cylinders in each row equally spaced around the crank shaft. Normally it is been used in air-crafts figure (1-8c).
4. Opposed cylinder banks located in the same plane on opposite sides of the crank-shaft figure (1 – 8d).
5. Opposed piston engine: when a single cylinder houses two pistons, each of which drives a separate crank shaft figure (1 – 8e).
a b c d e Figure (1-8): Classification of engines by cylinder arrangement
Dr. Mohammedali Abdulhadi & Dr. A. M. Hassan ـــــــــــــــــــــــــــــــــــــــــــــــــــــــــــــــــــــــــــــــــــــــــــــــــ
9
6. Double- acting engine: the fuel burns on both sides of the piston figure.
7. Cylinders may be vertical or horizontal, vertical engines needs smaller area, when area is available horizontal engines may be used, this would make all engine parts accessible and the operation and maintenance are easier.
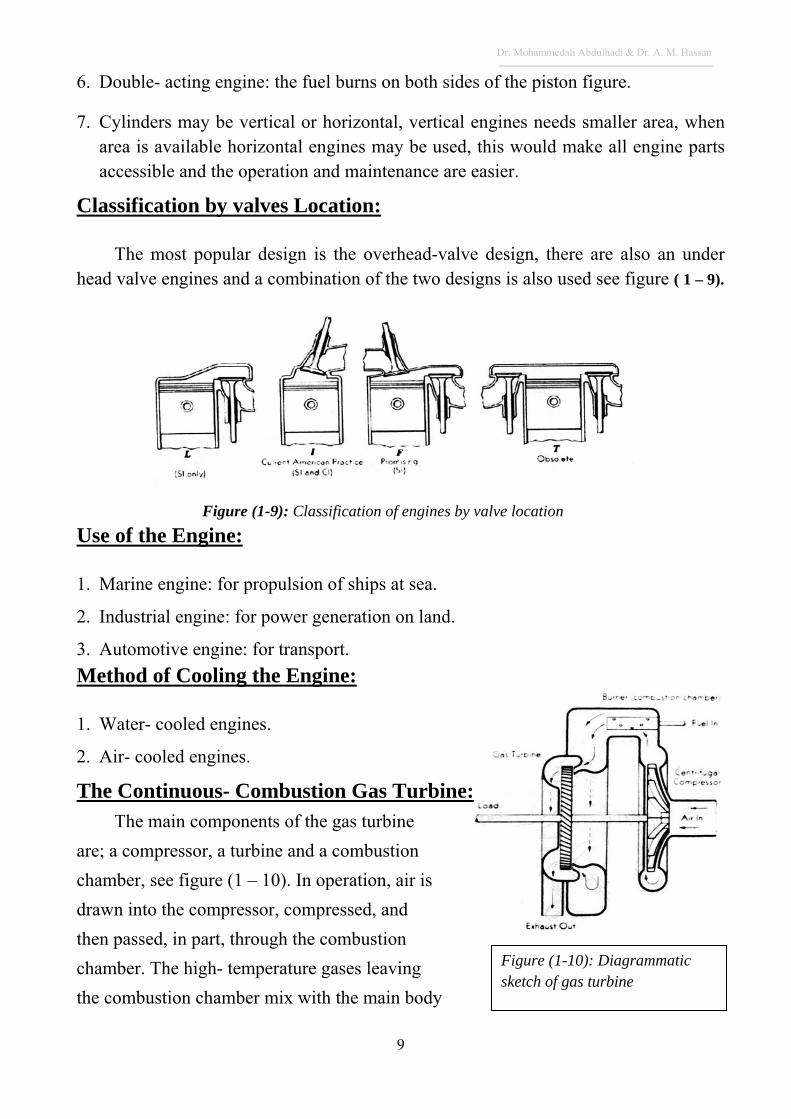
Classification by valves Location:
The most popular design is the overhead-valve design, there are also an under head valve engines and a combination of the two designs is also used see figure ( 1 – 9).
Figure (1-9): Classification of engines by valve location
Use of the Engine:
1. Marine engine: for propulsion of ships at sea.
2. Industrial engine: for power generation on land.
3. Automotive engine: for transport.
Method of Cooling the Engine:
1. Water- cooled engines.
2. Air- cooled engines.
The Continuous- Combustion Gas Turbine: The main components of the gas turbine
are; a compressor, a turbine and a combustion
chamber, see figure (1 – 10). In operation, air is
drawn into the compressor, compressed, and
then passed, in part, through the combustion
chamber. The high- temperature gases leaving
the combustion chamber mix with the main body
Figure (1-10): Diagrammatic sketch of gas turbine
Dr. Mohammedali Abdulhadi & Dr. A. M. Hassan ـــــــــــــــــــــــــــــــــــــــــــــــــــــــــــــــــــــــــــــــــــــــــــــــــ
10
of air flowing around the combustor. This hot gas, with greatly increased volume, is led to a nozzle ring where the pressure is decreased and therefore the velocity is increased. The high- velocity gas is directed against the turbine wheel and the K.E. of the gas is utilized in turning the drive shaft, which also drives the air compressor.
I.C.Engine Parts and Details:
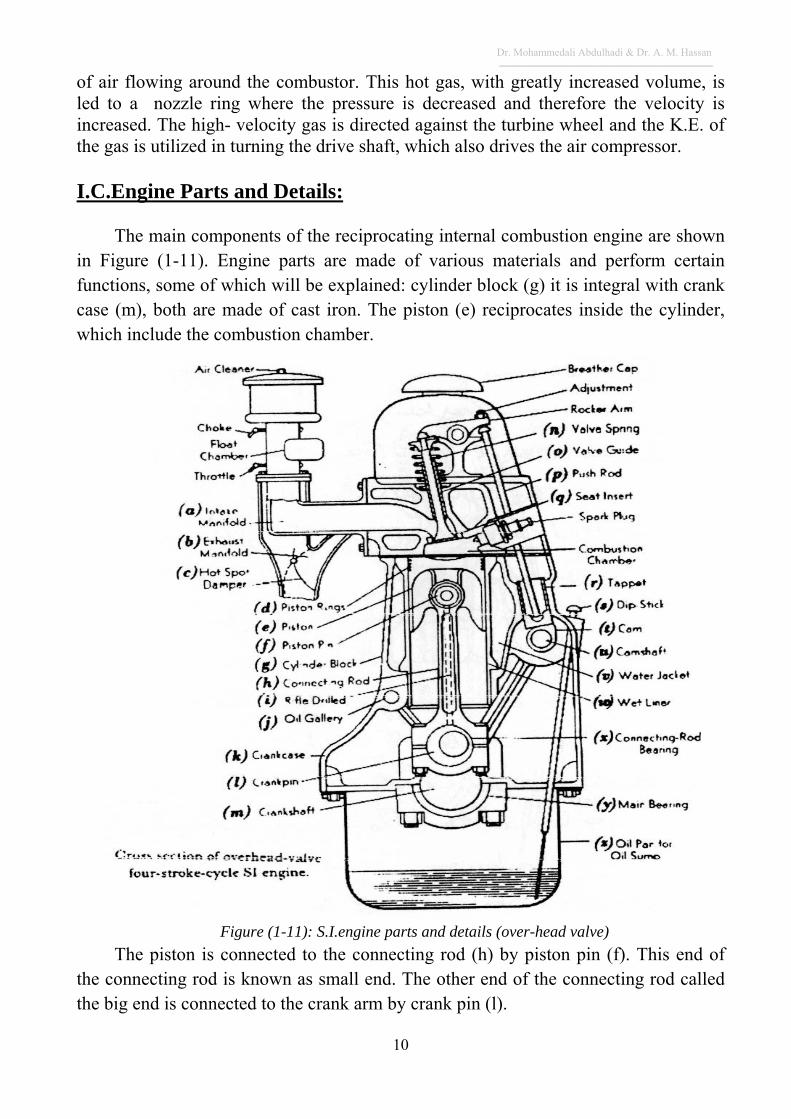
The main components of the reciprocating internal combustion engine are shown in Figure (1-11). Engine parts are made of various materials and perform certain functions, some of which will be explained: cylinder block (g) it is integral with crank case (m), both are made of cast iron. The piston (e) reciprocates inside the cylinder, which include the combustion chamber.
Figure (1-11): S.I.engine parts and details (over-head valve)
The piston is connected to the connecting rod (h) by piston pin (f). This end of the connecting rod is known as small end. The other end of the connecting rod called the big end is connected to the crank arm by crank pin (l).
Dr. Mohammedali Abdulhadi & Dr. A. M. Hassan ـــــــــــــــــــــــــــــــــــــــــــــــــــــــــــــــــــــــــــــــــــــــــــــــــ
11
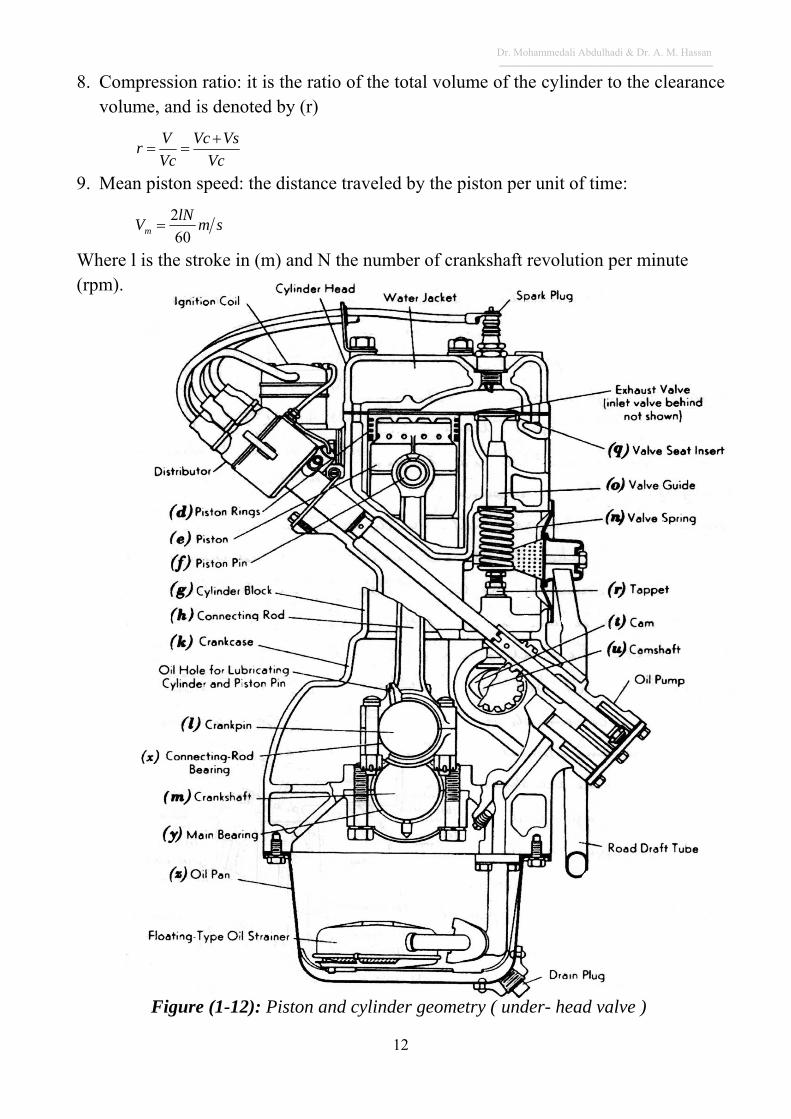
Camshaft (u) makes the cam (t) to rotate and move up and down the valve rod through the tappet (r). Mainly each cylinder has two valves; one is admission or suction valve and the other is exhaust valve.
The ignition system consists of a battery, an ignition coil, a distributor with cam and breaker points, and spark plug for each cylinder. In diesel engines there is an injection system instead of ignition system.
Internal Combustion Engines Terminology:
1. Cylinder bore (B): The nominal inner diameter of the working cylinder.
2. Piston area (A): the area of a circle diameter equal to the cylinder bore.
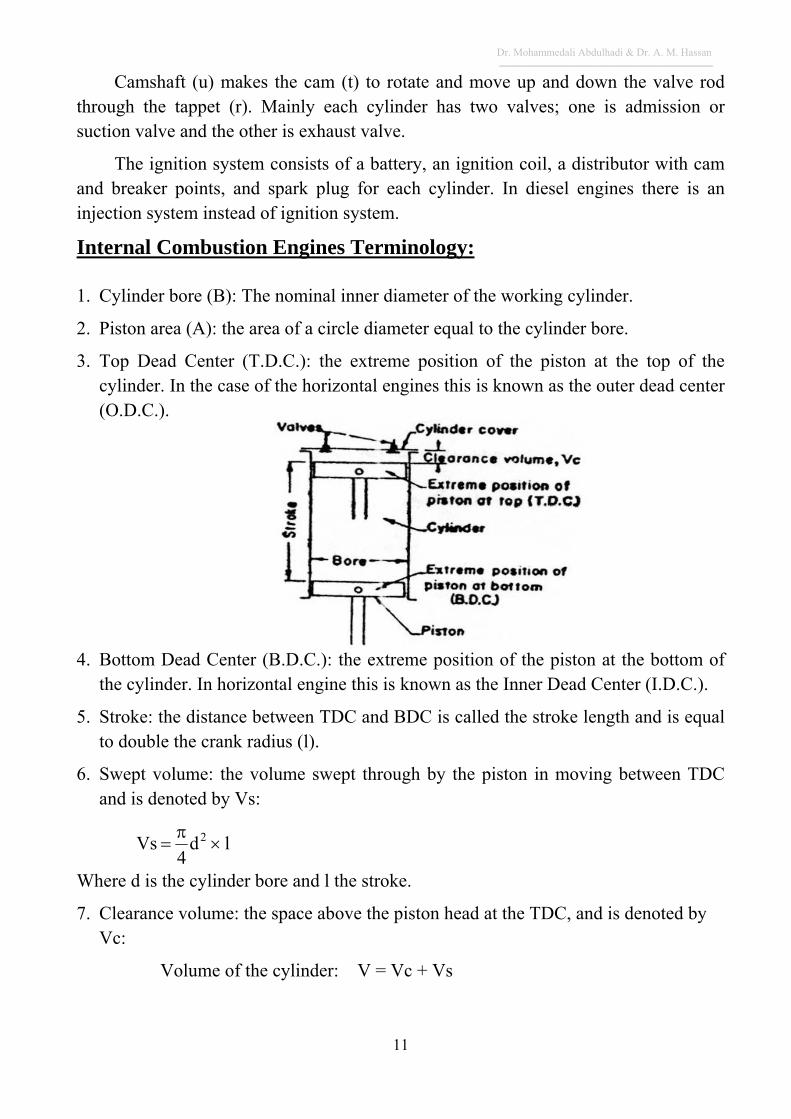
3. Top Dead Center (T.D.C.): the extreme position of the piston at the top of the cylinder. In the case of the horizontal engines this is known as the outer dead center (O.D.C.).
4. Bottom Dead Center (B.D.C.): the extreme position of the piston at the bottom of the cylinder. In horizontal engine this is known as the Inner Dead Center (I.D.C.).
5. Stroke: the distance between TDC and BDC is called the stroke length and is equal to double the crank radius (l).
6. Swept volume: the volume swept through by the piston in moving between TDC and is denoted by Vs:
ld4
Vs 2
Where d is the cylinder bore and l the stroke.
7. Clearance volume: the space above the piston head at the TDC, and is denoted by Vc:
Volume of the cylinder: V = Vc + Vs
Dr. Mohammedali Abdulhadi & Dr. A. M. Hassan ـــــــــــــــــــــــــــــــــــــــــــــــــــــــــــــــــــــــــــــــــــــــــــــــــ
12
8. Compression ratio: it is the ratio of the total volume of the cylinder to the clearance volume, and is denoted by (r)
Vc
VsVc
Vc
Vr
9. Mean piston speed: the distance traveled by the piston per unit of time:
smlN
Vm 60
2
Where l is the stroke in (m) and N the number of crankshaft revolution per minute (rpm).
Figure (1-12): Piston and cylinder geometry ( under- head valve )
Dr. Mohammedali Abdulhadi & Dr. A. M. Hassan ـــــــــــــــــــــــــــــــــــــــــــــــــــــــــــــــــــــــــــــــــــــــــــــــــ
13
CHAPTER (2)
AIR - STANDARD CYCLES
During every engine cycle, the medium changes sometimes it is a mixture of fuel and air or products of combustion, the specific heats and other properties of the medium change with temperature and composition.
The accurate study and analysis of I.C.E. processes is very complicated. To simplify the theoretical study "Standard Air Cycles" are introduced, these cycles are similar to the open cycles, but some simplifying assumptions are made:
1. Cylinder contains constant amount of air and it is treated as ideal gas.
2. The specific heats and other physical and chemical properties remain unchanged during the cycle.
3. Instead of heat generation by combustion, heat is transformed from external heat source.
4. The process of heat removal in the exhaust gases is represented by heat transfer from the cycle to external heat sink.
5. There is neither friction nor turbulence; all processes are assumed to be reversible.
6. No heat loss from the working fluid to the surroundings.
7. Cycles can be presented on any diagram of properties.
The Otto Cycle (constant Volume):
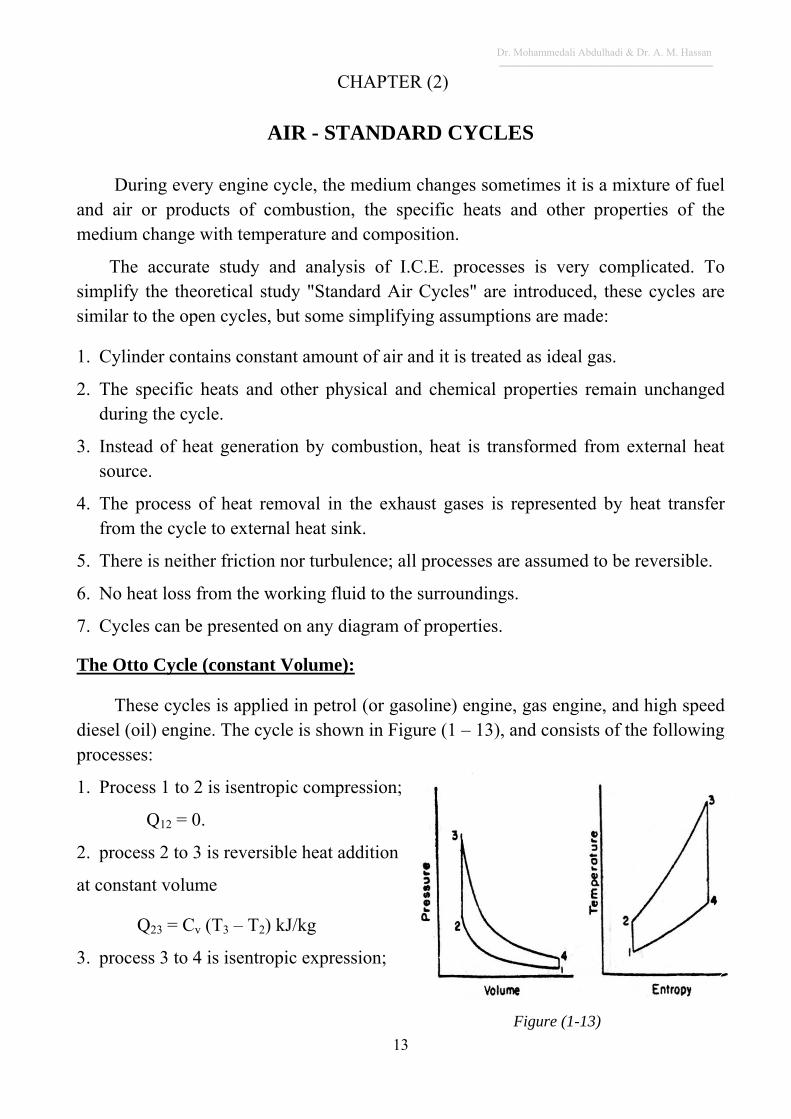
These cycles is applied in petrol (or gasoline) engine, gas engine, and high speed diesel (oil) engine. The cycle is shown in Figure (1 – 13), and consists of the following processes:
1. Process 1 to 2 is isentropic compression;
Q12 = 0.
2. process 2 to 3 is reversible heat addition
at constant volume
Q23 = Cv (T3 – T2) kJ/kg
3. process 3 to 4 is isentropic expression;
Figure (1-13)
Dr. Mohammedali Abdulhadi & Dr. A. M. Hassan ـــــــــــــــــــــــــــــــــــــــــــــــــــــــــــــــــــــــــــــــــــــــــــــــــ
14
Q
Q
Q
QQ1
Q34 = 0 4. process 4 to 5 is reversible constant volume cooling Q41 = Cv (T4 – T1) kj/ kg
This cycle is applied in 4- stroke and 2- stroke engines.
Work of Otto cycle = W34 – W12
The thermal efficiency of the Otto cycle:
23
14
23
14 11TT
TT
TTC
TTC
v
v
1
4
3
1
3
4
1
2
1
1
2
rT
T
V
V
V
V
T
T
1
43 rTT and
112
rTT
1114
14 111
rrTT
TT
increased by increasing r
increased by increasing
independent on the heat added or load.
In modern petrol engines (r) reaches a value of 12.
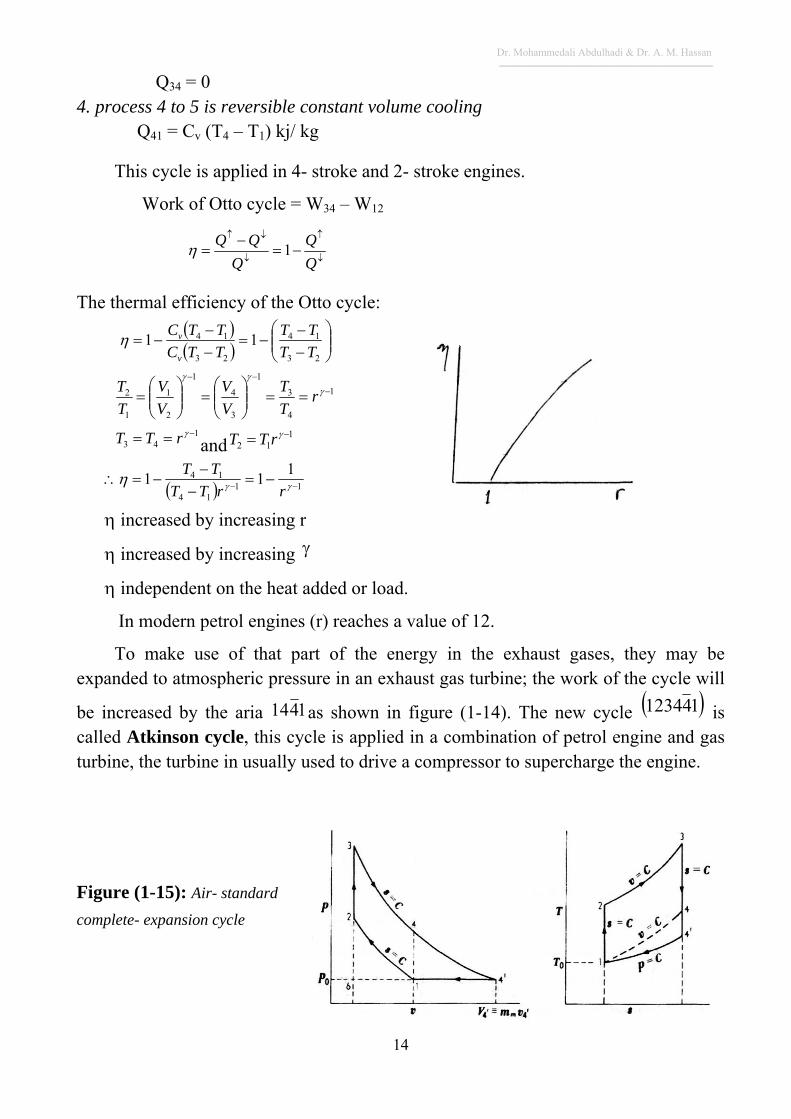
To make use of that part of the energy in the exhaust gases, they may be expanded to atmospheric pressure in an exhaust gas turbine; the work of the cycle will
be increased by the aria 1414 as shown in figure (1-14). The new cycle 141234 is called Atkinson cycle, this cycle is applied in a combination of petrol engine and gas turbine, the turbine in usually used to drive a compressor to supercharge the engine.
Figure (1-15): Air- standard
complete- expansion cycle
Dr. Mohammedali Abdulhadi & Dr. A. M. Hassan ـــــــــــــــــــــــــــــــــــــــــــــــــــــــــــــــــــــــــــــــــــــــــــــــــ
15
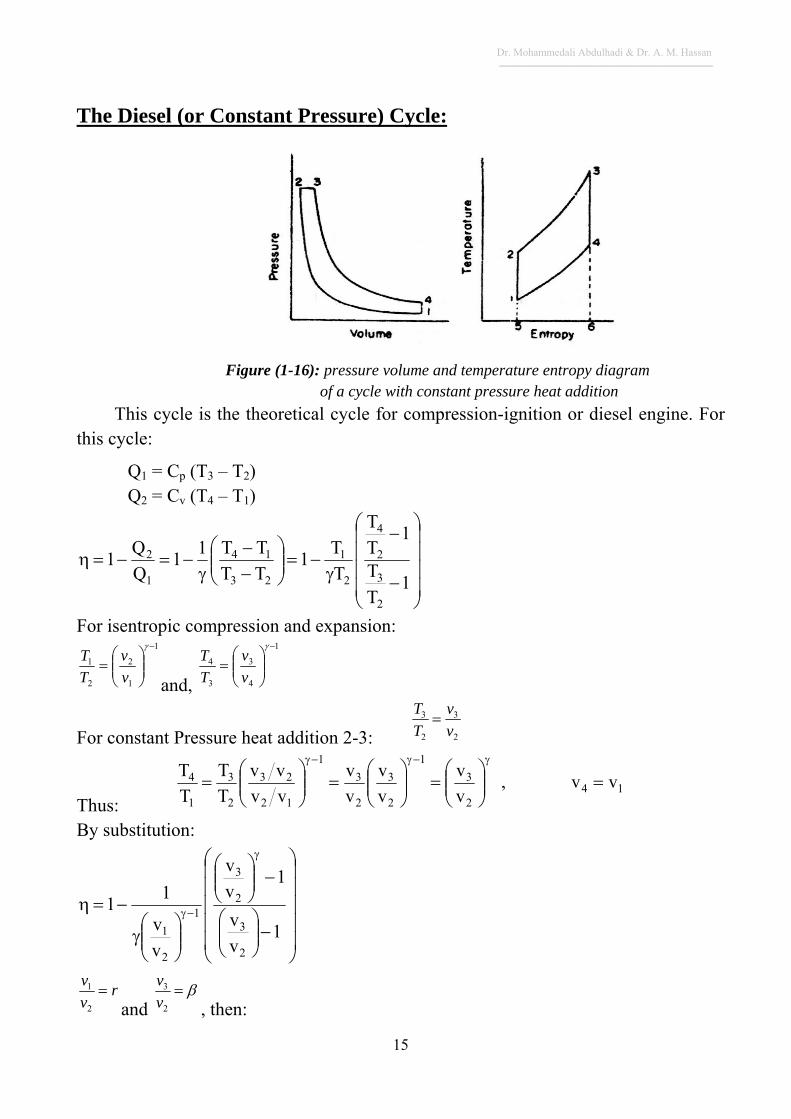
The Diesel (or Constant Pressure) Cycle:
Figure (1-16): pressure volume and temperature entropy diagram of a cycle with constant pressure heat addition
This cycle is the theoretical cycle for compression-ignition or diesel engine. For this cycle:
Q1 = Cp (T3 – T2)
Q2 = Cv (T4 – T1)
1T
T
1T
T
T
T1
TT
TT11
Q
Q1
2
3
2
4
2
1
23
14
1
2
For isentropic compression and expansion:
1
1
2
2
1
v
v
T
T
and,
1
4
3
3
4
v
v
T
T
For constant Pressure heat addition 2-3: 2
3
2
3
v
v
T
T
Thus: 14
2
3
1
2
3
2
3
1
12
23
2
3
1
4 vv,v
v
v
v
v
v
vv
vv
T
T
T
T
By substitution:
1v
v
1v
v
v
v
11
2
3
2
3
1
2
1
rv
v
2
1
and
2
3
v
v
, then:
Dr. Mohammedali Abdulhadi & Dr. A. M. Hassan ـــــــــــــــــــــــــــــــــــــــــــــــــــــــــــــــــــــــــــــــــــــــــــــــــ
16
1r1
11
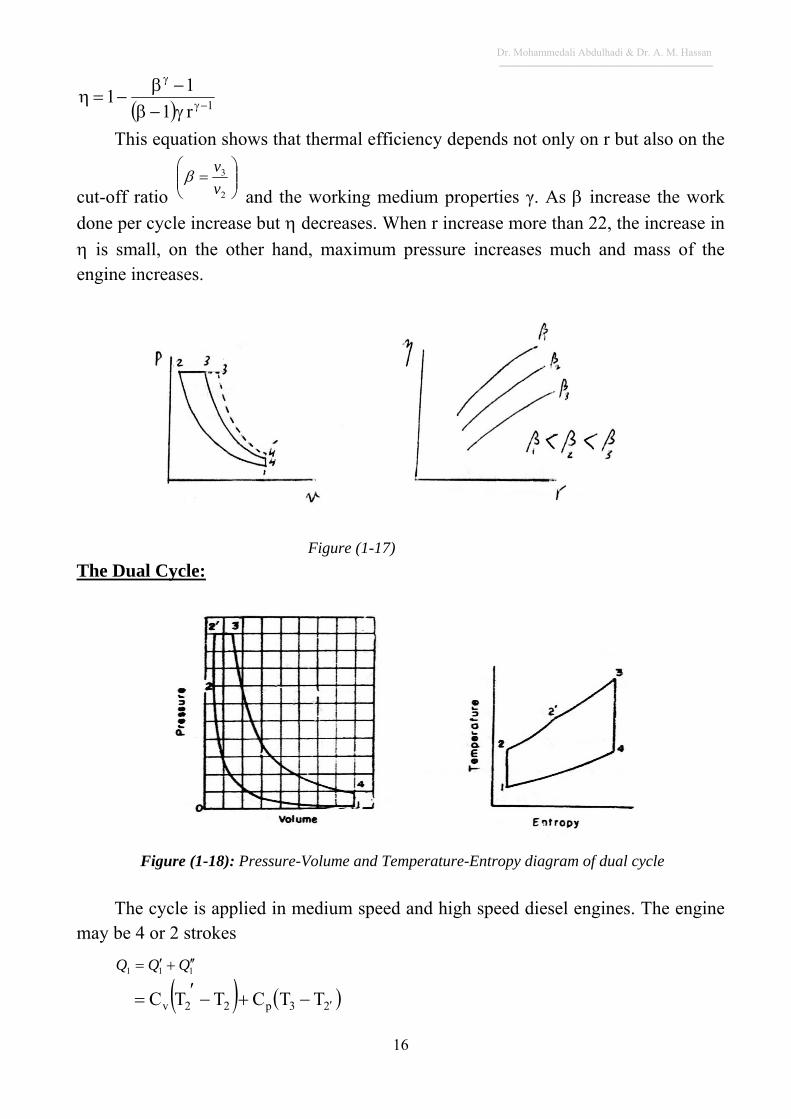
This equation shows that thermal efficiency depends not only on r but also on the
cut-off ratio
2
3
v
v and the working medium properties γ. As increase the work
done per cycle increase but decreases. When r increase more than 22, the increase in
is small, on the other hand, maximum pressure increases much and mass of the engine increases.
Figure (1-17)
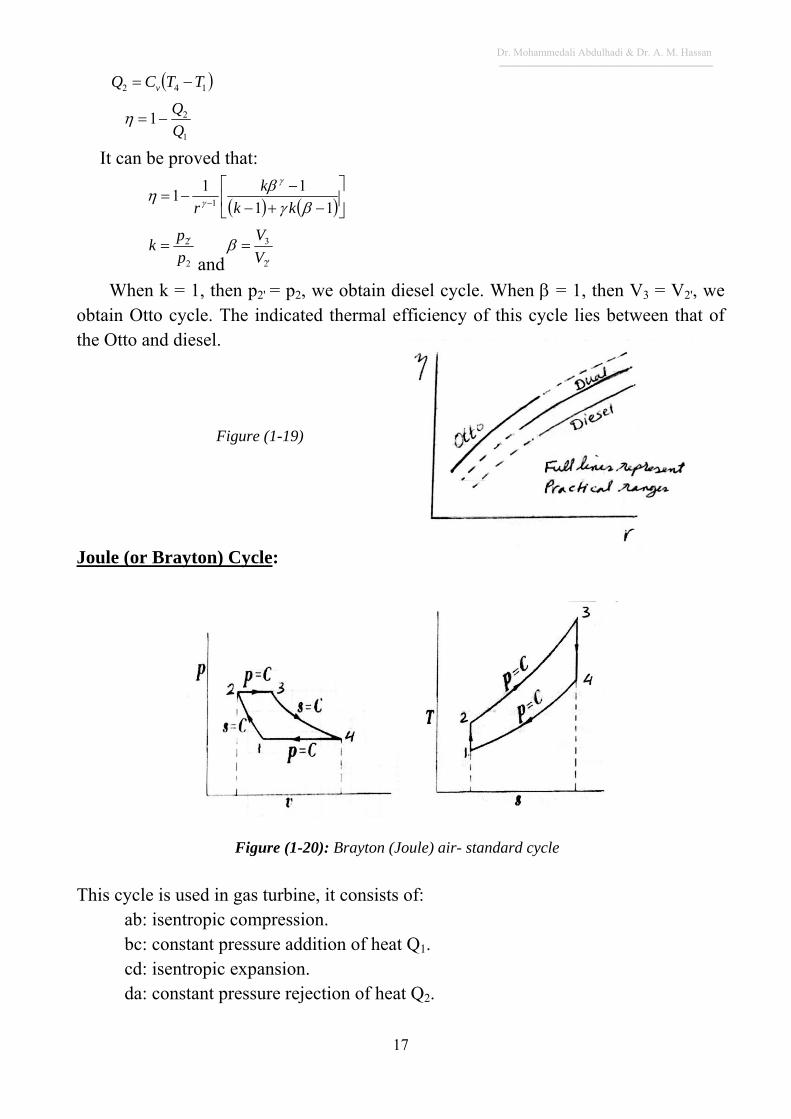
The Dual Cycle:
Figure (1-18): Pressure-Volume and Temperature-Entropy diagram of dual cycle
The cycle is applied in medium speed and high speed diesel engines. The engine
may be 4 or 2 strokes
111 QQQ
23p22v TTCTTC
Dr. Mohammedali Abdulhadi & Dr. A. M. Hassan ـــــــــــــــــــــــــــــــــــــــــــــــــــــــــــــــــــــــــــــــــــــــــــــــــ
17
142 TTCQ v
1
21Q
Q
It can be proved that:
11
111
1
kk
k
r
2
2
p
pk
and 2
3
V
V
When k = 1, then p2' = p2, we obtain diesel cycle. When = 1, then V3 = V2', we obtain Otto cycle. The indicated thermal efficiency of this cycle lies between that of the Otto and diesel.
Figure (1-19)
Joule (or Brayton) Cycle:
Figure (1-20): Brayton (Joule) air- standard cycle
This cycle is used in gas turbine, it consists of:
ab: isentropic compression. bc: constant pressure addition of heat Q1. cd: isentropic expansion. da: constant pressure rejection of heat Q2.
Dr. Mohammedali Abdulhadi & Dr. A. M. Hassan ـــــــــــــــــــــــــــــــــــــــــــــــــــــــــــــــــــــــــــــــــــــــــــــــــ
18
23
14
23
14
1
2 111TT
TT
TTCp
TTCp
Q
Q
1
1
2
1
11
1
2
2
1 11
rp
p
rV
V
T
T
Regenerative Cycles:
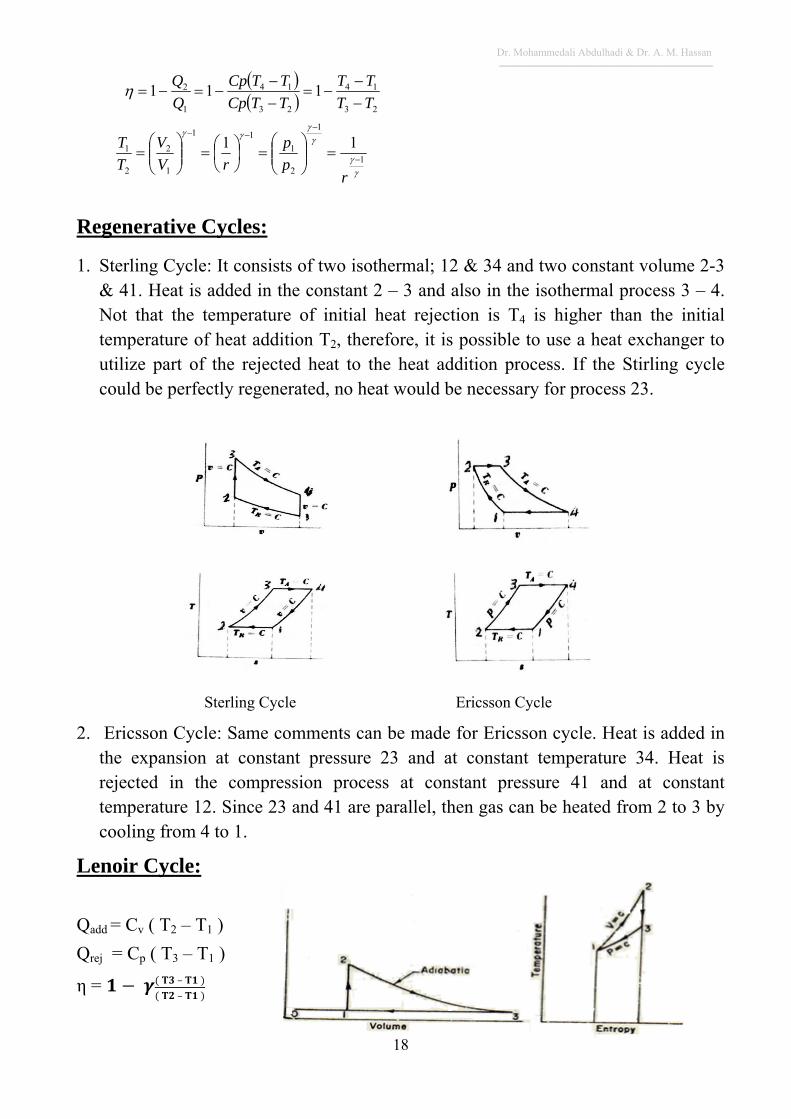
1. Sterling Cycle: It consists of two isothermal; 12 & 34 and two constant volume 2-3 & 41. Heat is added in the constant 2 – 3 and also in the isothermal process 3 – 4. Not that the temperature of initial heat rejection is T4 is higher than the initial temperature of heat addition T2, therefore, it is possible to use a heat exchanger to utilize part of the rejected heat to the heat addition process. If the Stirling cycle could be perfectly regenerated, no heat would be necessary for process 23.
Sterling Cycle Ericsson Cycle
2. Ericsson Cycle: Same comments can be made for Ericsson cycle. Heat is added in the expansion at constant pressure 23 and at constant temperature 34. Heat is rejected in the compression process at constant pressure 41 and at constant temperature 12. Since 23 and 41 are parallel, then gas can be heated from 2 to 3 by cooling from 4 to 1.
Lenoir Cycle:
Qadd = Cv ( T2 – T1 )
Qrej = Cp ( T3 – T1 )
η = – –
Dr. Mohammedali Abdulhadi & Dr. A. M. Hassan ـــــــــــــــــــــــــــــــــــــــــــــــــــــــــــــــــــــــــــــــــــــــــــــــــ
19
Comparison of Otto, diesel and Dual Cycles:
The important parameters in cycle analysis are compression ratio, maximum pressure, maximum temperature, head input, work output, etc.
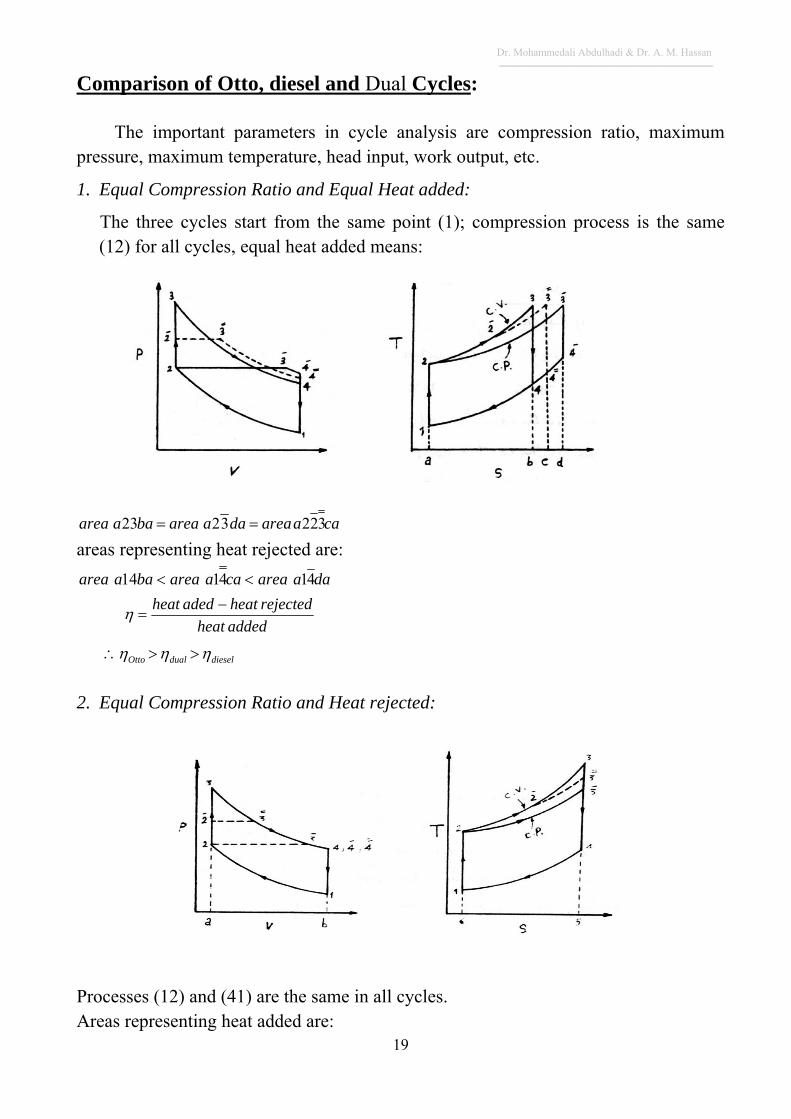
1. Equal Compression Ratio and Equal Heat added:
The three cycles start from the same point (1); compression process is the same (12) for all cycles, equal heat added means:
caaareadaaareabaaarea 3223223 areas representing heat rejected are:
daaareacaaareabaaarea 414114
addedheat
rejectedheatadedheat
dieseldualOtto
2. Equal Compression Ratio and Heat rejected:
Processes (12) and (41) are the same in all cycles. Areas representing heat added are:
Dr. Mohammedali Abdulhadi & Dr. A. M. Hassan ـــــــــــــــــــــــــــــــــــــــــــــــــــــــــــــــــــــــــــــــــــــــــــــــــ
20
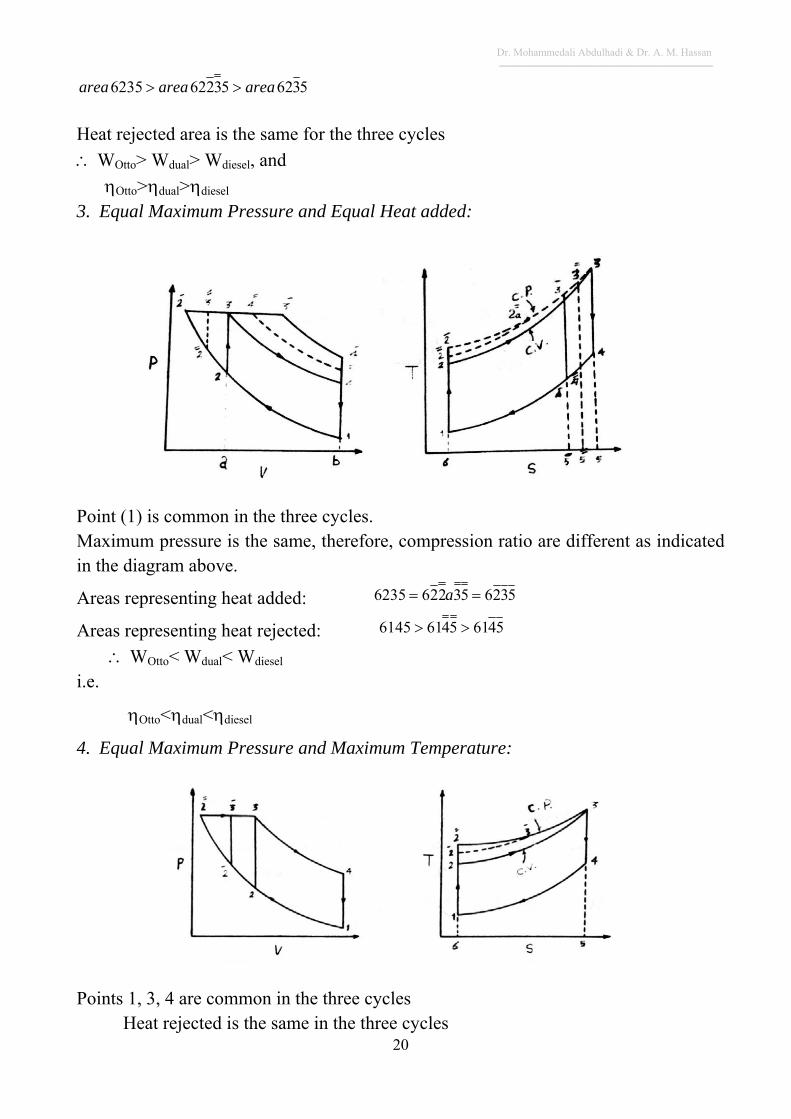
5362532626235 areaareaarea
Heat rejected area is the same for the three cycles
WOtto> Wdual> Wdiesel, and
Otto>dual>diesel
3. Equal Maximum Pressure and Equal Heat added:
Point (1) is common in the three cycles. Maximum pressure is the same, therefore, compression ratio are different as indicated in the diagram above.
Areas representing heat added: 5326532266235 a
Areas representing heat rejected: 546154616145
WOtto< Wdual< Wdiesel
i.e.
Otto<dual<diesel
4. Equal Maximum Pressure and Maximum Temperature:
Points 1, 3, 4 are common in the three cycles Heat rejected is the same in the three cycles

Dr. Mohammedali Abdulhadi & Dr. A. M. Hassan ـــــــــــــــــــــــــــــــــــــــــــــــــــــــــــــــــــــــــــــــــــــــــــــــــ
21
Heat added is highest in diesel cycle:
Area 3526353266235
WOtto< Wdual< Wdiesel
i.e.
Otto<dual<diesel
Mohammedali Abdulhadi & A. M. Hassan ــــــــــــــــــــــــــــــــــــــــــــــــــــــــــــــــــــــــــــــــــــ
22
CHAPTER (3)
FUEL AND COMBUSTION
Fuels: Fuel is any material when burnt will produce heat energy. Various fuels
commonly used are as follows:
1. Solid Fuels:
Coal is the most important solid fuel; there are other types of solid fuels, such as: nuclear fuels, solid wastes (wood, sugar-cane). Coal is divided into groups according to their chemical and physical properties. An accurate chemical analysis for the fuel by mass is called the "ultimate analysis", which gives the percentage of the important elements present in the fuel. Another approximate analysis of fuel called the "proximate analysis" gives the percentage of moisture, volatile matter, and combustible solid (fixed carbon) and ash.
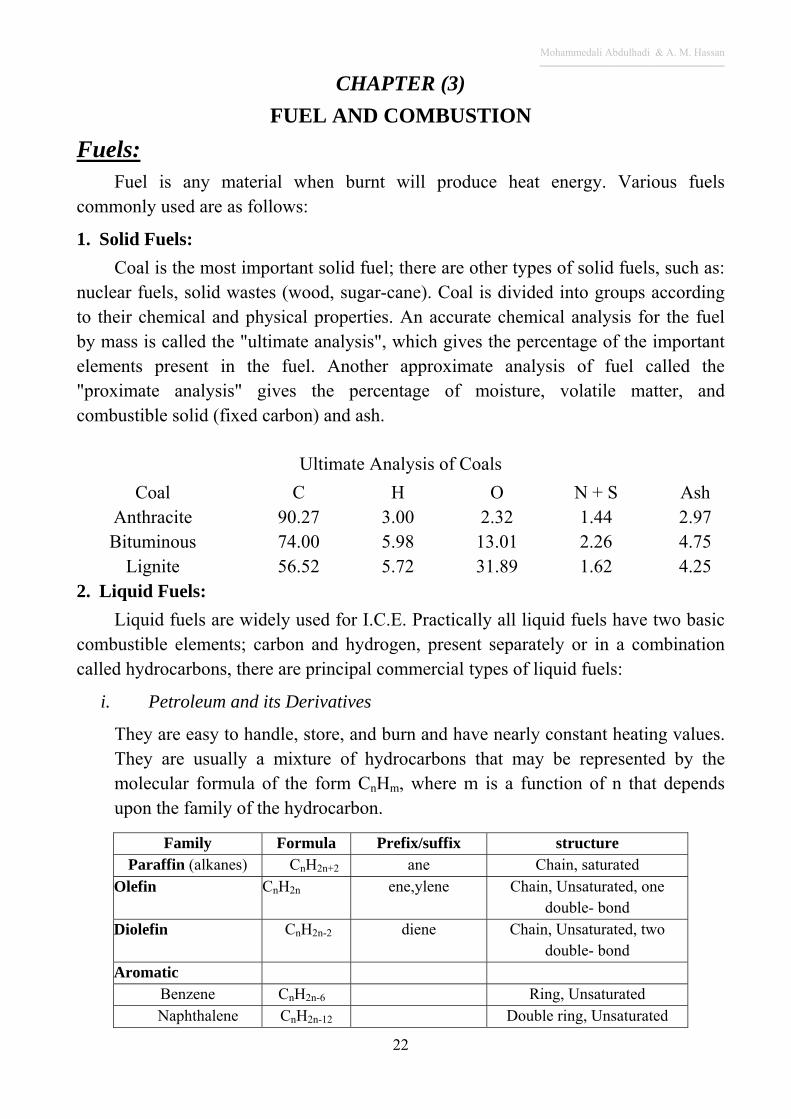
Ultimate Analysis of Coals
Coal
C
H
O
N + S
Ash Anthracite 90.27 3.00 2.32 1.44 2.97 Bituminous 74.00 5.98 13.01 2.26 4.75
Lignite 56.52 5.72 31.89 1.62 4.25 2. Liquid Fuels:
Liquid fuels are widely used for I.C.E. Practically all liquid fuels have two basic combustible elements; carbon and hydrogen, present separately or in a combination called hydrocarbons, there are principal commercial types of liquid fuels:
i. Petroleum and its Derivatives
They are easy to handle, store, and burn and have nearly constant heating values. They are usually a mixture of hydrocarbons that may be represented by the molecular formula of the form CnHm, where m is a function of n that depends upon the family of the hydrocarbon.
Family Formula Prefix/suffix structure
Paraffin (alkanes) CnH2n+2 ane Chain, saturated Olefin CnH2n ene,ylene Chain, Unsaturated, one
double- bond Diolefin CnH2n-2 diene Chain, Unsaturated, two
double- bond Aromatic
Benzene CnH2n-6 Ring, Unsaturated Naphthalene CnH2n-12 Double ring, Unsaturated
Mohammedali Abdulhadi & A. M. Hassan ــــــــــــــــــــــــــــــــــــــــــــــــــــــــــــــــــــــــــــــــــــ
23
ii. Synthetic fuels
Usually called synfuels, which are liquid and gases mainly produced from coal, oil shale, tar sands and also from various wastes and biomass.
iii. Alcohols
The alcohols are a partial oxidation product of petroleum, and are not found to any extent in the crude oil. The compounds are saturated, with a chain structure with the general formula R.OH. Here the radical R is the paraffin group attached to the hydroxyl radical OH. Alcohols are designated by the name of the radical: CH3OH: Methyl alcohol or Methanol. C2H5OH: Ethyl alcohol or Ethanol. C3H7OH: Propyl alcohol or Propanol. C4H9OH: Butyl alcohol or Butanol.
3. Gaseous Fuels:
Gaseous fuels are may be either natural or manufactured; natural gas: is a mixture of components, consisting mainly of methane (60-98%) with small amount of other hydrocarbons. In addition it consists; N2, CO2, H2 and traces of other gases. Its sulfur content ranges from very little (sweet) to larger amounts (sour). It is classified as associated or unassociated depending on whether it is associated with oil or not. It is stored as compressed natural gas (CNG) or as liquid (LNG) at pressure ranging between 70 to 210 kPa.
Manufactured Gases Include:
1. Liquid petroleum gas (LPG): It is mixture of propane and butane and some other light hydrocarbons. Propane and butane are the main constituent of LPG; their quantity varies with time of the year and place.
2. Coal gas: it is a by-product obtained during the destructive distillation of coal. Its main approximate composition is CH4 = 25%, H = 53%, CO = 9%, N = 6%,
CO2 = 2% and other hydrocarbons 1%.
3. Coke oven Gas: It is produced during the manufacture of coke from new coal in a coke oven where the volatile matter is distilled off and the coke-oven separated from liquids and solids in the volatile matter by cooling and extraction. It consists about 50% H2, about 30% methane(CH4), and the remainder of various other gases. Its heating value ranges between 14200 to21300 kJ/m3.
4. Blast-furnace gas: it is produced as by-product from blast furnaces used in iron reduction process, has about 30%, CO, 2% H2, 11% CO2 and about 60% N2.
Mohammedali Abdulhadi & A. M. Hassan ــــــــــــــــــــــــــــــــــــــــــــــــــــــــــــــــــــــــــــــــــــ
24
There are other gaseous fuels of lesser importance like producer gas, water gas, and town gas.
Advantages of gaseous fuels:
1. Low emissions.
2. Mixing with air is uniform, so they need less excess air.
3. Economical compared to other types of fuels.
Combustion of Fuels:
Combustion of fuel is accomplished by mixing fuel with air at elevated temperature:
Fuel + Air Products of Combustion + Heat
The oxygen contained in the air unites chemically with carbon, hydrogen and other elements in fuel to produce heat. The amount of heat liberated during the combustion process depends on the amount of oxidation of the constituent of fuel and the nature of fuel.
In order that the combustion of fuel may take place with high efficiency, the following conditions must be fulfilled:
1. The amount of air supplied should be sufficient.
2. The air and fuel should be thoroughly mixed.
3. The temperature of the reactants should be high enough to ignite the mixture.
4. Sufficient time should be available to burn fuel completely.
Combustion Chemistry:
1. Chemical Equation:
The chemical equation shows how the atoms of the reactants are arranged to form products. Before the chemical equation can be written it is necessary to know the number of atoms of elements in the molecules of the reactants and products. During combustion process the atoms are rearranged to form new molecules, and the total number of atoms of each element is unchanged. A chemical equation expresses the principle of the conservation of mass in terms of the conservation of atoms
i- Combustion of Carbon
C + O2 CO2
1 kmol C + 1 kmol O2 1 kmol CO2
Mohammedali Abdulhadi & A. M. Hassan ــــــــــــــــــــــــــــــــــــــــــــــــــــــــــــــــــــــــــــــــــــ
25
12 kg C + 32 kg O2 44 kg CO2
If any of the reactants or products is in solid or liquid phase, the volume occupied by them can be neglected. It follows that:
0 vol. C + 1vol O2 1vol. CO2
If insufficient oxygen is present for all carbon to burn to carbon dioxide, some will burn to carbon monoxide, then:
C + 1/2 O2CO
ii- Combustion of Hydrogen
H2 + 1/2 O2 H2O
1 kmol H2 + 1/2 kmol O2 1 kmol H2O
2kg H2 + 16 kg O2 18kg H2O
1 vol. H2 + 1/2 vol. O2 1 vol. H2O (vapour)
In most engineering combustion systems the necessary oxygen is obtained by mixing the fuel with air (except rockets) and it is necessary to use accurate and consistent analysis of air by mass and by volume. It is usual in combustion calculations to take air as 23.3% O2, 76.7% N2 by mass, and 21% O2, 79% N2 by volume. The small traces of other gases in dry air are included in the nitrogen, which is sometimes called "atmospheric nitrogen".
The moisture or humidity in atmospheric air varies over wide limits, depending on meteorological conditions. Its presence in most cases simply implies an additional amount of inert material.
The molar mass of O2 can be taken as 32 kg/kmol, and that of N2 as 28 kg/kmol and air 29 kg/kmol.
Since oxygen is accompanied by nitrogen when air is supplied for combustion, then this nitrogen should be included in the combustion equation, it will appear on
both sides of the equation. With one mole of O2 there are 762.321
79 moles of N2,
Hence:
2222 N
21
79CON
21
79OC
Also
22222 21
79
2
1)
21
79(
2
1NOHNOH
Mohammedali Abdulhadi & A. M. Hassan ــــــــــــــــــــــــــــــــــــــــــــــــــــــــــــــــــــــــــــــــــــ
26
fuelofmass
airofmass
m
mFA
f
a
22222 4762.3
24762.3
4N
mnOH
mnCON
mnO
mnHC mn
A frequently used quantity in the analysis of combustion process is the air-fuelratio A/F. it is defined as the ratio of the mass of air to the mass of fuel for a combustion process.
The mass m of a substance is related to the number of moles n through the relation: m = nM, where M is the molar mass. The reciprocal of A/F ratio is called the fuel-air ratio.
The minimum amount of air needed for the complete combustion of a fuel is called the stoichiometric or theoretical air. In actual combustion processes, it is common practice to use more air than the stoichiometric amount. The amount of extra air than the stoichiometric is called (excess air). Amount of air less than stoichiometric amount is called (deficiency of air). Equivalence ratio is the ratio of the actual fuel- air ratio to the stoichiometric fuel-air ratio. Sometimes this ratio is given in term of A/F ratio and called mixture strength.
RatioFAActual
RatioFAtricStoichiomestrengthMixture
ratioAFStoich
ratioAFActualratioeEquivalenc
)(.
)(
actual)FA(
stoich)FA(
stoich)AF(
actual)AF(
Where: ϕ = 1: stoichiometric ϕ< 1: lean (week) mixture- excess of air. ϕ> 1: rich mixture- deficiency of air.
A general reaction equation of a hydrocarbon fuel for stoichiometric condition with air is given by:
The composition of a hydrocarbon fuel CnHm are carbon and hydrogen, n and m can be determined for 1 kg of fuel as follows:
mn
nm
n
nC
fuelofWeight
fuelinCofWeight
12
12
202.212
12
1
Exhaust and Flue Gas Analysis:
The products of combustion are mainly gaseous. When a sample is taken for analysis it is usually cooled down to a temperature which is below the saturation temperature of the steam present. The steam content is therefore not included in the
Mohammedali Abdulhadi & A. M. Hassan ــــــــــــــــــــــــــــــــــــــــــــــــــــــــــــــــــــــــــــــــــــ
27
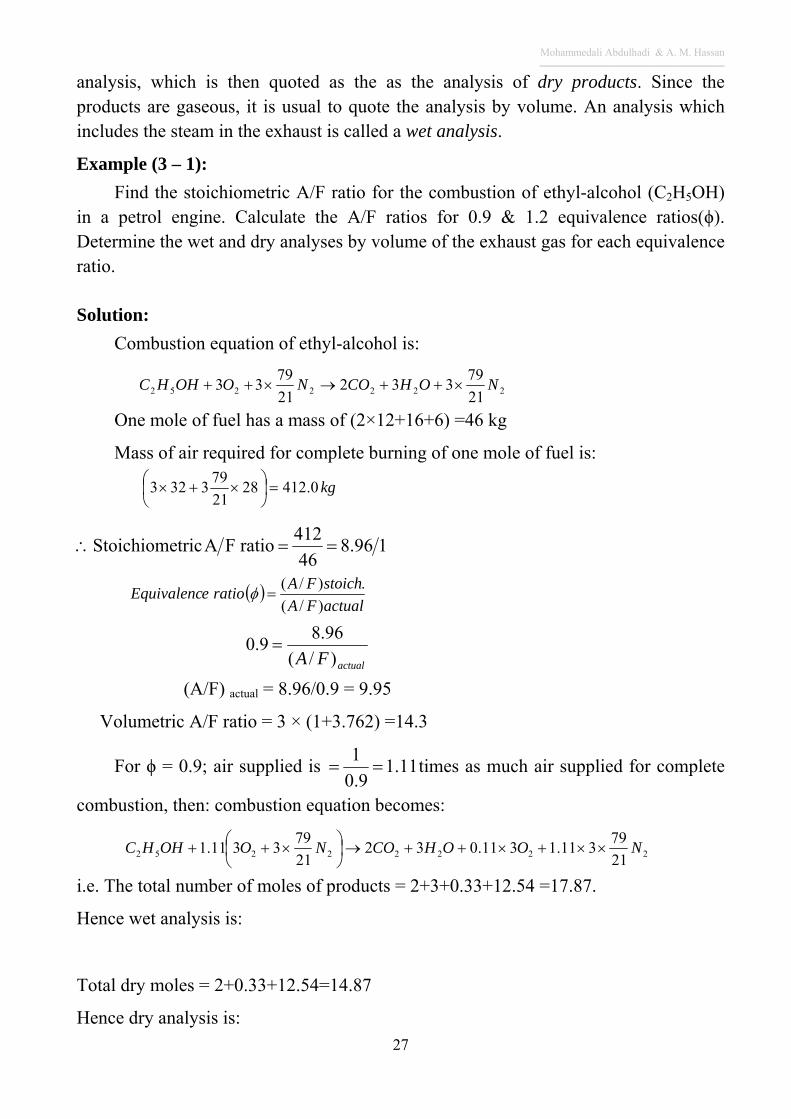
analysis, which is then quoted as the as the analysis of dry products. Since the products are gaseous, it is usual to quote the analysis by volume. An analysis which includes the steam in the exhaust is called a wet analysis.
Example (3 – 1):
Find the stoichiometric A/F ratio for the combustion of ethyl-alcohol (C2H5OH) in a petrol engine. Calculate the A/F ratios for 0.9 & 1.2 equivalence ratios(ϕ). Determine the wet and dry analyses by volume of the exhaust gas for each equivalence ratio.
Solution:
Combustion equation of ethyl-alcohol is:
2222252 21
79332
21
7933 NOHCONOOHHC
One mole of fuel has a mass of (2×12+16+6) =46 kg
Mass of air required for complete burning of one mole of fuel is:
kg0.4122821
793323
196.846
412ratioFAtricStoichiome
actualFA
stoichFAratioeEquivalenc
)/(
.)/(
(A/F) actual = 8.96/0.9 = 9.95
Volumetric A/F ratio = 3 × (1+3.762) =14.3
For ϕ = 0.9; air supplied is 11.19.0
1 times as much air supplied for complete
combustion, then: combustion equation becomes:
22222252 21
79311.1311.032
21
793311.1 NOOHCONOOHHC
i.e. The total number of moles of products = 2+3+0.33+12.54 =17.87.
Hence wet analysis is:
Total dry moles = 2+0.33+12.54=14.87
Hence dry analysis is:
actualFA )/(
96.89.0
Mohammedali Abdulhadi & A. M. Hassan ــــــــــــــــــــــــــــــــــــــــــــــــــــــــــــــــــــــــــــــــــــ
28
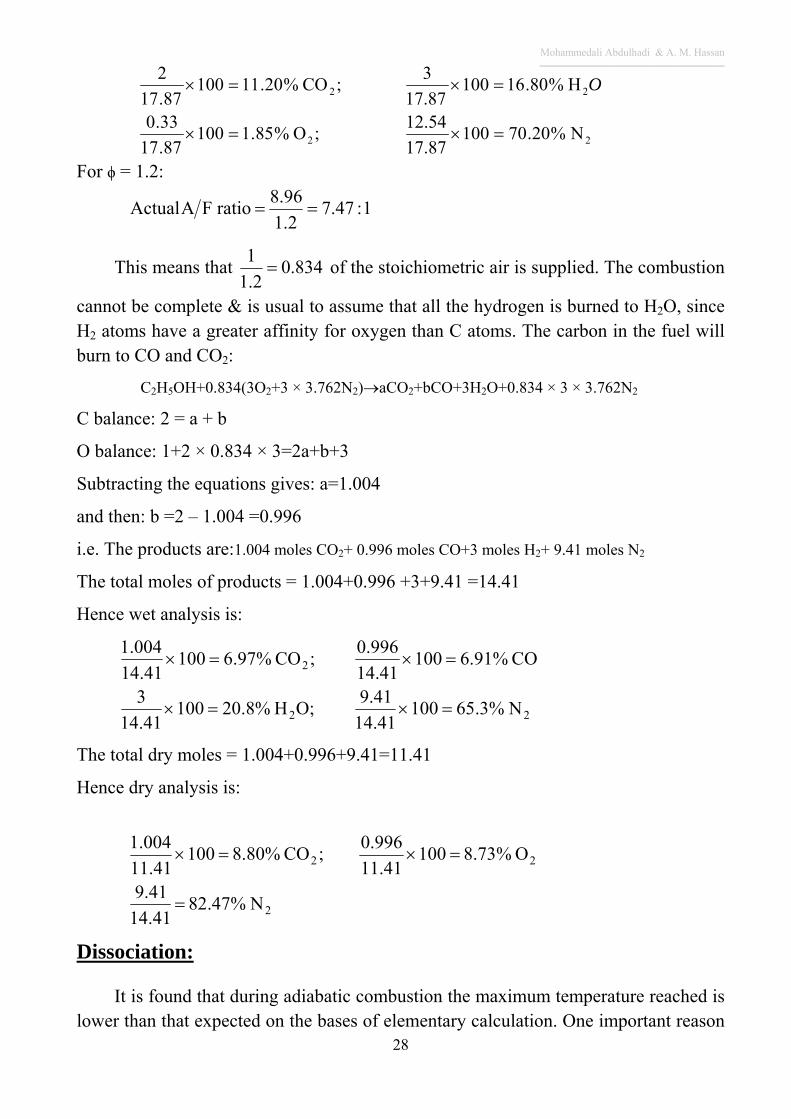
22
22
N %20.7010017.87
12.54 ;O %85.1100
87.17
33.0
H %80.1610017.87
3 ;CO %20.11100
87.17
2
O
For ϕ = 1.2:
1:47.7
2.1
96.8ratioFAActual
This means that 834.02.1
1 of the stoichiometric air is supplied. The combustion
cannot be complete & is usual to assume that all the hydrogen is burned to H2O, since H2 atoms have a greater affinity for oxygen than C atoms. The carbon in the fuel will burn to CO and CO2:
C2H5OH+0.834(3O2+3 × 3.762N2)aCO2+bCO+3H2O+0.834 × 3 × 3.762N2
C balance: 2 = a + b
O balance: 1+2 × 0.834 × 3=2a+b+3
Subtracting the equations gives: a=1.004
and then: b =2 – 1.004 =0.996
i.e. The products are:1.004 moles CO2+ 0.996 moles CO+3 moles H2+ 9.41 moles N2
The total moles of products = 1.004+0.996 +3+9.41 =14.41
Hence wet analysis is:
22
2
N %3.6510014.41
9.41 O;H %8.20100
41.14
3
OC %91.610014.41
0.996 ;CO %97.6100
41.14
004.1
The total dry moles = 1.004+0.996+9.41=11.41
Hence dry analysis is:
2
22
N %47.8241.14
41.9
O %73.810011.41
0.996 ;CO %80.8100
41.11
004.1
Dissociation:
It is found that during adiabatic combustion the maximum temperature reached is lower than that expected on the bases of elementary calculation. One important reason
Mohammedali Abdulhadi & A. M. Hassan ــــــــــــــــــــــــــــــــــــــــــــــــــــــــــــــــــــــــــــــــــــ
29
for this is that the exothermic combustion process can be reversed to some extent if the temperature is high enough. The reversed process is an endothermic one, i.e. energy is absorbed. In a real process the reaction proceeds in both directions simultaneously and chemical equilibrium is reached when the rate of break-up of product molecules is equal to their rate of formation. This is represented, for the combustion of CO and H2, by:
2CO+O22CO2 and 2H2+O22H2O
Both of these equations can take place simultaneously in the same combustion process. The proportions of the constituents adjust themselves to satisfy the equilibrium conditions and their actual values depend on the particular pressure and temperature.
Dissociation may be neglected at temperature below 1500K. As the gases cool down in the expansion stroke, dissociation is reduced and the recombination of the dissociated molecules gives up heat.
Let the gases A & B react to form the products C & D in the proportions dictated by the stoichiometric equation:
DCBA dcba
The proportion of gases A, B, C and D in the balanced mixture is determined by the dissociation equilibrium constant, K which is defined as:
ba
dc
BA
DC
PP
PPK
K is a function of temperature and its values are tabulated against temperature for each reaction equation.
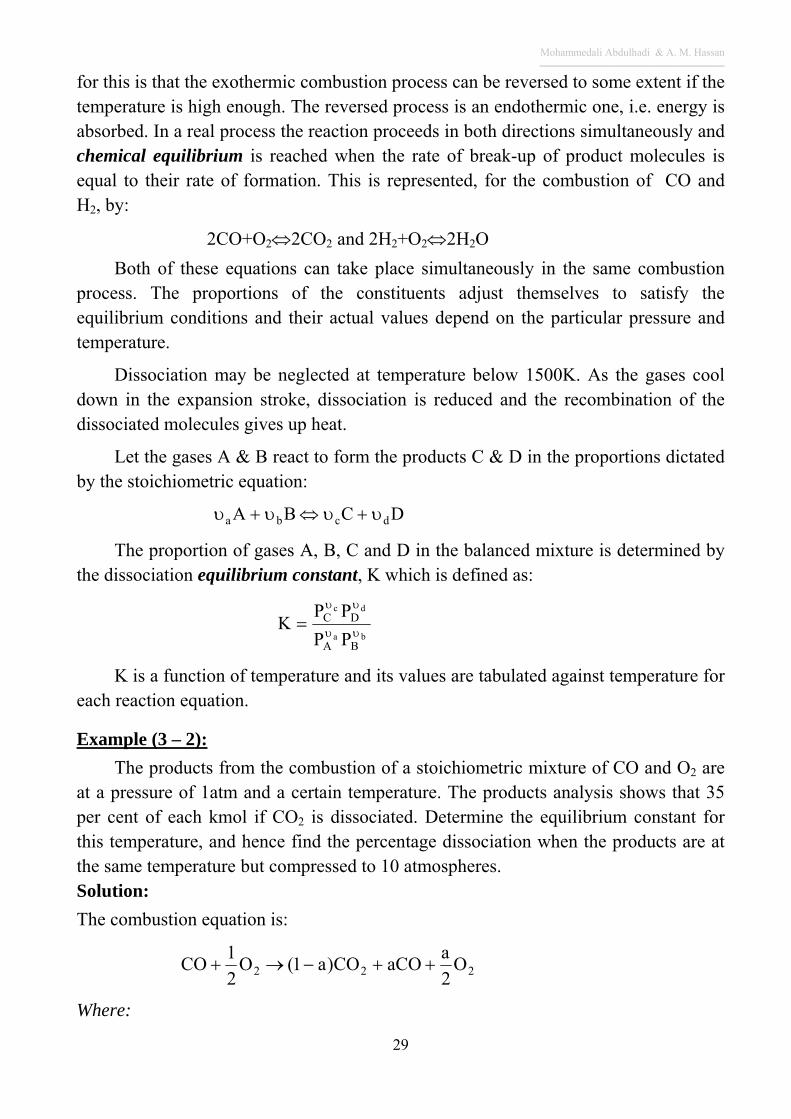
Example (3 – 2):
The products from the combustion of a stoichiometric mixture of CO and O2 are at a pressure of 1atm and a certain temperature. The products analysis shows that 35 per cent of each kmol if CO2 is dissociated. Determine the equilibrium constant for this temperature, and hence find the percentage dissociation when the products are at the same temperature but compressed to 10 atmospheres. Solution:
The combustion equation is:
222 O
2
aaCOCO)a1(O
2
1CO
Where:
Mohammedali Abdulhadi & A. M. Hassan ــــــــــــــــــــــــــــــــــــــــــــــــــــــــــــــــــــــــــــــــــــ
30
2
1
2
1
21
2
21
21
1
PP
P
a
a
aa
aa
K
Pa
a
PPa
aPP
aa
P ococo
21
2 ,
21
,
21
122
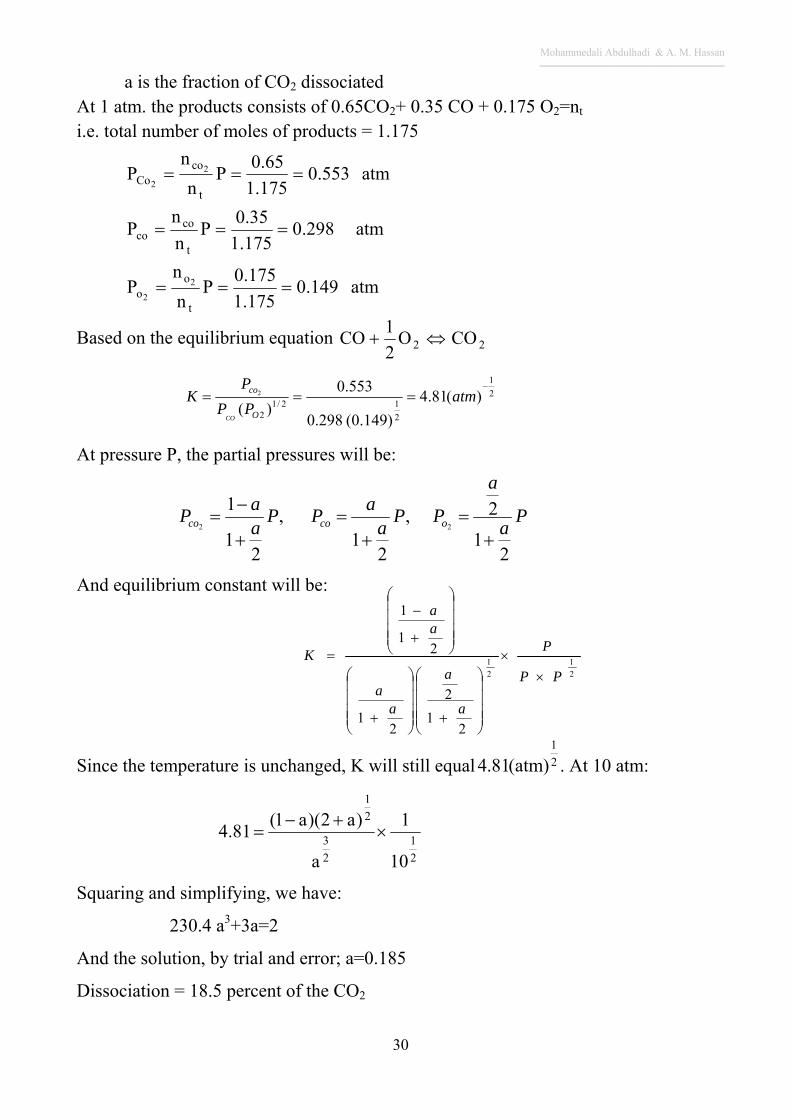
a is the fraction of CO2 dissociated At 1 atm. the products consists of 0.65CO2+ 0.35 CO + 0.175 O2=nt i.e. total number of moles of products = 1.175
atm 149.0175.1
175.0P
n
nP
atm 298.0175.1
35.0P
n
nP
atm 553.0175.1
65.0P
n
nP
t
oo
t
coco
t
coCo
2
2
2
2
Based on the equilibrium equation 22 COO2
1CO
2
1
2
12/12
)(81.4
)149.0(298.0
553.0
)(2
atm
PP
PK
O
co
CO
At pressure P, the partial pressures will be:
And equilibrium constant will be:
Since the temperature is unchanged, K will still equal 2
1
)atm(81.4 . At 10 atm:
2
1
2
3
2
1
10
1
a
)a2)(a1(81.4
Squaring and simplifying, we have:
230.4 a3+3a=2
And the solution, by trial and error; a=0.185
Dissociation = 18.5 percent of the CO2
Mohammedali Abdulhadi & A. M. Hassan ــــــــــــــــــــــــــــــــــــــــــــــــــــــــــــــــــــــــــــــــــــ
31
This indicates that although K is independent of pressure of the reacting mixture, the actual fraction of the dissociated product usually varies with pressure.
Enthalpy of Formation )h( of :
The enthalpy of formation of a chemical compound is; the increase in enthalpy when a compound is formed from its constituent elements in their natural form and in a standard state.
The natural state of the element is its most stable state. The normal form of oxygen (O2) and hydrogen (H2) are gaseous, so )( o
fh for these can be put equal to zero.
The standard reference state(STP) is 25oC and 1 atm. pressure. Property values at the standard reference state are indicated by a superscript (o) such as ho, uo, etc. It was found adequate to assume that the enthalpy of all elements is zero at the reference state. The enthalpy at any temperature and pressure is given by: )(Thhh o
fPT , h(T)
is given in tables.
First Law Applied to Combustion Process:
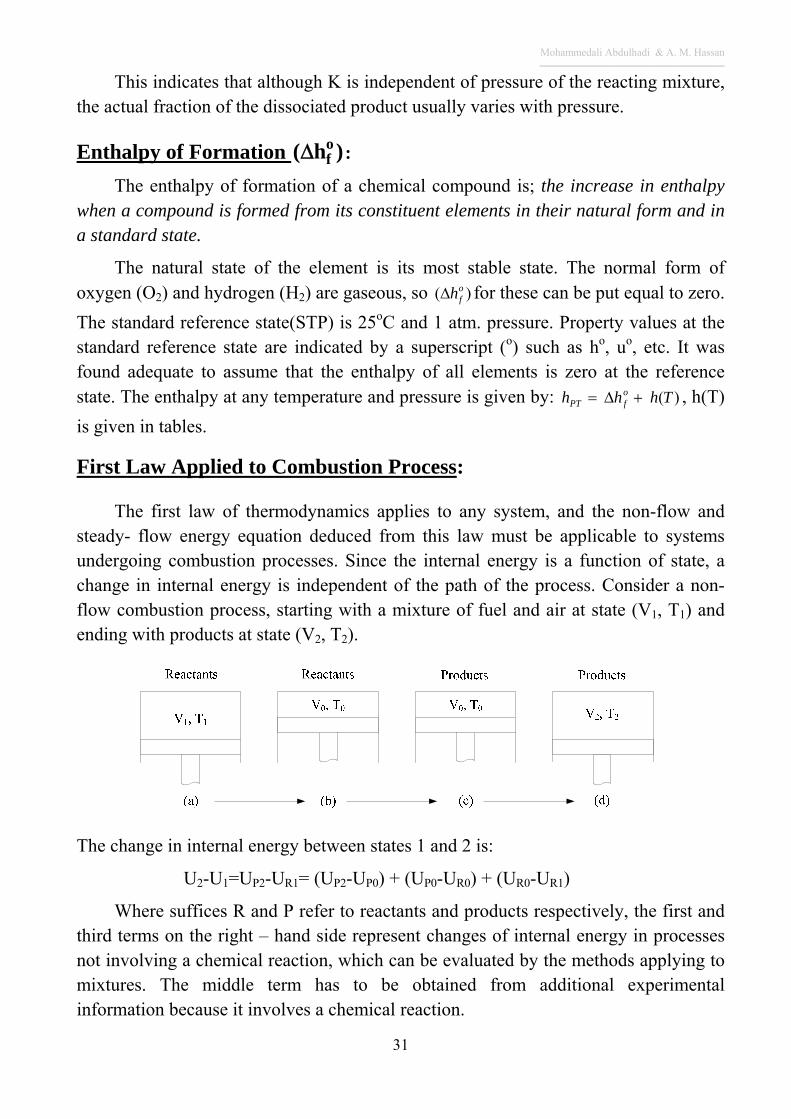
The first law of thermodynamics applies to any system, and the non-flow and steady- flow energy equation deduced from this law must be applicable to systems undergoing combustion processes. Since the internal energy is a function of state, a change in internal energy is independent of the path of the process. Consider a non-flow combustion process, starting with a mixture of fuel and air at state (V1, T1) and ending with products at state (V2, T2).
The change in internal energy between states 1 and 2 is:
U2-U1=UP2-UR1= (UP2-UP0) + (UP0-UR0) + (UR0-UR1)
Where suffices R and P refer to reactants and products respectively, the first and third terms on the right – hand side represent changes of internal energy in processes not involving a chemical reaction, which can be evaluated by the methods applying to mixtures. The middle term has to be obtained from additional experimental information because it involves a chemical reaction.
Mohammedali Abdulhadi & A. M. Hassan ــــــــــــــــــــــــــــــــــــــــــــــــــــــــــــــــــــــــــــــــــــ
32
Because b-c occurs at constant volume, no work is done and the non-flow energy equation becomes:
oooo RPPR UUQ
oo RP UU Can there for be readily obtained by measuring the heat transferred in a
constant – volume calorimetric process.
This term is called the "internal energy of combustion at To", or the constant
volume heat of combustion, and it is symbolized by U0, thus:
Pioii
PoviiPP
RRoPPRP
uumTTcmUU
UUUUUUU
)()(
)()()(
2202
100212
And
Riioi
RoviiRR uumTTcmUU )()( 1110
mi is the mass, and cvi the mean specific heat at constant volume of the constituent i.
Similar analysis can be made for a steady flow or constant pressure combustion process:
)()(100212 RRoPPRP HHHHHHH
Where H0 = enthalpy of combustion at To, or the constant pressure heat of combustion at To and:
oo RPo HHH ,and is always negative.
PioiiPP hhnHH
o)( 22,to a mole basis
Pioii hhm )( 2 ,to a mass basis
Ppiio
Popi cmTTTTcm
i)()( 22
and
RiioiRR hhnHH
o)( 11to a mole basis
R
1iioiRR )hh(mHH1o
to a mass basis
R
pii1oR
1opi cm)TT()TT(cmi
From the definition of the enthalpy of a perfect gas:
Mohammedali Abdulhadi & A. M. Hassan ــــــــــــــــــــــــــــــــــــــــــــــــــــــــــــــــــــــــــــــــــــ
33
H = U+PV = U + nRoT HPo=UPo+nPRoTo and HRo= URo+ nRRoTo
ooRpoo TR)nn(UH
If there is no change in number of moles (n) during the reaction, or if the
reference temperature is absolute zero, thenH0andU0 will be equal.
Example (3 – 3):
Calculate oU in kJ/kg for the combustion of Benzene (C6H6) vapour at 25oC
given that H0= - 3169100 kJ/mole and the H2O is in the vapourphase.
Solution:
Combustion equation is: C6H6+7 1/2 O2 6CO2+3H2O (vap.)
nR = 1+7.5= 8.5, nP = 6+3 = 9
ooRpoo TR)nn(HU
= ̶ 3169100-(1/2) × 8.314 × 298= - 3170339 kJ/mol
On mass basis, 40645)16126(
3170339
oU kJ/kg
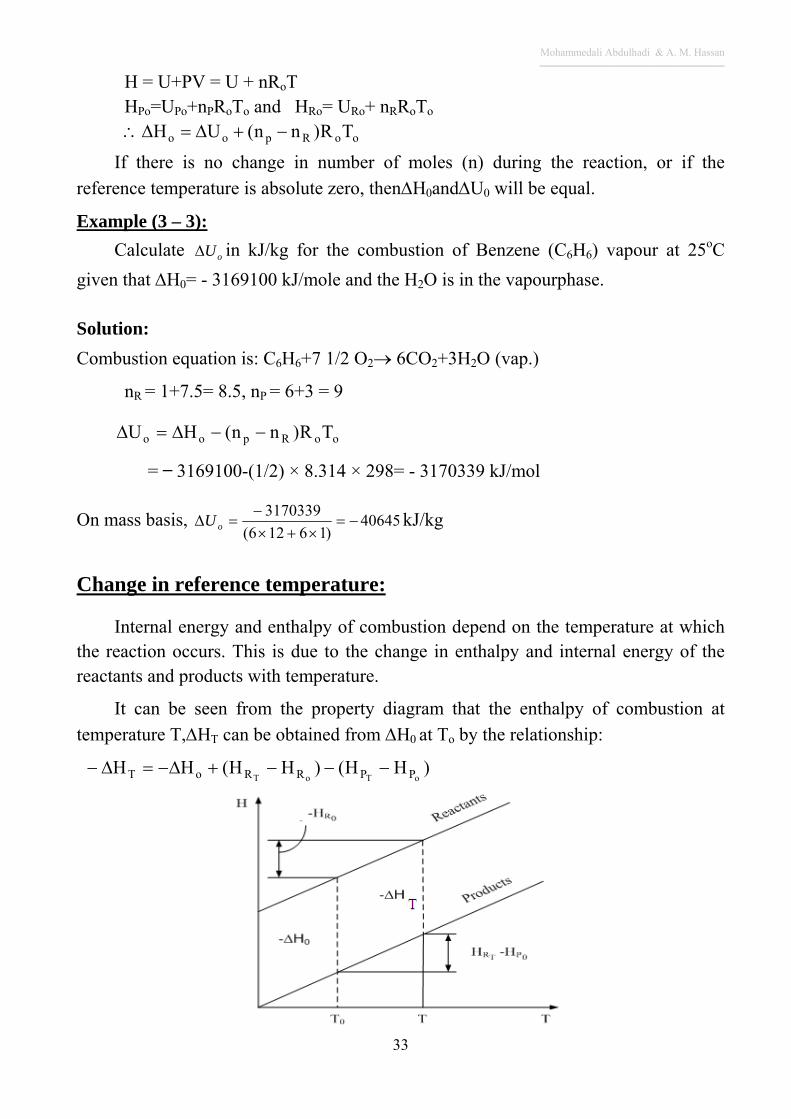
Change in reference temperature:
Internal energy and enthalpy of combustion depend on the temperature at which the reaction occurs. This is due to the change in enthalpy and internal energy of the reactants and products with temperature.
It can be seen from the property diagram that the enthalpy of combustion at
temperature T,HT can be obtained from H0 at To by the relationship:
)HH()HH(HH
oToT PPRRoT
Mohammedali Abdulhadi & A. M. Hassan ــــــــــــــــــــــــــــــــــــــــــــــــــــــــــــــــــــــــــــــــــــ
34
Example (3 – 4):
H0For CO at 60oC is given as -285200 kJ/mole. CalculateHT at 2500oC given the enthalpies of the gases concerned in kJ/mole, are as follows:
Gas 60oC 2500oC
CO 9705 94080 O 9696 99790
CO2 10760 149100
Solution:
kJH
HHHHHH
COOCO
R
PPRRoT oTT
1455396962
197051
)()(2
1
0
0
22
kJ/mole 276282H
kJ 1491001491001H & kJ 10760H
kJ 143975997902
1940801H
T
PP
R
T0
T
Adiabatic flame temperature:
It is the temperature attained in combustion with no heat transfer, no work or changes in kinetic or potential energy; this is the maximum temperature that can be achieved.
For a given fuel and given pressure and temperature of the reactants, the maximum adiabatic flam temperature that can be achieved is with a stoichiometric mixture when complete combustion occurs.
Example (3 – 5):
Liquid heptane (C7H16) has an enthalpy of combustion of -44560 kJ/kg at 25oC, when the water in the products is in the vapour phase. This fuel is to be burnt adiabatically in a steady stream of air in stoichiometric proportion. If the initial temperature of the fuel and air is 15oC, estimate the temperature of the products. The specific heat of liquid heptane is 2.30kJ/kg K.
Solution:
Mohammedali Abdulhadi & A. M. Hassan ــــــــــــــــــــــــــــــــــــــــــــــــــــــــــــــــــــــــــــــــــــ
35
The combustion equation for any hydrocarbon is:
22222 )4
(762.32
)4
(762.3)4
( Nm
nOHm
nCONm
nOm
nHC mn
i.e.
C7H16+11 O2+41.382 N2 7 CO2+8 H2O+41.382 N2
The steady – flow energy equation:
WHQH PR
Since the process of combustion is adiabatic with no work, then:
HR=HP,Q = 0 & W = 0
i.e. 0)HH( 15RPt
t represent products temperature. Expanding this equation we have:
0)HH(H)HH( 15R25R2525PPt
R
NNoOHCiiiRR hhnhhnnhhnHH2222 1525152516715251525
kJ
nCHCp
175871.120583229103.2100
4374.728382.412.4385.731111525167
p
25iit125ppt hhnHH
Assume T=1800 K, as a first estimate
(Hpt – Hp25) = 7 (80530 – 913.8) + 8 (63270 – 840.5) + 41.382 × 49750 – 728.4
= 7 × 79616 + 8 × 6249.5 + 41.382 × 49022
= 3085361.3 kJ
17636.5 – 100 × 44560 + 3085361.3 = -1354040
Assume T=2000 K
(Hpt – Hp25) =7(92610 – 913.8) + 8(73200 – 840.5) + 41.382 × (56920 – 728.4)
= 7 × 91696.2 + 8 × 72360 + 41.382 × 56192
= 3546073 kJ
It is clear the equation will not equal to zero, take t=2500
(Hpt – Hp25) = 7(123335 – 913.8) + 8(98950 – 840.5) + 41.382 × (75280 – 728.4)
= 7 × 122421.4 + 8 × 98110.2 + 41.382 × 74551.6
Mohammedali Abdulhadi & A. M. Hassan ــــــــــــــــــــــــــــــــــــــــــــــــــــــــــــــــــــــــــــــــــــ
36
= 7 × 12242.1 + 8 × 98110.2 + 41.382 × 74551.6
= 4726921.2kJ
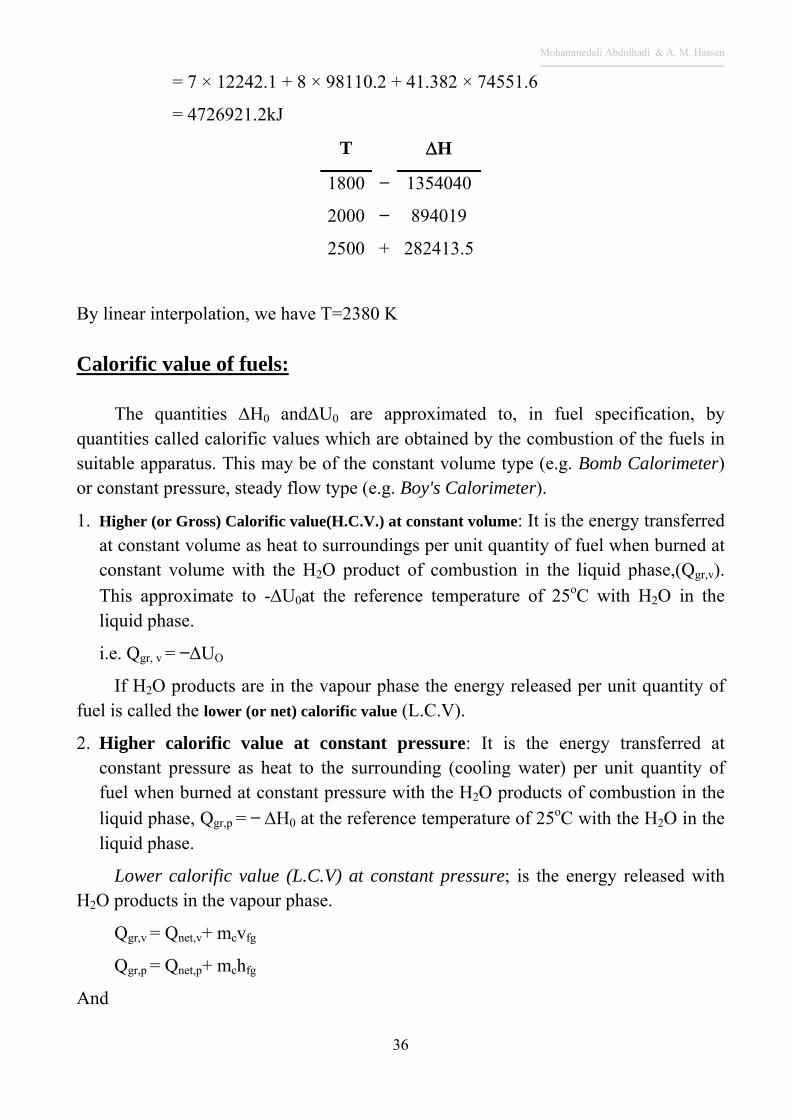
T H
1800 ̶ 1354040
2000 ̶ 894019
2500 + 282413.5
By linear interpolation, we have T=2380 K
Calorific value of fuels:
The quantities H0 andU0 are approximated to, in fuel specification, by quantities called calorific values which are obtained by the combustion of the fuels in suitable apparatus. This may be of the constant volume type (e.g. Bomb Calorimeter) or constant pressure, steady flow type (e.g. Boy's Calorimeter).
1. Higher (or Gross) Calorific value(H.C.V.) at constant volume: It is the energy transferred at constant volume as heat to surroundings per unit quantity of fuel when burned at constant volume with the H2O product of combustion in the liquid phase,(Qgr,v).
This approximate to -U0at the reference temperature of 25oC with H2O in the liquid phase.
i.e. Qgr, v = ̶ ΔUO
If H2O products are in the vapour phase the energy released per unit quantity of fuel is called the lower (or net) calorific value (L.C.V).
2. Higher calorific value at constant pressure: It is the energy transferred at constant pressure as heat to the surrounding (cooling water) per unit quantity of fuel when burned at constant pressure with the H2O products of combustion in the
liquid phase, Qgr,p = ̶ H0 at the reference temperature of 25oC with the H2O in the liquid phase.
Lower calorific value (L.C.V) at constant pressure; is the energy released with H2O products in the vapour phase.
Qgr,v = Qnet,v+ mcvfg
Qgr,p = Qnet,p+ mchfg
And
Mohammedali Abdulhadi & A. M. Hassan ــــــــــــــــــــــــــــــــــــــــــــــــــــــــــــــــــــــــــــــــــــ
37
ufg at 25oC for H2O=2304.4 kJ/kg
hfg at 25oCfor H2O =2441.8 kJ/kg
mc: mass of condensate per unite quantity of fuel.
Example (3 – 6):
The calorific value Qgr,v of kerosene, whose ultimate analysis is 86 per cent carbon and 14 per cent hydrogen, was found by experiment to be 46890 kJ/kg. Calculate the other three calorific values.
Solution:
C7.167 H14+10.667 O27.167 CO2+7 H2O
On mass basis:
100× 1 C7.167 H14 + 32 × 10.667 O2 44 × 7.167 CO2+ 18 × 7 H2O
For one kg of fuel:
1 kg fuel + 3.41 kg O2 3.15 kg CO2 + 1.26 kg H2O
Qnet,v = Qgr,v – mc ufg= 46890 – 1.26 × 2304 = 43987 kJ/kg
The relation between Qgr,v and Qgr,p is identical with that between
-H0 and -U0, i.e.
Qgr,p = Qgr,v + RoTo(nP-nR)
32
41.3
44
15.3298314.846890 , fuel & H2O are liquids
= 46890+87 = 46977 kJ/kg
And
Qnet,p= Qgr,p- mchfg = 46977-1.26 × 2442 = 43900 kJ/kg
Mohammedali Abdulhadi & A. M. Hassan ــــــــــــــــــــــــــــــــــــــــــــــــــــــــــــــــــــــــــــــــــــــــــــــــــــــــــــــــــــــــــــــــــــــــــــــــــــــــــــــــــــــــــــــــــــــــــــــــــــــــــــــــــــــــــــــــــــــــــــــــــــــــــــــــــــــــــــــــــــــــــــــــــــــــ
38
CHAPTER (4)
Fuel Air Cycle
The theoretical cycle based on the actual properties of the cylinder contents is called the fuel – air cycle. The fuel – air cycle take into consideration the following: 1- The actual composition of the cylinder contents. 2- The variation in the specific heat of the gases in the cylinder. 3- The dissociation effect. 4- The variation in the number of moles present in the cylinder as the pressure and
temperature change. 5- No chemical changes in either fuel or air prior to combustion. 6- Combustion takes place instantaneously at top dead center. 7- All processes are adiabatic. 8- The fuel is mixed well with air.
Variation of specific heats:
All gases, except mono-atomic gases, show an increase in specific heat as temperature increase. The specific heat may be written in the form:
C = a+bT+cT2 where T is the absolute temperature and a, b and c are constants for any specific gas.
Cp and Cv increase with temperature but vc
cp decrease as the temperature increase.
There are special tables and charts which gives the specific heat of different gases at different temperatures. Specific heats of a mixture of gases can be calculated if the constituents of the mixture are known, using the gas mixture relations.
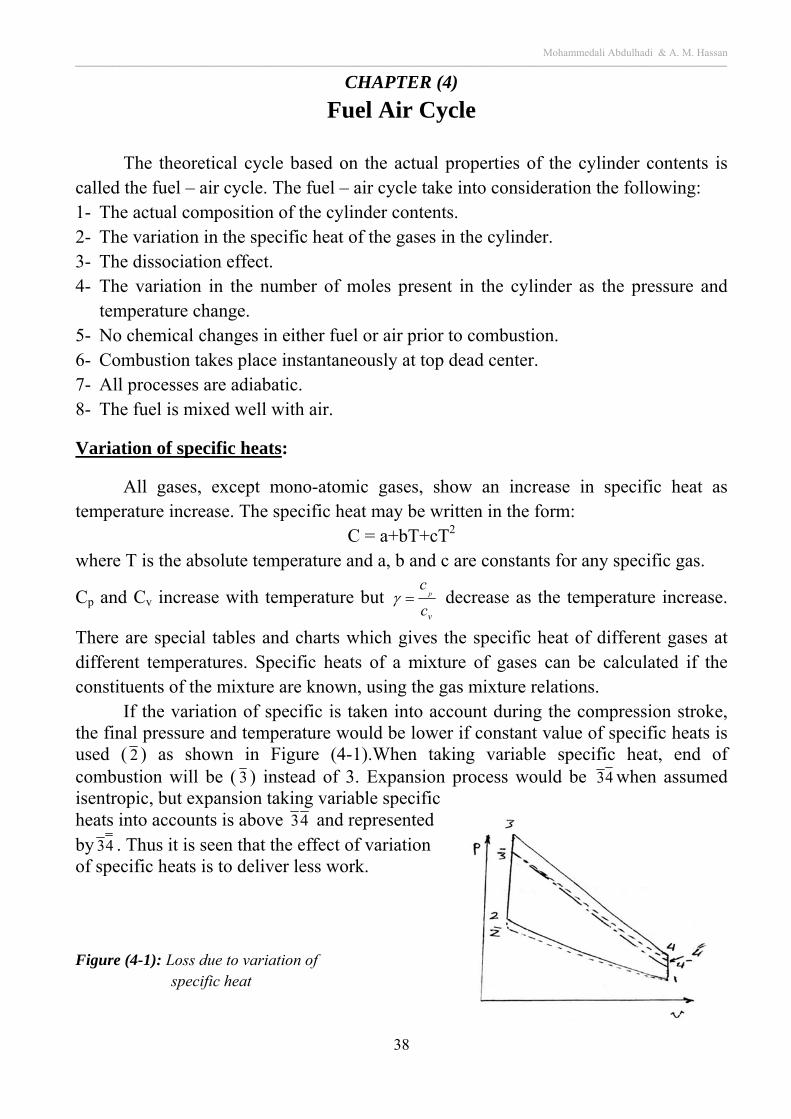
If the variation of specific is taken into account during the compression stroke, the final pressure and temperature would be lower if constant value of specific heats is used ( 2 ) as shown in Figure (4-1).When taking variable specific heat, end of combustion will be ( 3 ) instead of 3. Expansion process would be 43 when assumed isentropic, but expansion taking variable specific heats into accounts is above 43 and represented by 43 . Thus it is seen that the effect of variation of specific heats is to deliver less work. Figure (4-1): Loss due to variation of specific heat
Mohammedali Abdulhadi & A. M. Hassan ــــــــــــــــــــــــــــــــــــــــــــــــــــــــــــــــــــــــــــــــــــــــــــــــــــــــــــــــــــــــــــــــــــــــــــــــــــــــــــــــــــــــــــــــــــــــــــــــــــــــــــــــــــــــــــــــــــــــــــــــــــــــــــــــــــــــــــــــــــــــــــــــــــــــ
39
v
vP
otto
C
R
RCCr
1
11
1
Dissociation effect:
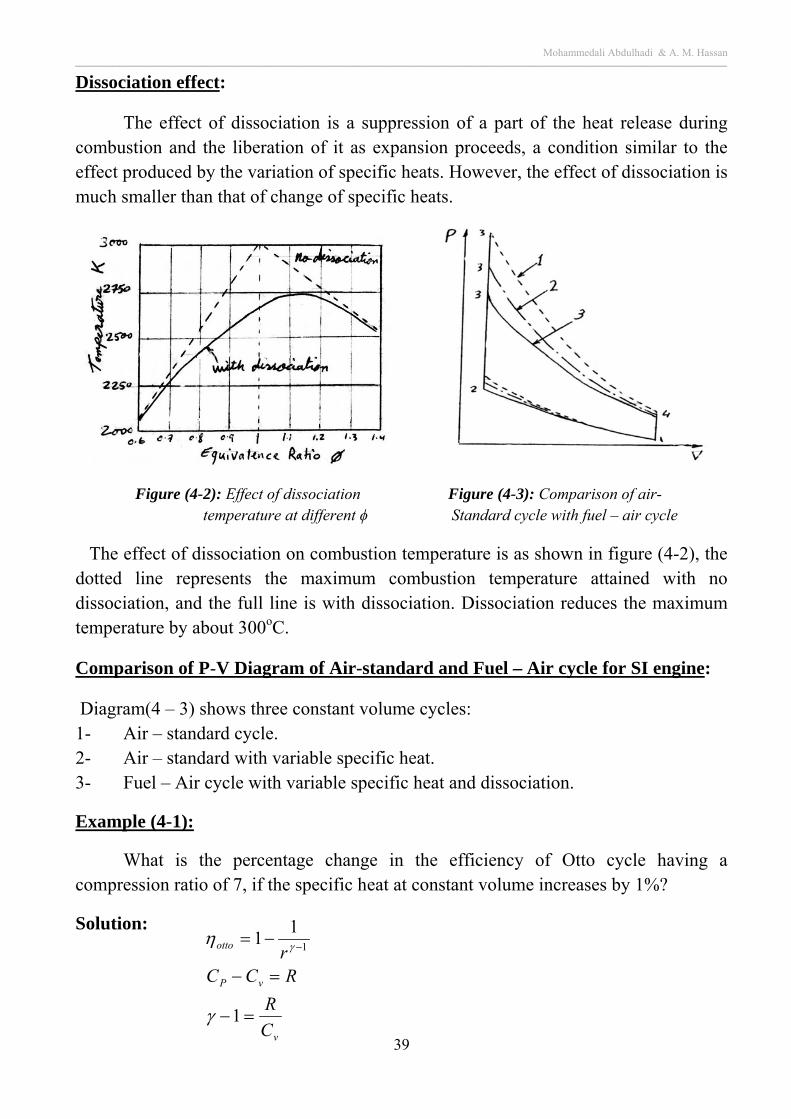
The effect of dissociation is a suppression of a part of the heat release during combustion and the liberation of it as expansion proceeds, a condition similar to the effect produced by the variation of specific heats. However, the effect of dissociation is much smaller than that of change of specific heats.
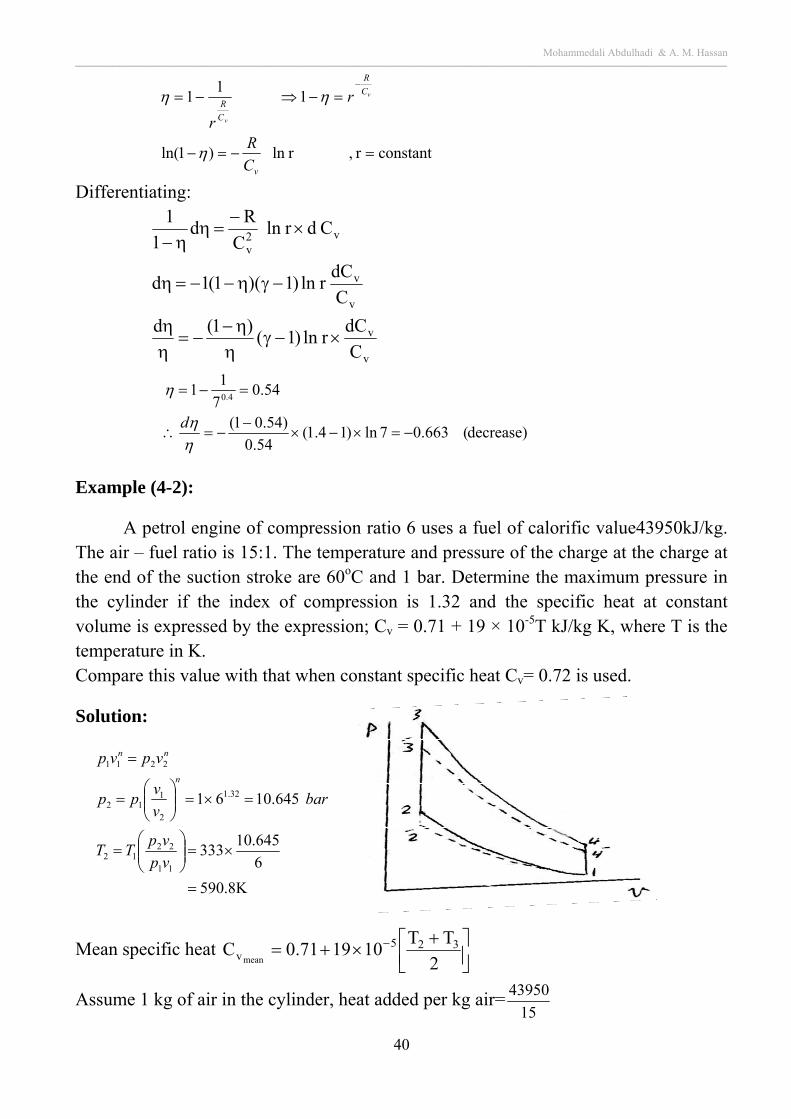
Figure (4-2): Effect of dissociation Figure (4-3): Comparison of air- temperature at different ϕ Standard cycle with fuel – air cycle
The effect of dissociation on combustion temperature is as shown in figure (4-2), the dotted line represents the maximum combustion temperature attained with no dissociation, and the full line is with dissociation. Dissociation reduces the maximum temperature by about 300oC.
Comparison of P-V Diagram of Air-standard and Fuel – Air cycle for SI engine:
Diagram(4 – 3) shows three constant volume cycles: 1- Air – standard cycle. 2- Air – standard with variable specific heat. 3- Fuel – Air cycle with variable specific heat and dissociation.
Example (4-1):
What is the percentage change in the efficiency of Otto cycle having a compression ratio of 7, if the specific heat at constant volume increases by 1%?
Solution:
Mohammedali Abdulhadi & A. M. Hassan ــــــــــــــــــــــــــــــــــــــــــــــــــــــــــــــــــــــــــــــــــــــــــــــــــــــــــــــــــــــــــــــــــــــــــــــــــــــــــــــــــــــــــــــــــــــــــــــــــــــــــــــــــــــــــــــــــــــــــــــــــــــــــــــــــــــــــــــــــــــــــــــــــــــــ
40
constantr , r ln )1ln(
11
1
v
C
R
C
R
C
R
r
r
v
v
Differentiating:
v
v
v
v
v2v
C
dCr ln)1(
)1(d
C
dCr ln)1)(1(1d
C dr ln C
Rd
1
1
decrease)( 663.07ln)14.1(
54.0
)54.01(
54.07
11
4.0
d
Example (4-2):
A petrol engine of compression ratio 6 uses a fuel of calorific value43950kJ/kg. The air – fuel ratio is 15:1. The temperature and pressure of the charge at the charge at the end of the suction stroke are 60oC and 1 bar. Determine the maximum pressure in the cylinder if the index of compression is 1.32 and the specific heat at constant volume is expressed by the expression; Cv = 0.71 + 19 × 10-5T kJ/kg K, where T is the temperature in K. Compare this value with that when constant specific heat Cv= 0.72 is used.
Solution:
K8.590
6
645.10333
645.1061
11
2212
32.1
2
112
2211
vp
vpTT
barv
vpp
vpvpn
nn
Mean specific heat
2
TT101971.0C 325
vmean
Assume 1 kg of air in the cylinder, heat added per kg air=15
43950
Mohammedali Abdulhadi & A. M. Hassan ــــــــــــــــــــــــــــــــــــــــــــــــــــــــــــــــــــــــــــــــــــــــــــــــــــــــــــــــــــــــــــــــــــــــــــــــــــــــــــــــــــــــــــــــــــــــــــــــــــــــــــــــــــــــــــــــــــــــــــــــــــــــــــــــــــــــــــــــــــــــــــــــــــــــ
41
Q = Cv × mass of charge ×(T3-T2)
2930= [0.71+19 × 10-5 (T3+590.8)/2] ×15
16 ×(T3-590.8)
Solving we get T3=3090 K
P3 = P2 2
3
T
T
= 10.645×
590
3090 = 55.75bar
For constant specific heat, 2930=0.72 ×15
16 (T3- 590)
Solving we get T3=4405 K
P3=10.645 ×590
4405 = 79.5 bar
Example (3 - 3):
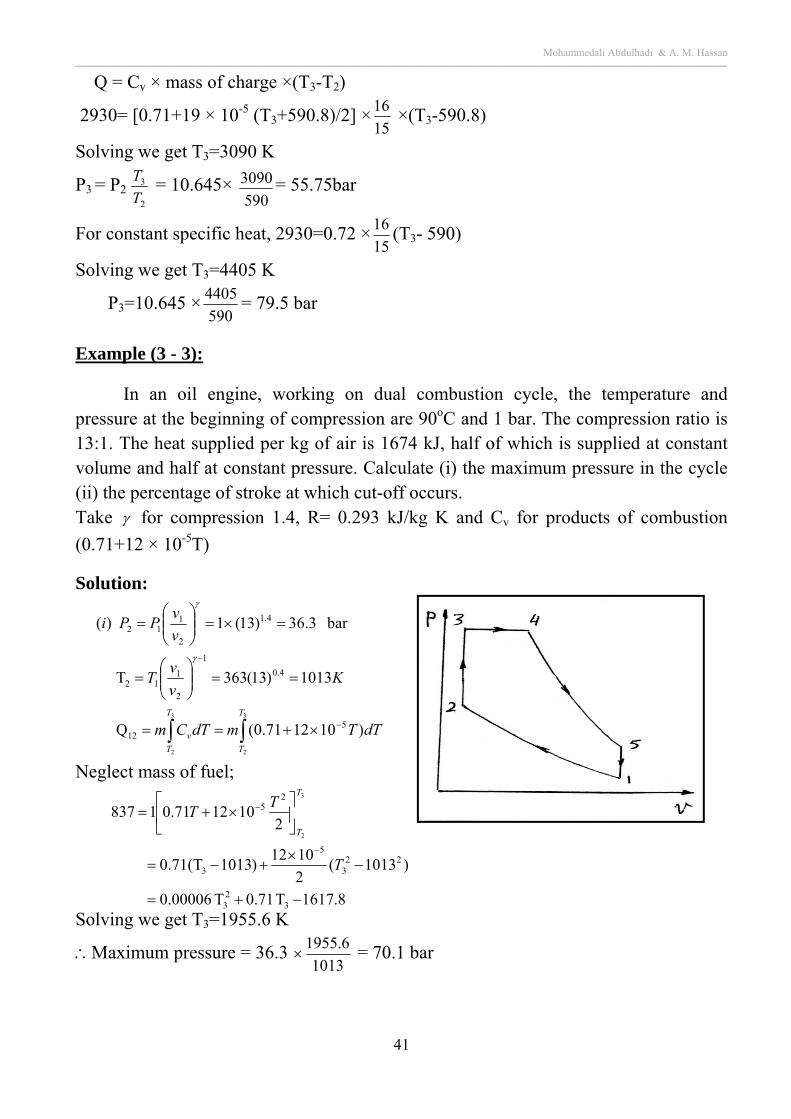
In an oil engine, working on dual combustion cycle, the temperature and pressure at the beginning of compression are 90oC and 1 bar. The compression ratio is 13:1. The heat supplied per kg of air is 1674 kJ, half of which is supplied at constant volume and half at constant pressure. Calculate (i) the maximum pressure in the cycle (ii) the percentage of stroke at which cut-off occurs. Take for compression 1.4, R= 0.293 kJ/kg K and Cv for products of combustion
(0.71+12 × 10-5T)
Solution:
3
2
3
2
)101271.0(Q
1013)13(363T
bar 3.36)13(1 )(
512
4.0
1
2
112
4.1
2
112
T
T
T
T
v dTTmdTCm
Kv
vT
v
vPPi
Neglect mass of fuel; Solving we get T3=1955.6 K
Maximum pressure = 36.3 1013
6.1955
= 70.1 bar
8.1617T 71.0T 0.00006
)1013(2
1012)10130.71(T
2101271.01837
323
223
5
3
25
3
2
T
TT
T
T
Mohammedali Abdulhadi & A. M. Hassan ــــــــــــــــــــــــــــــــــــــــــــــــــــــــــــــــــــــــــــــــــــــــــــــــــــــــــــــــــــــــــــــــــــــــــــــــــــــــــــــــــــــــــــــــــــــــــــــــــــــــــــــــــــــــــــــــــــــــــــــــــــــــــــــــــــــــــــــــــــــــــــــــــــــــ
42
03865T 003.1T 0.00006
3028T 00006.0T 1.003
)6.1955(00006.0)18641.003(T837
21012 T 1.0031837
)1012003.1(Q
1012003.1C )(
424
244
2244
1864
25-
534
5p
4
4
3
4
3
T
T
dTTmdTCm
TRCii
T
T
T
T
T
p
v
Solving we get, T4=2611 K
335.16.1955
2611
3
4
3
4 T
T
v
v
Cut – off = 13v
v ,
2
134 vv
% of stroke at which cut off occurs = 21
34
vv
vv
%793.2
v12
)1335.1(
v13
v335.1
2
2
22
33
v
v
v , ( V3 = V2 )
Example ( 3 – 4 ): A mixture of Heptane ( C7H16 ) and air which is 10% rich is initially at a pressure
of 1 atm. and a temperature of 100oC, is compressed through a volumetric ratio of 6:1. It is then ignited and adiabatic combustion proceeds at constant volume. The maximum temperature reached is 2627oC and at this temperature the equilibrium constants are;
. 6.72
.0.054 .
If the constituent of the product gases are; CO2, CO, H2O, H2, O2 and N2, show that approximately 30.2% of the carbon has burned incompletely. Pressures are measured in atmospheres.
Solution:
The stoichiometric combustion equation for a hydrocarbon fuel is:
CnHm + ( n + m/4 ) O2 + 3.762 N2 → n CO2 + (m/2) H2O + ( n + m/4 ) 3.762 N2
C7H16 + 11( O2 + 3.762 N2 ) → 7 CO2 + 8 H2O + 41.36 N2
Actual combustion equation includes CO and H2 in the products also;
So; actual combustion equation may be written in the form:
Mohammedali Abdulhadi & A. M. Hassan ــــــــــــــــــــــــــــــــــــــــــــــــــــــــــــــــــــــــــــــــــــــــــــــــــــــــــــــــــــــــــــــــــــــــــــــــــــــــــــــــــــــــــــــــــــــــــــــــــــــــــــــــــــــــــــــــــــــــــــــــــــــــــــــــــــــــــــــــــــــــــــــــــــــــ
43
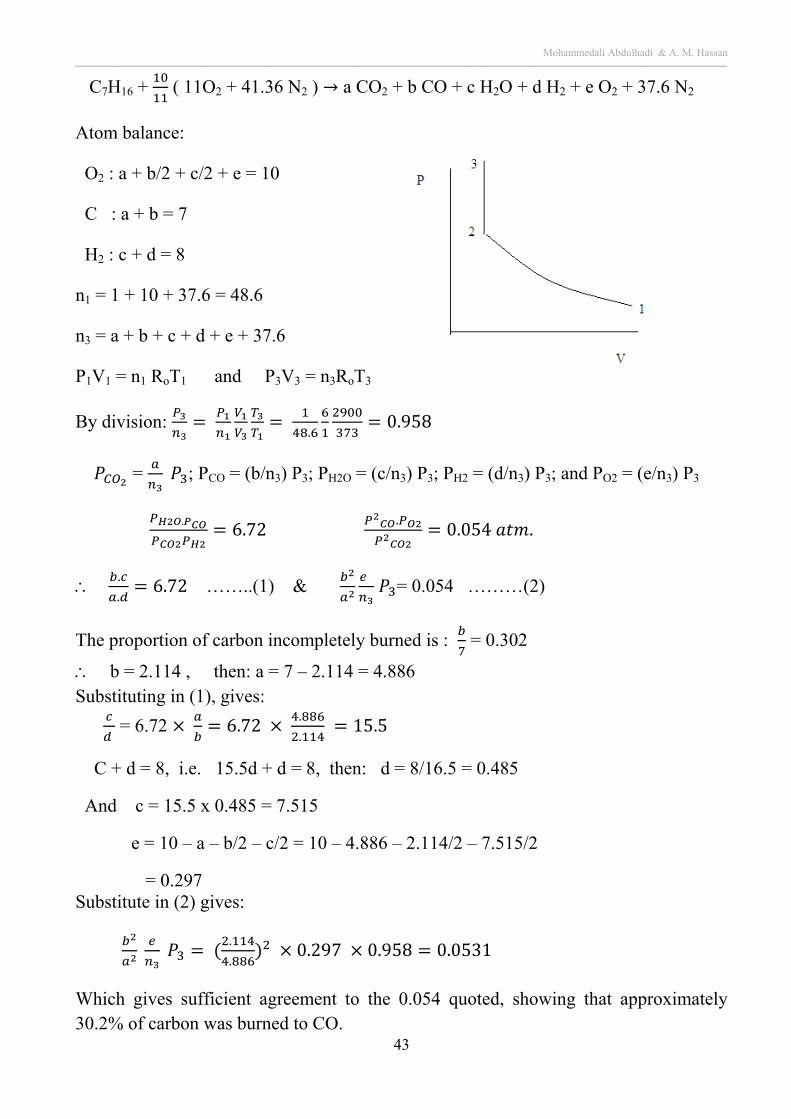
C7H16 + ( 11O2 + 41.36 N2 ) a CO2 + b CO + c H2O + d H2 + e O2 + 37.6 N2
Atom balance:
O2 : a + b/2 + c/2 + e = 10
C : a + b = 7
H2 : c + d = 8
n1 = 1 + 10 + 37.6 = 48.6
n3 = a + b + c + d + e + 37.6
P1V1 = n1 RoT1 and P3V3 = n3RoT3
By division: .
0.958
= ; PCO = (b/n3) P3; PH2O = (c/n3) P3; PH2 = (d/n3) P3; and PO2 = (e/n3) P3
. 6.72
.0.054 .
.
.6.72 ……..(1) &
= 0.054 ………(2)
The proportion of carbon incompletely burned is : = 0.302
b = 2.114 , then: a = 7 – 2.114 = 4.886 Substituting in (1), gives:
= 6.72 6.72
.
. 15.5
C + d = 8, i.e. 15.5d + d = 8, then: d = 8/16.5 = 0.485
And c = 15.5 x 0.485 = 7.515
e = 10 – a – b/2 – c/2 = 10 – 4.886 – 2.114/2 – 7.515/2
= 0.297 Substitute in (2) gives:
.
. 0.297 0.958 0.0531
Which gives sufficient agreement to the 0.054 quoted, showing that approximately 30.2% of carbon was burned to CO.
Mohammedali Abdulhadi & A. M. Hassan ــــــــــــــــــــــــــــــــــــــــــــــــــــــــــــــــــــــــــــــــــــــــــــــــــــــــــــــــــــــــــــــــــــــــــــــــــــــــــــــــــــــــــــــــــــــــــــــــــــــــــــــــــــــــــــــــــــــــــــــــــــــــــــــــــــــــــــــــــــــــــــــــــــــــ
44
CHAPTER (5)
The Actual Cycle The actual cycle experienced by internal combustion engines is an open cycle with
changing composition, actual cycle efficiency is much lower than the air standard efficiency due to various losses occurring in the actual engine. These losses are as follows:
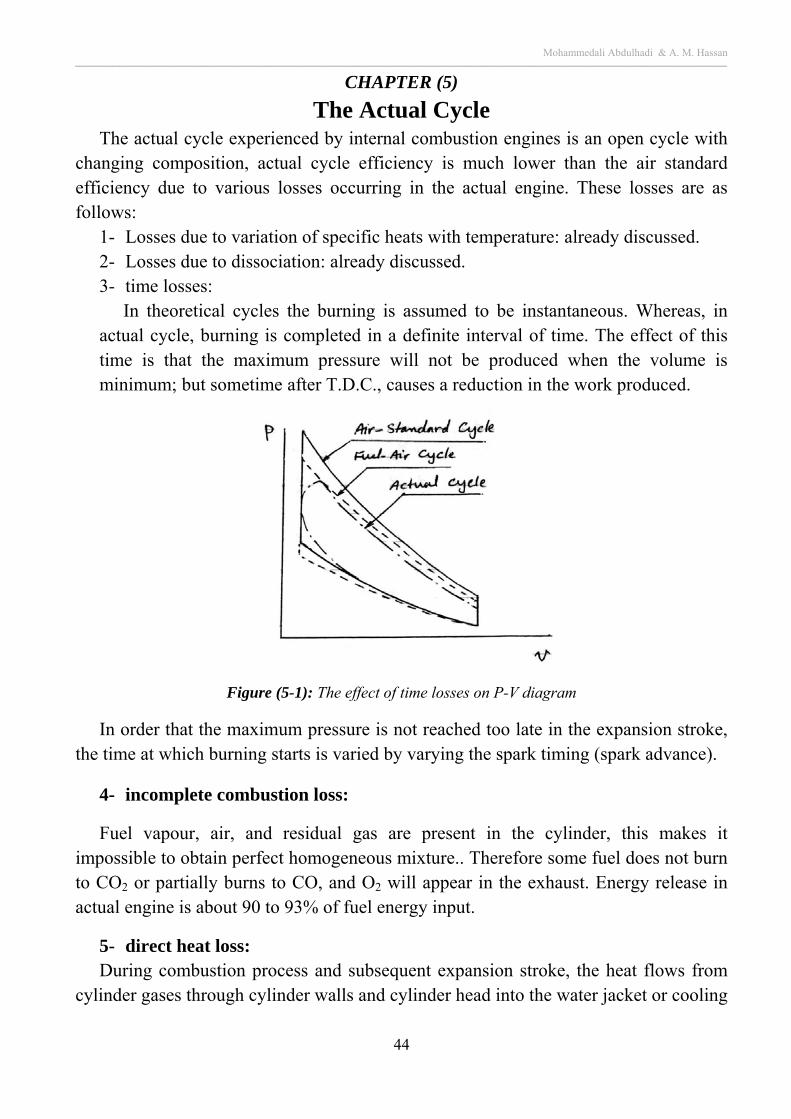
1- Losses due to variation of specific heats with temperature: already discussed. 2- Losses due to dissociation: already discussed. 3- time losses:
In theoretical cycles the burning is assumed to be instantaneous. Whereas, in actual cycle, burning is completed in a definite interval of time. The effect of this time is that the maximum pressure will not be produced when the volume is minimum; but sometime after T.D.C., causes a reduction in the work produced.
Figure (5-1): The effect of time losses on P-V diagram
In order that the maximum pressure is not reached too late in the expansion stroke, the time at which burning starts is varied by varying the spark timing (spark advance).
4- incomplete combustion loss:
Fuel vapour, air, and residual gas are present in the cylinder, this makes it impossible to obtain perfect homogeneous mixture.. Therefore some fuel does not burn to CO2 or partially burns to CO, and O2 will appear in the exhaust. Energy release in actual engine is about 90 to 93% of fuel energy input.
5- direct heat loss: During combustion process and subsequent expansion stroke, the heat flows from
cylinder gases through cylinder walls and cylinder head into the water jacket or cooling
Mohammedali Abdulhadi & A. M. Hassan ــــــــــــــــــــــــــــــــــــــــــــــــــــــــــــــــــــــــــــــــــــــــــــــــــــــــــــــــــــــــــــــــــــــــــــــــــــــــــــــــــــــــــــــــــــــــــــــــــــــــــــــــــــــــــــــــــــــــــــــــــــــــــــــــــــــــــــــــــــــــــــــــــــــــ
45
fins. Some heat enters the piston head and flows through piston rings into the walls of the cylinder or carried away by the engine oil.
The heat loss during combustion and expansion does not represent a complete heat loss; a part of the heat loss would be rejected in the exhaust at the end of the expansion stroke.
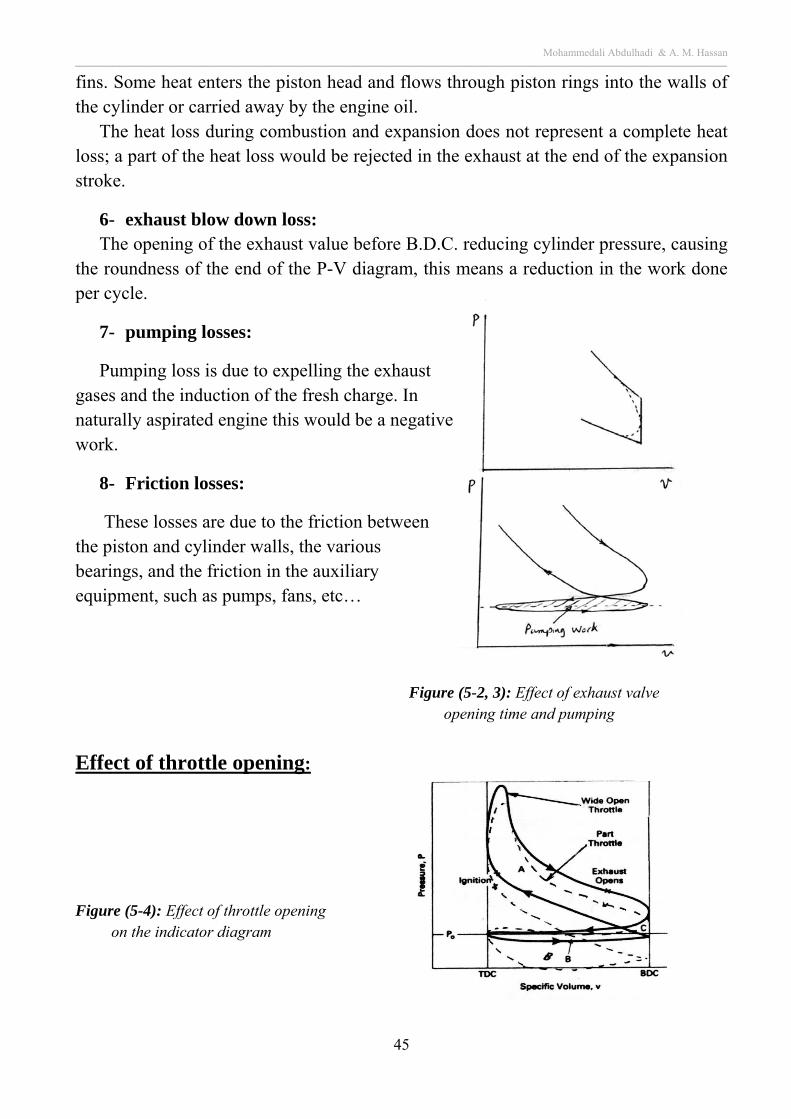
6- exhaust blow down loss: The opening of the exhaust value before B.D.C. reducing cylinder pressure, causing
the roundness of the end of the P-V diagram, this means a reduction in the work done per cycle.
7- pumping losses:
Pumping loss is due to expelling the exhaust gases and the induction of the fresh charge. In naturally aspirated engine this would be a negative work.
8- Friction losses:
These losses are due to the friction between the piston and cylinder walls, the various bearings, and the friction in the auxiliary equipment, such as pumps, fans, etc…
Figure (5-2, 3): Effect of exhaust valve opening time and pumping
Effect of throttle opening:
Figure (5-4): Effect of throttle opening on the indicator diagram
Mohammedali Abdulhadi & A. M. Hassan ــــــــــــــــــــــــــــــــــــــــــــــــــــــــــــــــــــــــــــــــــــــــــــــــــــــــــــــــــــــــــــــــــــــــــــــــــــــــــــــــــــــــــــــــــــــــــــــــــــــــــــــــــــــــــــــــــــــــــــــــــــــــــــــــــــــــــــــــــــــــــــــــــــــــ
46
When a four- stroke SI engine is run at partially closed throttle, (throttle is a butterfly valve in the intake system), fuel supplied to the engine is reduced, and this would lead to less power output at part throttle opening as shown in figure (5-4). The upper loop represent positive work output (A) while the lower loop consisting of the exhaust and intake strokes is negative work (B). The more closed the throttle position, the lower will be the pressure during the intake stroke and the greater the negative pumping work.
Effect of spark timing:
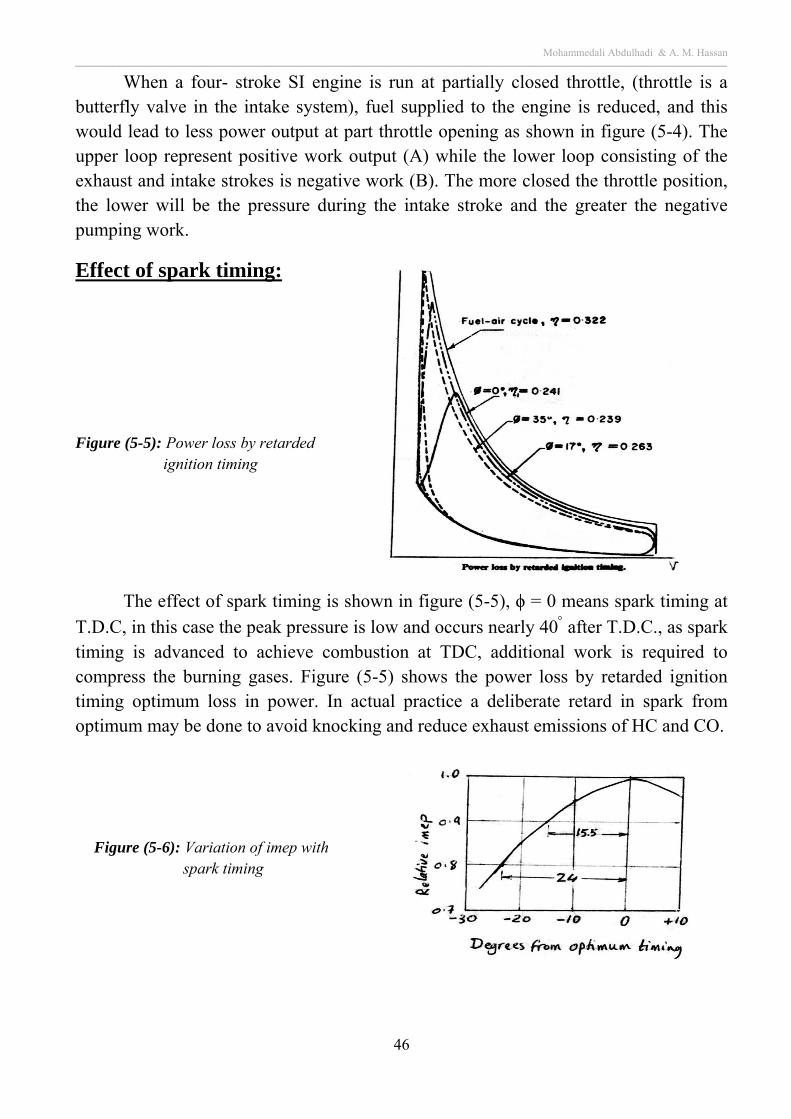
Figure (5-5): Power loss by retarded ignition timing
The effect of spark timing is shown in figure (5-5), ϕ = 0 means spark timing at
T.D.C, in this case the peak pressure is low and occurs nearly 40 after T.D.C., as spark timing is advanced to achieve combustion at TDC, additional work is required to compress the burning gases. Figure (5-5) shows the power loss by retarded ignition timing optimum loss in power. In actual practice a deliberate retard in spark from optimum may be done to avoid knocking and reduce exhaust emissions of HC and CO.
Figure (5-6): Variation of imep with spark timing
Mohammedali Abdulhadi & A. M. Hassan ــــــــــــــــــــــــــــــــــــــــــــــــــــــــــــــــــــــــــــــــــــــــــــــــــــــــــــــــــــــــــــــــــــــــــــــــــــــــــــــــــــــــــــــــــــــــــــــــــــــــــــــــــــــــــــــــــــــــــــــــــــــــــــــــــــــــــــــــــــــــــــــــــــــــ
47
CHAPTER (6)
ENGINE PERFORMANCE
The basic performance parameters of internal combustion engine (I.C.E) may be summarized as follows:
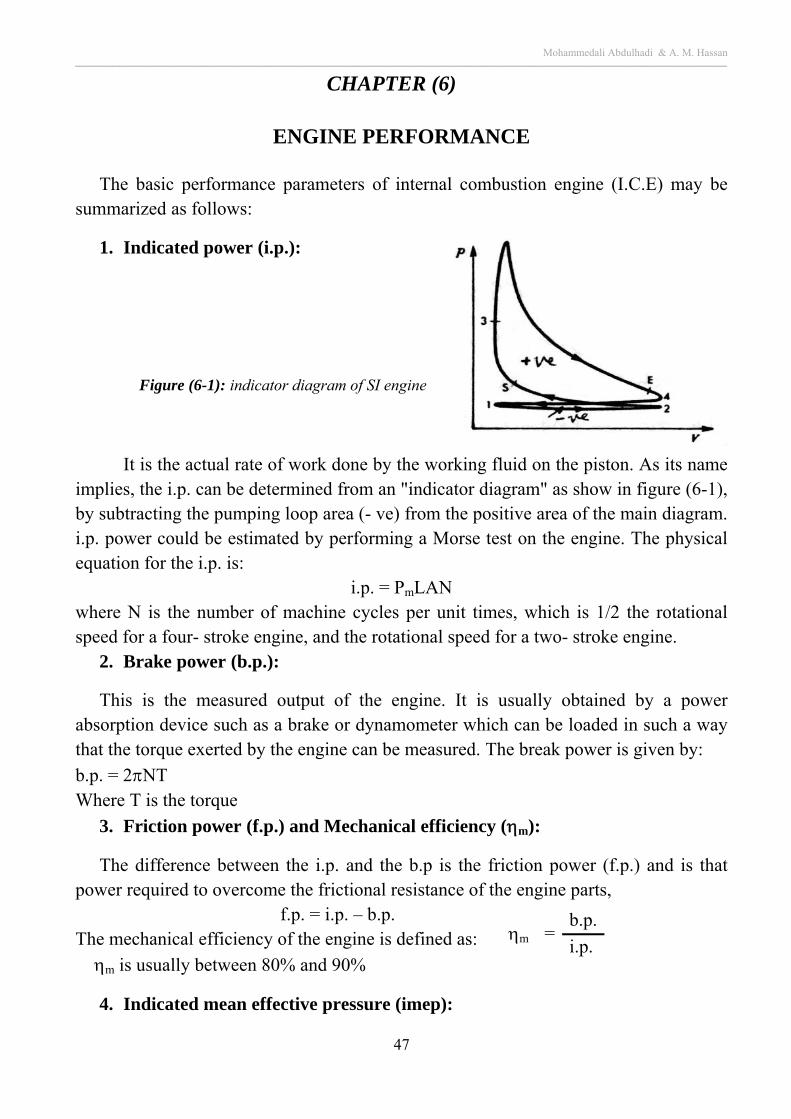
1. Indicated power (i.p.):
Figure (6-1): indicator diagram of SI engine
It is the actual rate of work done by the working fluid on the piston. As its name implies, the i.p. can be determined from an "indicator diagram" as show in figure (6-1), by subtracting the pumping loop area (- ve) from the positive area of the main diagram. i.p. power could be estimated by performing a Morse test on the engine. The physical equation for the i.p. is:
i.p. = PmLAN where N is the number of machine cycles per unit times, which is 1/2 the rotational speed for a four- stroke engine, and the rotational speed for a two- stroke engine.
2. Brake power (b.p.):
This is the measured output of the engine. It is usually obtained by a power absorption device such as a brake or dynamometer which can be loaded in such a way that the torque exerted by the engine can be measured. The break power is given by:
b.p. = 2NT Where T is the torque
3. Friction power (f.p.) and Mechanical efficiency (m):
The difference between the i.p. and the b.p is the friction power (f.p.) and is that power required to overcome the frictional resistance of the engine parts, f.p. = i.p. – b.p. The mechanical efficiency of the engine is defined as:
m is usually between 80% and 90%
4. Indicated mean effective pressure (imep):
m =b.p.
i.p.
Mohammedali Abdulhadi & A. M. Hassan ــــــــــــــــــــــــــــــــــــــــــــــــــــــــــــــــــــــــــــــــــــــــــــــــــــــــــــــــــــــــــــــــــــــــــــــــــــــــــــــــــــــــــــــــــــــــــــــــــــــــــــــــــــــــــــــــــــــــــــــــــــــــــــــــــــــــــــــــــــــــــــــــــــــــ
48
It is a hypothetical pressure which if acting on the engine piston during the working stroke would results in the indicated work of the engine. This means it is the height of a rectangle having the same length and area as the cycle plotted on a p- v diagram.
Consider one engine cylinder: Work done per cycle = Pi AL
where: A = area of piston; L = length of stroke
Work done per min. = work done per cycle active cycles per min.
i.p. = Pi AL active cycles/ min To obtain the total power of the engine this should be multiplied by the number
of cylinder n, i.e.: Total i.p. = Pi AL Nn/2 for four- stroke engine
and = PiALNn for Two- stroke engine
5. Brake mean effective pressure (bmep) and brake thermal efficiency:
The bmep (Pb) may be thought of as that mean effective pressure acting on the pistons which would give the measured b.p., i.e.
b.p. = Pb AL active cycles/ min
The overall efficiency of the engine is given by the brake thermal efficiency, BT i.e.
BT = Brake power
Energy supplied
netfBT Qm
pb
..
where fm is the mass of fuel consumed per unit time, and Qnet is the lower calorific
value of the fuel. 6. Specific fuel consumption (s.f.c.): It is the mass of fuel consumed per unit power output per hour, and is a criterion of
economic power production.
Low values of s.f.c are obviously desired. Typical best values of bsfc for SI engines are about 270g/kW.h, and for C.I. engines are about 200g/kW.h.
7. Indicated thermal efficiency (IT):
It is defined in a similar way to BT
imep (Pi) = Net area of the indicator diagram
Indicator scale Swept volume
kWhkgpb
msfc f
..
Mohammedali Abdulhadi & A. M. Hassan ــــــــــــــــــــــــــــــــــــــــــــــــــــــــــــــــــــــــــــــــــــــــــــــــــــــــــــــــــــــــــــــــــــــــــــــــــــــــــــــــــــــــــــــــــــــــــــــــــــــــــــــــــــــــــــــــــــــــــــــــــــــــــــــــــــــــــــــــــــــــــــــــــــــــ
49
netfIT Qm
pi
..
Dividing BT by IT gives
BT =
b.p.= m
IT i.p.
BT = mIT
8. Volumetric efficiency (v): Volumetric efficiency is only used with four- stroke cycle engines. It is defined as
the ratio of the volume if air induced, measured at the free air conditions, to the swept volume of the cylinder:
sv v
v
The air volume V may be refereed to N.T.P. to give a standard comparison.
The volumetric efficiency of an engine is affected by many variables such as compression ratio, valve timing, induction and port design, mixture strength, latent heat of evaporation of the fuel, heating of the induced charge, cylinder pressure, and the atmospheric conditions.
Example 6-1: The peak pressure of a SI engine rotating at 1500 rpm occurs 0.003S after the
spark, what will be the spark timing when peak pressure is at TDC. If the inlet valve opens at 10 degrees bTDC and closes at 45 degrees aBDC, how long the inlet valve opening period is in seconds.
Solution:
Number of revolutions per second 2560
1500 rev.
Number of revolutions between spark timing and TDC = 25 0.003 = 0.075 rev.
Crank shaft angle during this period = 0.075 360 = 27 i.e. spark must occurs 27 degree bTDC inlet valve opening = 10 + 180 + 45 = 235 degrees
inlet valve opening time in seconds 0265.025360
235
.
Example 6-2:
In a four stroke single cylinder gas engine the indicated mean effective pressure
is 0.46 MN/m2, the brake power 9 kW, speed 250 rpm, mechanical efficiency, m = 0.8, and bore to stroke ratio = 0.66. Calculate cylinder diameter and mean piston speed.
Mohammedali Abdulhadi & A. M. Hassan ــــــــــــــــــــــــــــــــــــــــــــــــــــــــــــــــــــــــــــــــــــــــــــــــــــــــــــــــــــــــــــــــــــــــــــــــــــــــــــــــــــــــــــــــــــــــــــــــــــــــــــــــــــــــــــــــــــــــــــــــــــــــــــــــــــــــــــــــــــــــــــــــــــــــ
50
Solution:
0.66
dL , 66.0
m 01174.01250100046.0
25.112.22
Pi.p
kw 25.110.8
9i.p ,
.
3
i
L
d
NnP
piLA
LANn
pi
bp
i
m
m 0.2145 d
009866.0d
01174.0466.0
3
2
dd
Mean piston speed = m/s 71.26066.0
2502145.02
60
2
LN
Example 6-3:
A four stroke petrol engine delivers 35.75kW with a mechanical efficiency of 80%, the fuel consumption of the engine is 0.4 kg per brake power hour, and the A/F ratio is 14:1.The heating value of the fuel is 41870 kJ/kg. Find: (a) i.p, (b) f.p., (c) BT ,
(d) IT , (e) fuel consumption per hour, (f) air consumption per hour.
Solution:
a) kW 7.440.8
35.75i.p ,
.
.
pi
pbm
b) f.p= i.p – b.p=44.7– 35.75=8.95kW
c) 215.04187075.354.0
360075.35.
added
BT Q
pb
d) mITBT
2687.0
8.0
215.0IT
e) fuel consumption per hour = 0.4 35.75=14.32kg f) air consumption per hour = 14.32 14=200.5kg Example 6-4:
The air flow to a four cylinder four – stroke engine is 2.15 m3/min. During a test on the engine the following data were recorded: Bore 10.5cm; stroke 12.5cm; engine speed 1200 rpm, torque 150 N.m, fuel consumption 5.5 kg/h, calorific value of fuel, 43124 kJ/kg, ambient temperature and pressure are 20oC and 1.03 bars. Calculate:
Mohammedali Abdulhadi & A. M. Hassan ــــــــــــــــــــــــــــــــــــــــــــــــــــــــــــــــــــــــــــــــــــــــــــــــــــــــــــــــــــــــــــــــــــــــــــــــــــــــــــــــــــــــــــــــــــــــــــــــــــــــــــــــــــــــــــــــــــــــــــــــــــــــــــــــــــــــــــــــــــــــــــــــــــــــ
51
1- The brake thermal efficiency. 2- The brakes mean effective pressure. 3- The volumetric efficiency.
Solution:
1- kW 85.18100060
15012002
60
2..
NT
pb
286.0
431245.5
360085.18.
added
BT Q
pb
2-2
. ni LANPpb
kPa 4.435
41200)105.0(125.0
60485.1822
iP
3-s
v V
V
min/m 6.2
2
41200)105.0(
4125.0
2
NnLAV 32
s
83.0
6.2
15.2 v
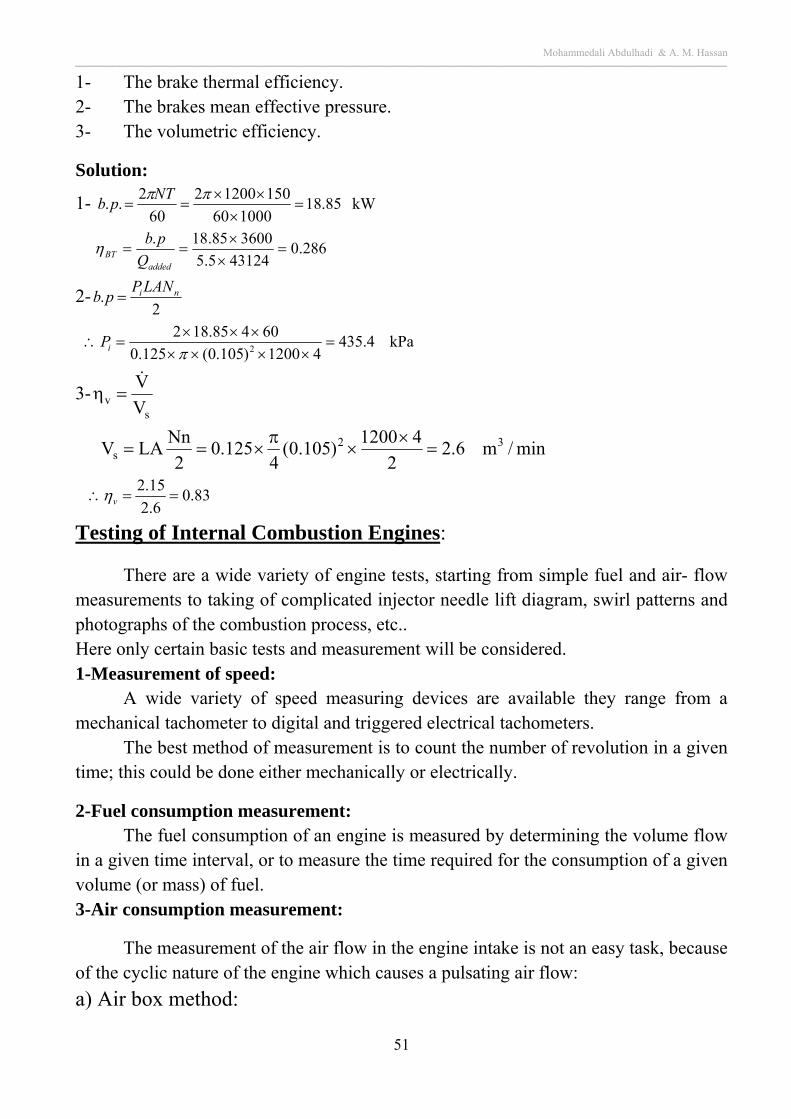
Testing of Internal Combustion Engines:
There are a wide variety of engine tests, starting from simple fuel and air- flow measurements to taking of complicated injector needle lift diagram, swirl patterns and photographs of the combustion process, etc.. Here only certain basic tests and measurement will be considered. 1-Measurement of speed:
A wide variety of speed measuring devices are available they range from a mechanical tachometer to digital and triggered electrical tachometers.
The best method of measurement is to count the number of revolution in a given time; this could be done either mechanically or electrically.
2-Fuel consumption measurement: The fuel consumption of an engine is measured by determining the volume flow
in a given time interval, or to measure the time required for the consumption of a given volume (or mass) of fuel. 3-Air consumption measurement:
The measurement of the air flow in the engine intake is not an easy task, because of the cyclic nature of the engine which causes a pulsating air flow:
a) Air box method:
ـــــــــــــــــــــــــــــــ
In of air flow(see fig.6
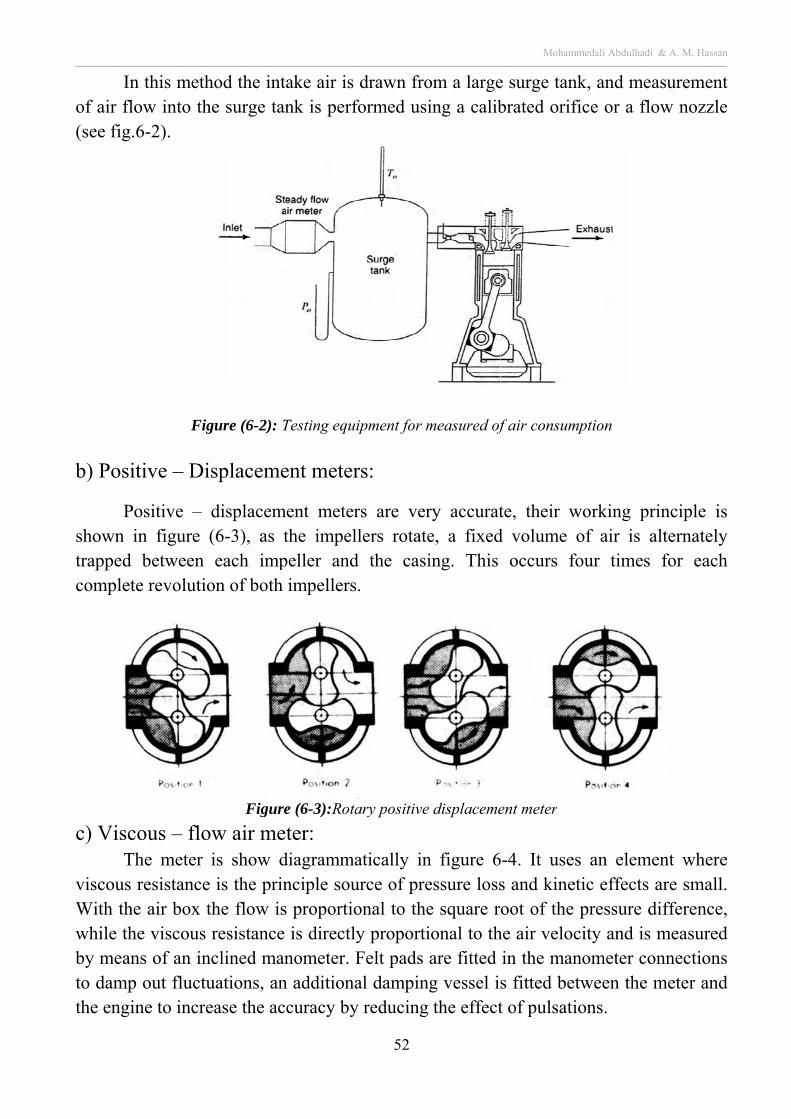
b) Positi
Poshown intrapped bcomplete
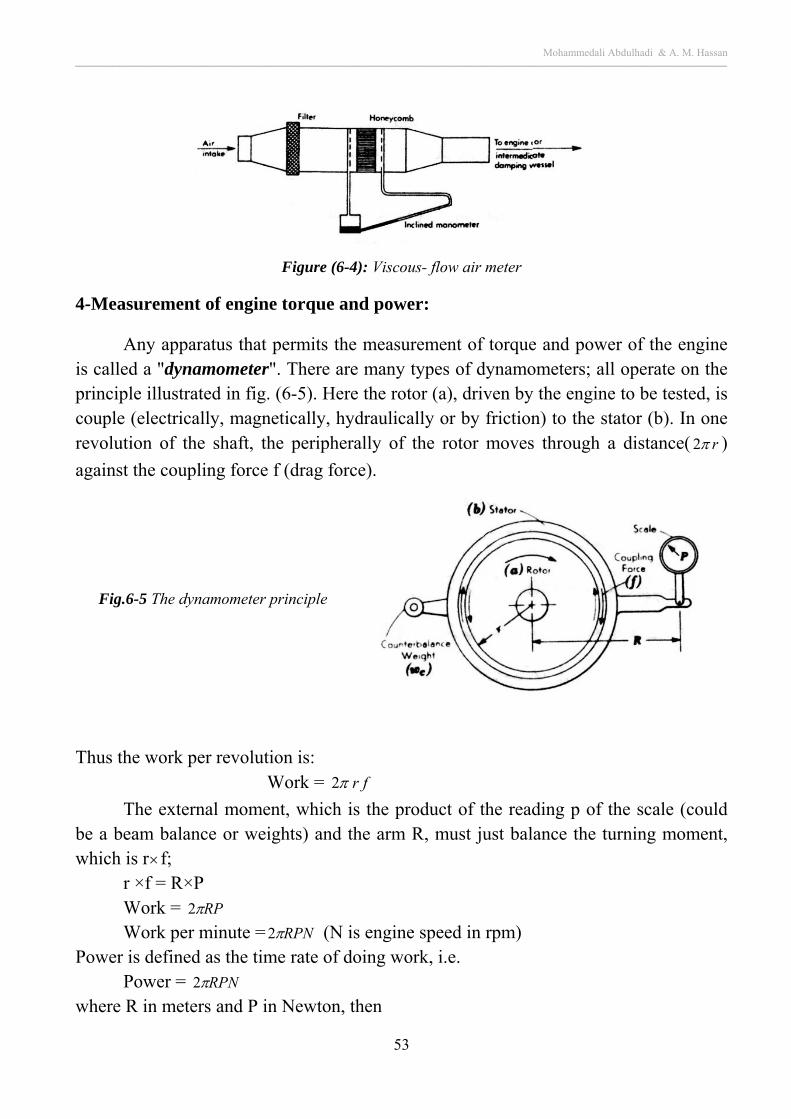
c) ViscoTh
viscous rWith the while theby meansto damp othe engin
ــــــــــــــــــــــــــــــــــ
this methow into the
6-2).
Fig
ive – Dis
sitive – dn figure (between
e revolutio
ous – flowhe meter iresistance
air box the viscous rs of an incout fluctu
ne to increa
ـــــــــــــــــــــــــــــــــ
od the inte surge tan
ure (6-2): T
splaceme
displacem(6-3), as teach imp
on of both
Figure
w air meis show dis the prinhe flow isresistance clined man
uations, anase the ac
ــــــــــــــــــــــــــــــــــ
ake air is nk is perf
Testing equi
ent meter
ment meterthe impellpeller andimpellers
e (6-3):Rota
ter: diagrammanciple sous proportio
is directlynometer. F
n additionacuracy by
ـــــــــــــــــــــــــــــــــ
52
drawn froformed usi
ipment for m
rs:
rs are verlers rotate
d the casi.
ary positive
atically inurce of preonal to they proportiFelt pads al dampiny reducing
ــــــــــــــــــــــــــــــــــ
om a largeing a calib
measured of
ry accurate, a fixeding. This
displaceme
n figure 6essure losse square rional to thare fitted g vessel ithe effect
Mohamـــــــــــــــــــــــــــــــــ
e surge tanbrated orif
f air consum
te, their wd volume
occurs f
ent meter
6-4. It uses and kineoot of the
he air veloin the mas fitted bet of pulsat
mmedali Abdulhaــــــــــــــــــــــــــــــــــ
nk, and mfice or a f
mption
working pof air is
four time
es an elemetic effectse pressure ocity and ianometer cetween thetions.
adi & A. M. Hassـــــــــــــــــــــــــــــــــ
easuremenflow nozzl
principle alternatel
s for eac
ment whers are smaldifferencs measure
connectione meter an
san ــــــ
nt le
is ly ch
re ll. e,
ed ns nd
Mohammedali Abdulhadi & A. M. Hassan ــــــــــــــــــــــــــــــــــــــــــــــــــــــــــــــــــــــــــــــــــــــــــــــــــــــــــــــــــــــــــــــــــــــــــــــــــــــــــــــــــــــــــــــــــــــــــــــــــــــــــــــــــــــــــــــــــــــــــــــــــــــــــــــــــــــــــــــــــــــــــــــــــــــــ
53
Figure (6-4): Viscous- flow air meter
4-Measurement of engine torque and power:
Any apparatus that permits the measurement of torque and power of the engine is called a "dynamometer". There are many types of dynamometers; all operate on the principle illustrated in fig. (6-5). Here the rotor (a), driven by the engine to be tested, is couple (electrically, magnetically, hydraulically or by friction) to the stator (b). In one revolution of the shaft, the peripherally of the rotor moves through a distance( r2 )
against the coupling force f (drag force).
Fig.6-5 The dynamometer principle
Thus the work per revolution is: Work = fr2
The external moment, which is the product of the reading p of the scale (could be a beam balance or weights) and the arm R, must just balance the turning moment, which is rf;
r ×f = R×P Work = RP2 Work per minute = RPN2 (N is engine speed in rpm)
Power is defined as the time rate of doing work, i.e. Power = RPN2
where R in meters and P in Newton, then
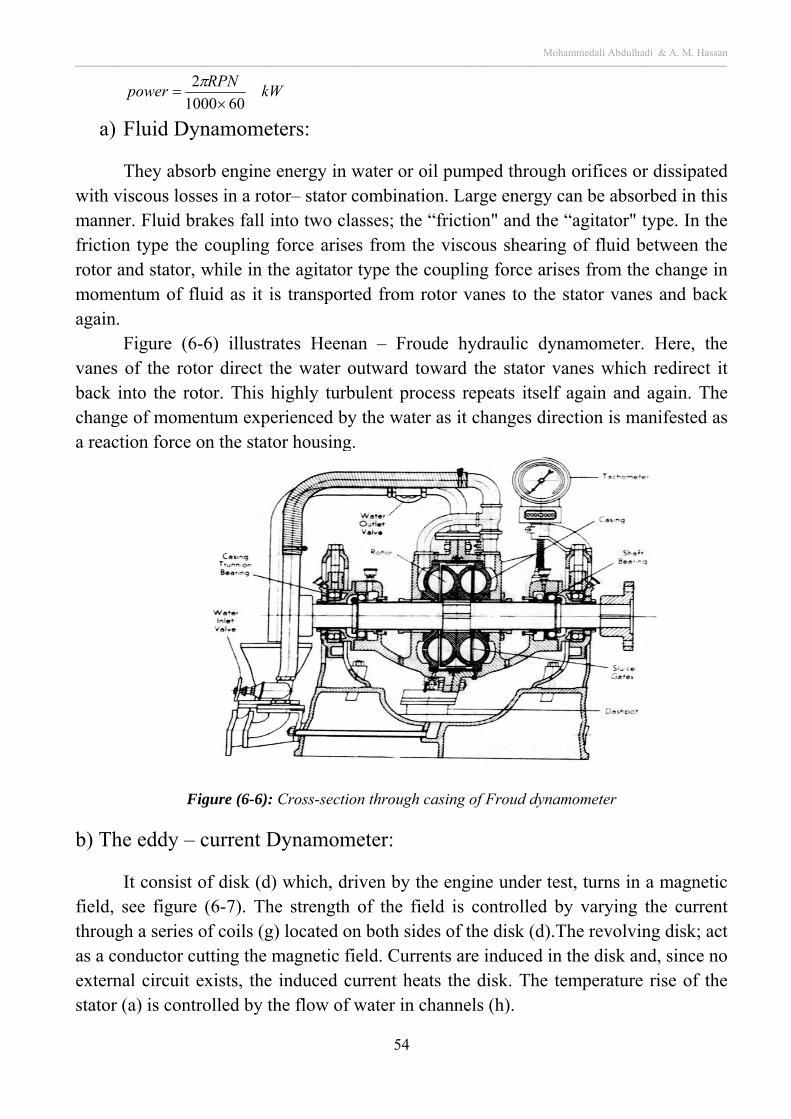
Mohammedali Abdulhadi & A. M. Hassan ــــــــــــــــــــــــــــــــــــــــــــــــــــــــــــــــــــــــــــــــــــــــــــــــــــــــــــــــــــــــــــــــــــــــــــــــــــــــــــــــــــــــــــــــــــــــــــــــــــــــــــــــــــــــــــــــــــــــــــــــــــــــــــــــــــــــــــــــــــــــــــــــــــــــ
54
kWRPN
power601000
2
a) Fluid Dynamometers:
They absorb engine energy in water or oil pumped through orifices or dissipated with viscous losses in a rotor– stator combination. Large energy can be absorbed in this manner. Fluid brakes fall into two classes; the “friction" and the “agitator" type. In the friction type the coupling force arises from the viscous shearing of fluid between the rotor and stator, while in the agitator type the coupling force arises from the change in momentum of fluid as it is transported from rotor vanes to the stator vanes and back again.
Figure (6-6) illustrates Heenan – Froude hydraulic dynamometer. Here, the vanes of the rotor direct the water outward toward the stator vanes which redirect it back into the rotor. This highly turbulent process repeats itself again and again. The change of momentum experienced by the water as it changes direction is manifested as a reaction force on the stator housing.
Figure (6-6): Cross-section through casing of Froud dynamometer
b) The eddy – current Dynamometer:
It consist of disk (d) which, driven by the engine under test, turns in a magnetic field, see figure (6-7). The strength of the field is controlled by varying the current through a series of coils (g) located on both sides of the disk (d).The revolving disk; act as a conductor cutting the magnetic field. Currents are induced in the disk and, since no external circuit exists, the induced current heats the disk. The temperature rise of the stator (a) is controlled by the flow of water in channels (h).
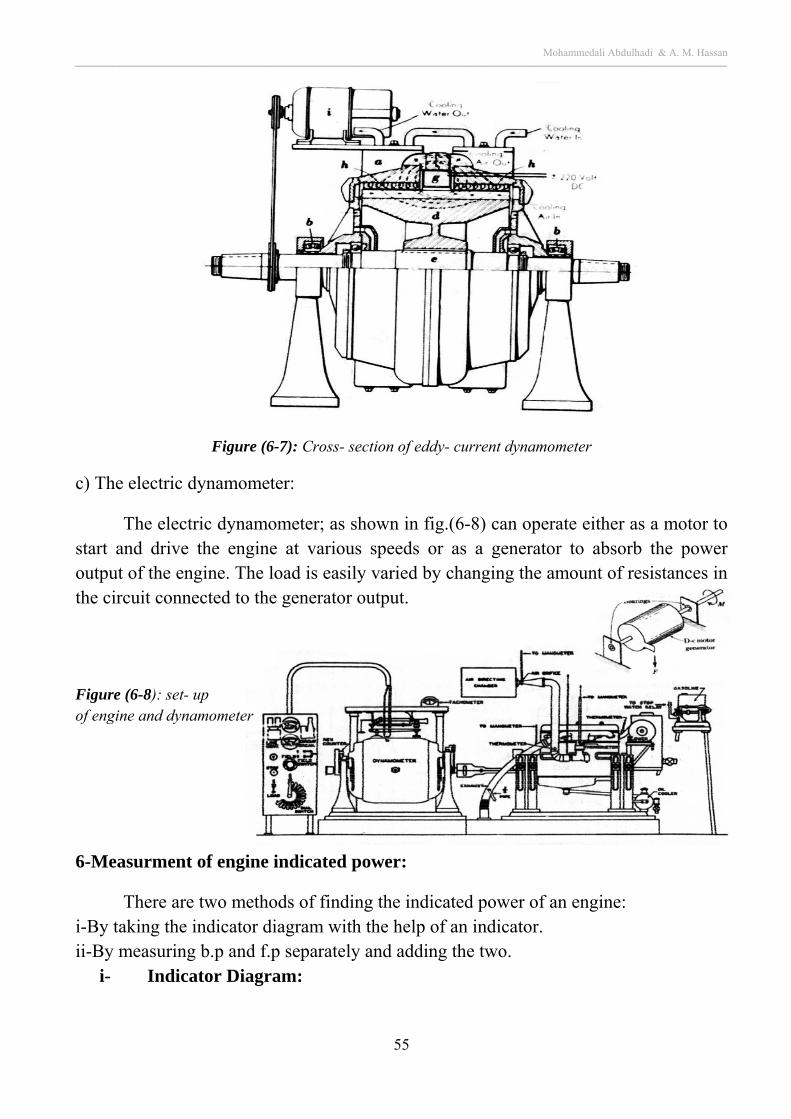
Mohammedali Abdulhadi & A. M. Hassan ــــــــــــــــــــــــــــــــــــــــــــــــــــــــــــــــــــــــــــــــــــــــــــــــــــــــــــــــــــــــــــــــــــــــــــــــــــــــــــــــــــــــــــــــــــــــــــــــــــــــــــــــــــــــــــــــــــــــــــــــــــــــــــــــــــــــــــــــــــــــــــــــــــــــ
55
Figure (6-7): Cross- section of eddy- current dynamometer
c) The electric dynamometer:
The electric dynamometer; as shown in fig.(6-8) can operate either as a motor to start and drive the engine at various speeds or as a generator to absorb the power output of the engine. The load is easily varied by changing the amount of resistances in the circuit connected to the generator output.
Figure (6-8): set- up of engine and dynamometer
6-Measurment of engine indicated power:
There are two methods of finding the indicated power of an engine: i-By taking the indicator diagram with the help of an indicator. ii-By measuring b.p and f.p separately and adding the two.
i- Indicator Diagram:
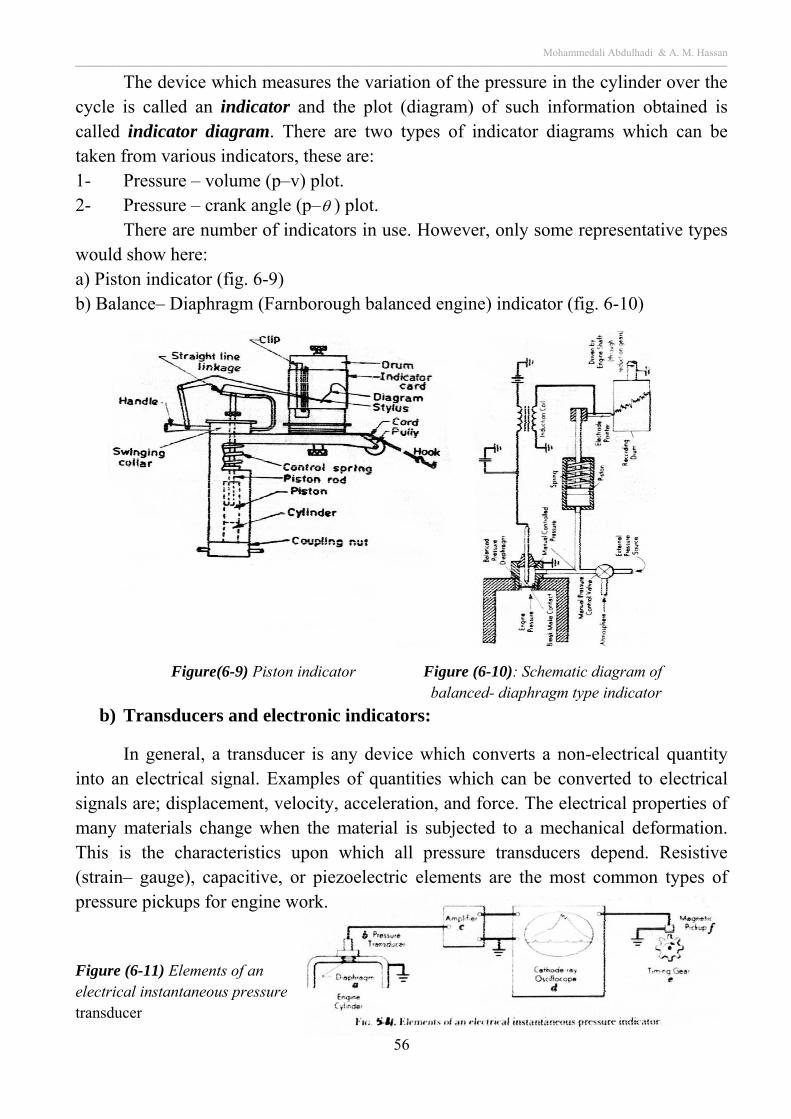
Mohammedali Abdulhadi & A. M. Hassan ــــــــــــــــــــــــــــــــــــــــــــــــــــــــــــــــــــــــــــــــــــــــــــــــــــــــــــــــــــــــــــــــــــــــــــــــــــــــــــــــــــــــــــــــــــــــــــــــــــــــــــــــــــــــــــــــــــــــــــــــــــــــــــــــــــــــــــــــــــــــــــــــــــــــ
56
The device which measures the variation of the pressure in the cylinder over the cycle is called an indicator and the plot (diagram) of such information obtained is called indicator diagram. There are two types of indicator diagrams which can be taken from various indicators, these are: 1- Pressure – volume (p–v) plot. 2- Pressure – crank angle (p– ) plot.
There are number of indicators in use. However, only some representative types would show here: a) Piston indicator (fig. 6-9) b) Balance– Diaphragm (Farnborough balanced engine) indicator (fig. 6-10)
Figure(6-9) Piston indicator Figure (6-10): Schematic diagram of balanced- diaphragm type indicator
b) Transducers and electronic indicators:
In general, a transducer is any device which converts a non-electrical quantity into an electrical signal. Examples of quantities which can be converted to electrical signals are; displacement, velocity, acceleration, and force. The electrical properties of many materials change when the material is subjected to a mechanical deformation. This is the characteristics upon which all pressure transducers depend. Resistive (strain– gauge), capacitive, or piezoelectric elements are the most common types of pressure pickups for engine work. Figure (6-11) Elements of an electrical instantaneous pressure transducer
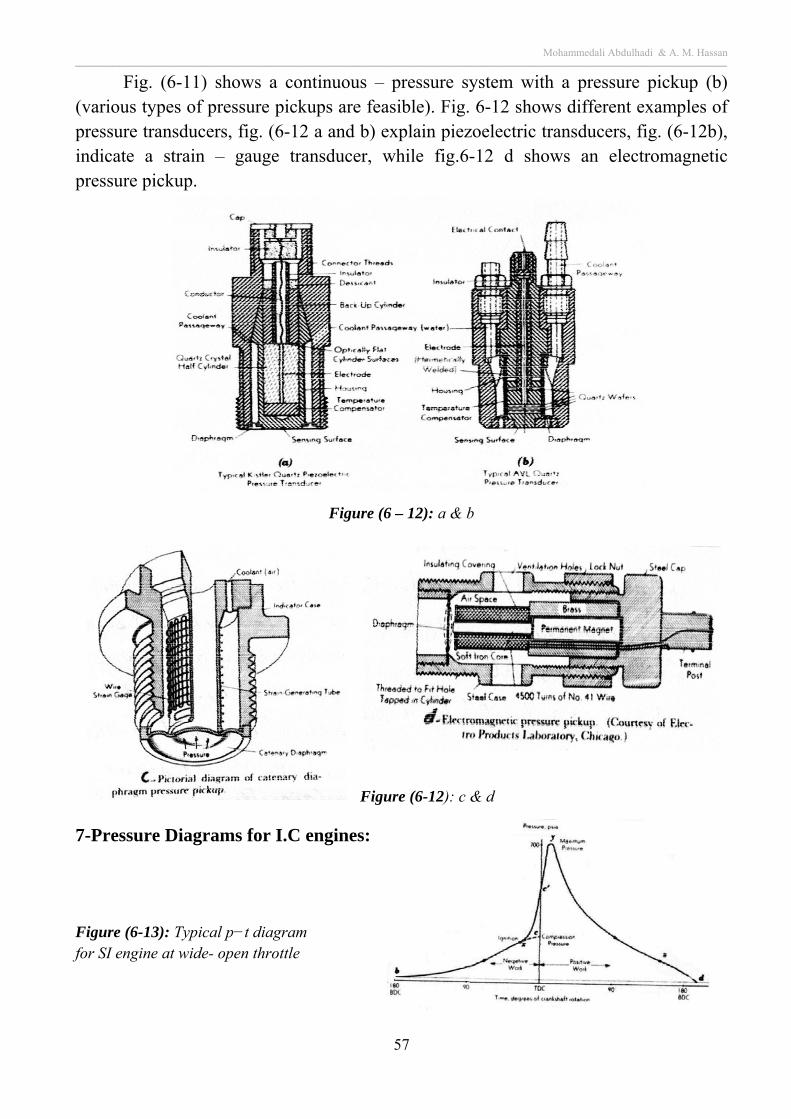
Mohammedali Abdulhadi & A. M. Hassan ــــــــــــــــــــــــــــــــــــــــــــــــــــــــــــــــــــــــــــــــــــــــــــــــــــــــــــــــــــــــــــــــــــــــــــــــــــــــــــــــــــــــــــــــــــــــــــــــــــــــــــــــــــــــــــــــــــــــــــــــــــــــــــــــــــــــــــــــــــــــــــــــــــــــ
57
Fig. (6-11) shows a continuous – pressure system with a pressure pickup (b) (various types of pressure pickups are feasible). Fig. 6-12 shows different examples of pressure transducers, fig. (6-12 a and b) explain piezoelectric transducers, fig. (6-12b), indicate a strain – gauge transducer, while fig.6-12 d shows an electromagnetic pressure pickup.
Figure (6-11):a & b
Figure (6 – 12): a & b
Figure (6-12): c & d
7-Pressure Diagrams for I.C engines:
Figure (6-13): Typical p−t diagram for SI engine at wide- open throttle
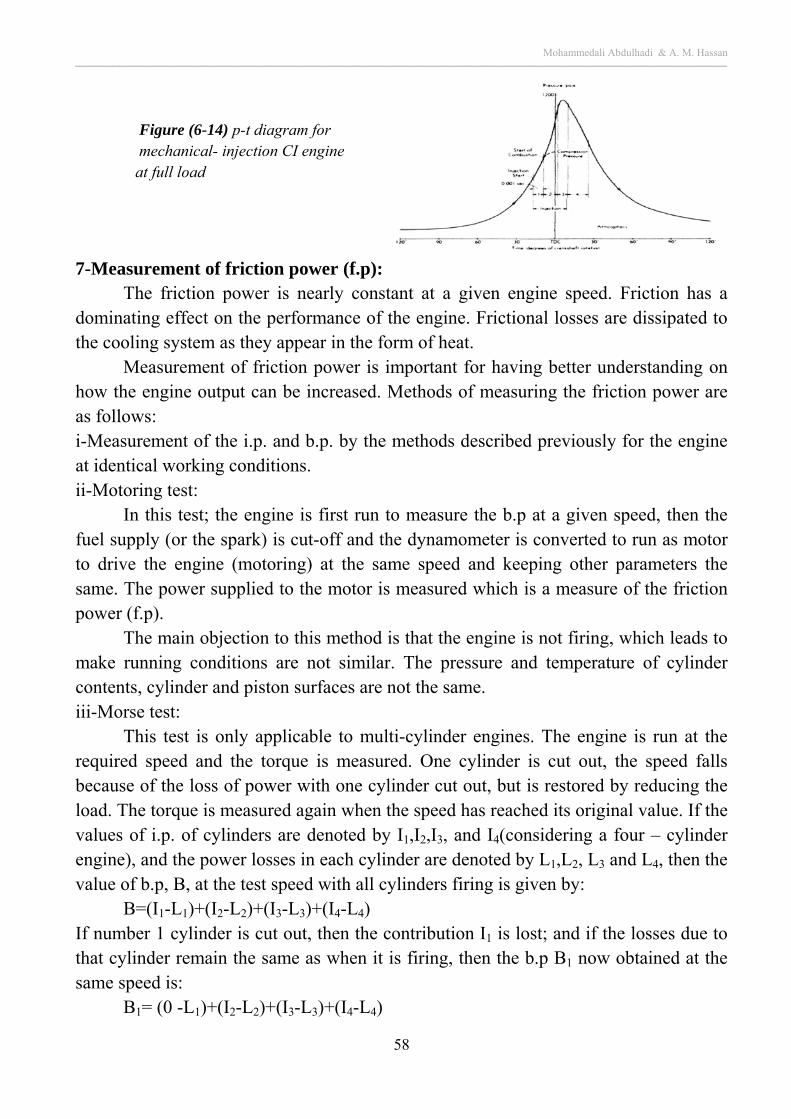
Mohammedali Abdulhadi & A. M. Hassan ــــــــــــــــــــــــــــــــــــــــــــــــــــــــــــــــــــــــــــــــــــــــــــــــــــــــــــــــــــــــــــــــــــــــــــــــــــــــــــــــــــــــــــــــــــــــــــــــــــــــــــــــــــــــــــــــــــــــــــــــــــــــــــــــــــــــــــــــــــــــــــــــــــــــ
58
Figure (6-14) p-t diagram for mechanical- injection CI engine at full load
7-Measurement of friction power (f.p):
The friction power is nearly constant at a given engine speed. Friction has a dominating effect on the performance of the engine. Frictional losses are dissipated to the cooling system as they appear in the form of heat.
Measurement of friction power is important for having better understanding on how the engine output can be increased. Methods of measuring the friction power are as follows: i-Measurement of the i.p. and b.p. by the methods described previously for the engine at identical working conditions. ii-Motoring test:
In this test; the engine is first run to measure the b.p at a given speed, then the fuel supply (or the spark) is cut-off and the dynamometer is converted to run as motor to drive the engine (motoring) at the same speed and keeping other parameters the same. The power supplied to the motor is measured which is a measure of the friction power (f.p).
The main objection to this method is that the engine is not firing, which leads to make running conditions are not similar. The pressure and temperature of cylinder contents, cylinder and piston surfaces are not the same. iii-Morse test:
This test is only applicable to multi-cylinder engines. The engine is run at the required speed and the torque is measured. One cylinder is cut out, the speed falls because of the loss of power with one cylinder cut out, but is restored by reducing the load. The torque is measured again when the speed has reached its original value. If the values of i.p. of cylinders are denoted by I1,I2,I3, and I4(considering a four – cylinder engine), and the power losses in each cylinder are denoted by L1,L2, L3 and L4, then the value of b.p, B, at the test speed with all cylinders firing is given by:
B=(I1-L1)+(I2-L2)+(I3-L3)+(I4-L4) If number 1 cylinder is cut out, then the contribution I1 is lost; and if the losses due to that cylinder remain the same as when it is firing, then the b.p B1 now obtained at the same speed is:
B1= (0 -L1)+(I2-L2)+(I3-L3)+(I4-L4)
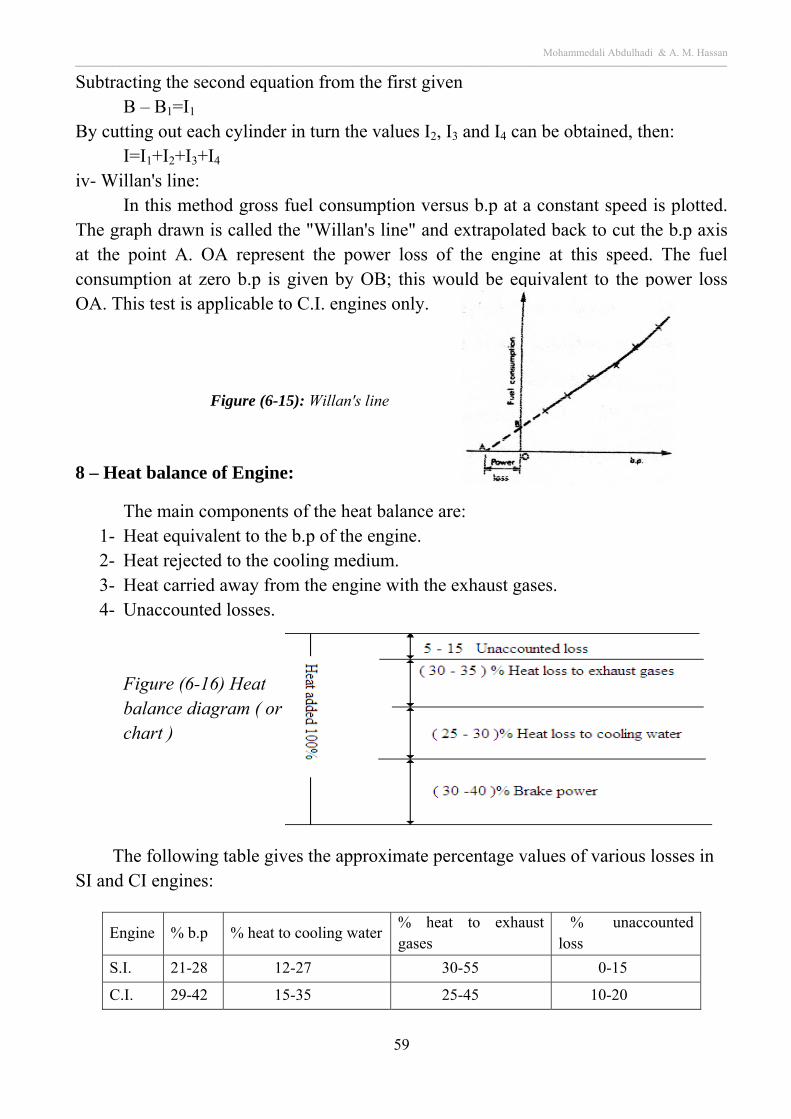
Mohammedali Abdulhadi & A. M. Hassan ــــــــــــــــــــــــــــــــــــــــــــــــــــــــــــــــــــــــــــــــــــــــــــــــــــــــــــــــــــــــــــــــــــــــــــــــــــــــــــــــــــــــــــــــــــــــــــــــــــــــــــــــــــــــــــــــــــــــــــــــــــــــــــــــــــــــــــــــــــــــــــــــــــــــ
59
Subtracting the second equation from the first given B – B1=I1
By cutting out each cylinder in turn the values I2, I3 and I4 can be obtained, then: I=I1+I2+I3+I4
iv- Willan's line: In this method gross fuel consumption versus b.p at a constant speed is plotted.
The graph drawn is called the "Willan's line" and extrapolated back to cut the b.p axis at the point A. OA represent the power loss of the engine at this speed. The fuel consumption at zero b.p is given by OB; this would be equivalent to the power loss OA. This test is applicable to C.I. engines only.
Figure (6-15): Willan's line
8 – Heat balance of Engine:
The main components of the heat balance are: 1- Heat equivalent to the b.p of the engine. 2- Heat rejected to the cooling medium. 3- Heat carried away from the engine with the exhaust gases. 4- Unaccounted losses.
Figure (6-16) Heat balance diagram ( or chart )
The following table gives the approximate percentage values of various losses in SI and CI engines:
Engine % b.p % heat to cooling water % heat to exhaust gases
% unaccounted loss
S.I. 21-28 12-27 30-55 0-15
C.I. 29-42 15-35 25-45 10-20
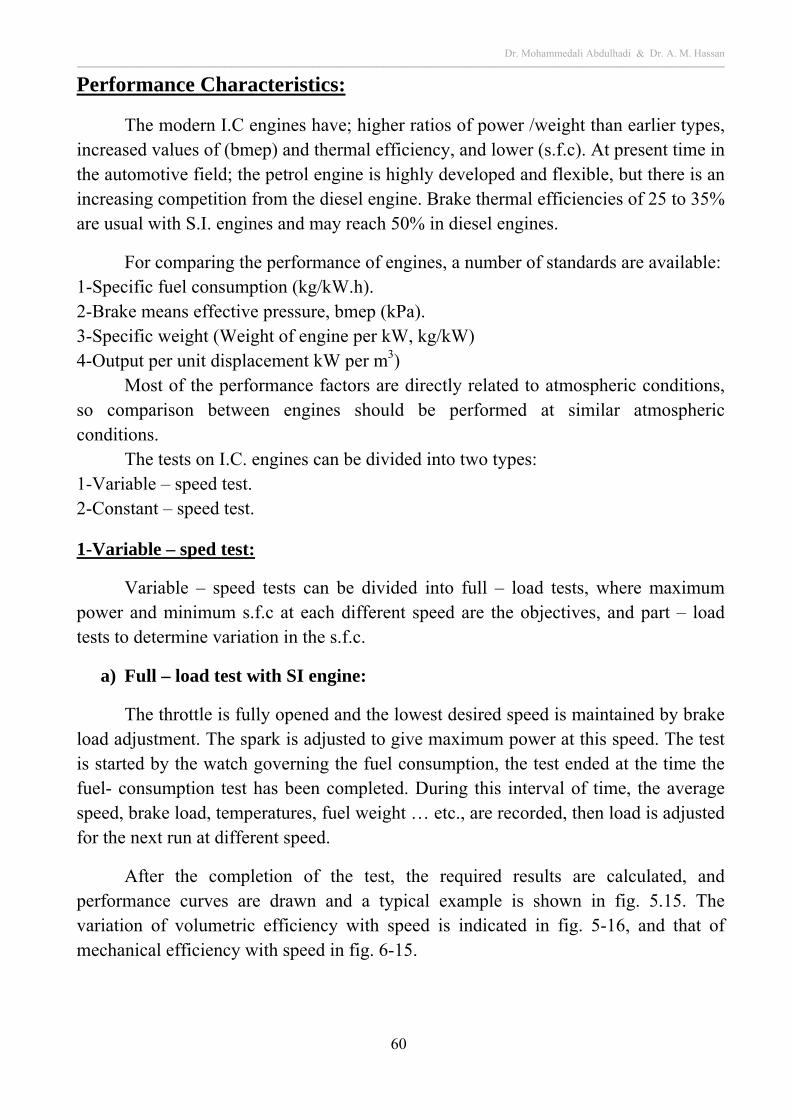
Dr. Mohammedali Abdulhadi & Dr. A. M. Hassan ــــــــــــــــــــــــــــــــــــــــــــــــــــــــــــــــــــــــــــــــــــــــــــــــــــــــــــــــــــــــــــــــــــــــــــــــــــــــــــــــــــــــــــــــــــــــــــــــــــــــــــــــــــــــــــــــــــــــــــــــــــــــــــــــــــــــــــــــــــــــــــــــــــــ
60
Performance Characteristics:
The modern I.C engines have; higher ratios of power /weight than earlier types, increased values of (bmep) and thermal efficiency, and lower (s.f.c). At present time in the automotive field; the petrol engine is highly developed and flexible, but there is an increasing competition from the diesel engine. Brake thermal efficiencies of 25 to 35% are usual with S.I. engines and may reach 50% in diesel engines.
For comparing the performance of engines, a number of standards are available: 1-Specific fuel consumption (kg/kW.h). 2-Brake means effective pressure, bmep (kPa). 3-Specific weight (Weight of engine per kW, kg/kW) 4-Output per unit displacement kW per m3)
Most of the performance factors are directly related to atmospheric conditions, so comparison between engines should be performed at similar atmospheric conditions.
The tests on I.C. engines can be divided into two types: 1-Variable – speed test. 2-Constant – speed test.
1-Variable – sped test:
Variable – speed tests can be divided into full – load tests, where maximum power and minimum s.f.c at each different speed are the objectives, and part – load tests to determine variation in the s.f.c.
a) Full – load test with SI engine:
The throttle is fully opened and the lowest desired speed is maintained by brake load adjustment. The spark is adjusted to give maximum power at this speed. The test is started by the watch governing the fuel consumption, the test ended at the time the fuel- consumption test has been completed. During this interval of time, the average speed, brake load, temperatures, fuel weight … etc., are recorded, then load is adjusted for the next run at different speed.
After the completion of the test, the required results are calculated, and performance curves are drawn and a typical example is shown in fig. 5.15. The variation of volumetric efficiency with speed is indicated in fig. 5-16, and that of mechanical efficiency with speed in fig. 6-15.
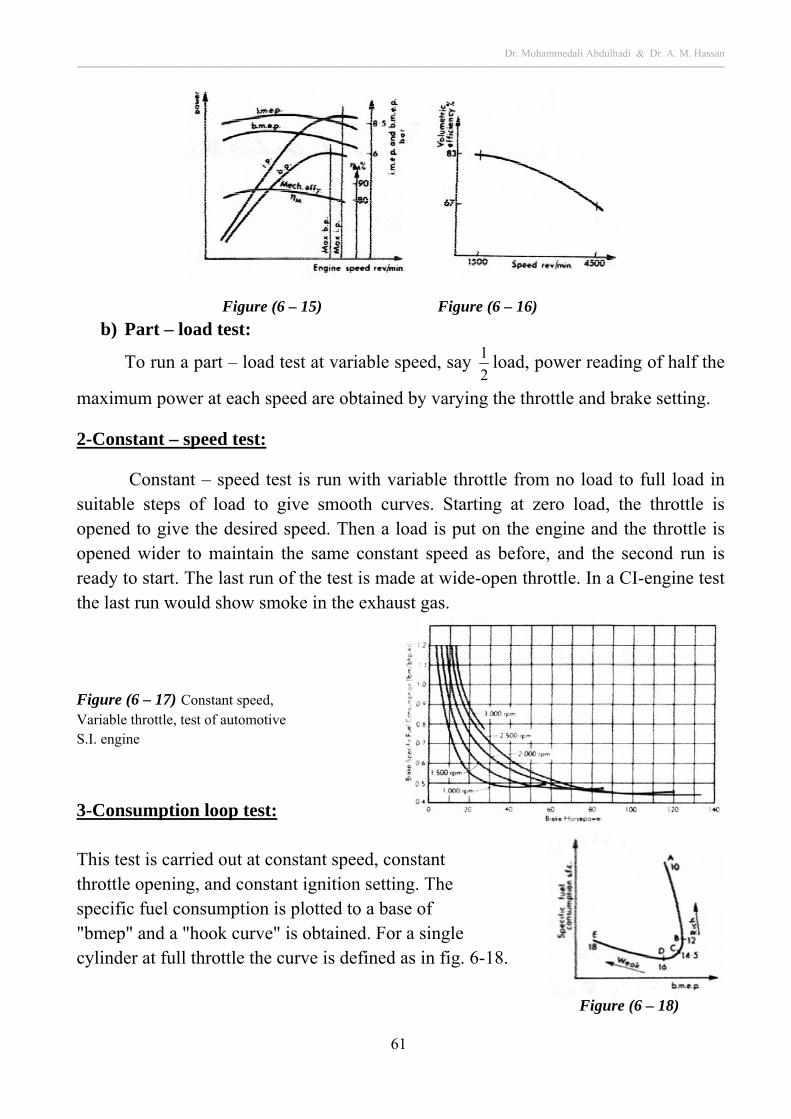
Dr. Mohammedali Abdulhadi & Dr. A. M. Hassan ــــــــــــــــــــــــــــــــــــــــــــــــــــــــــــــــــــــــــــــــــــــــــــــــــــــــــــــــــــــــــــــــــــــــــــــــــــــــــــــــــــــــــــــــــــــــــــــــــــــــــــــــــــــــــــــــــــــــــــــــــــــــــــــــــــــــــــــــــــــــــــــــــــــ
61
Figure (6 – 15) Figure (6 – 16)
b) Part – load test:
To run a part – load test at variable speed, say 2
1 load, power reading of half the
maximum power at each speed are obtained by varying the throttle and brake setting.
2-Constant – speed test:
Constant – speed test is run with variable throttle from no load to full load in suitable steps of load to give smooth curves. Starting at zero load, the throttle is opened to give the desired speed. Then a load is put on the engine and the throttle is opened wider to maintain the same constant speed as before, and the second run is ready to start. The last run of the test is made at wide-open throttle. In a CI-engine test the last run would show smoke in the exhaust gas.
Figure (6 – 17) Constant speed, Variable throttle, test of automotive S.I. engine
3-Consumption loop test: This test is carried out at constant speed, constant throttle opening, and constant ignition setting. The specific fuel consumption is plotted to a base of "bmep" and a "hook curve" is obtained. For a single cylinder at full throttle the curve is defined as in fig. 6-18. Figure (6 – 18)
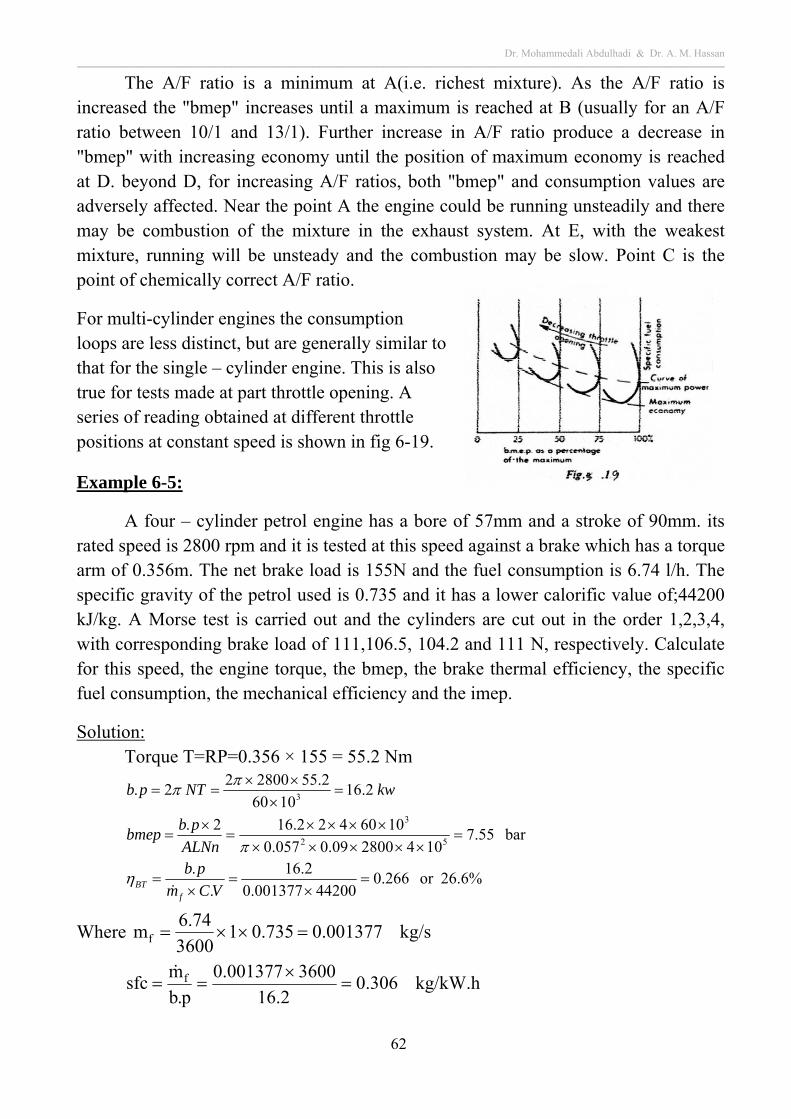
Dr. Mohammedali Abdulhadi & Dr. A. M. Hassan ــــــــــــــــــــــــــــــــــــــــــــــــــــــــــــــــــــــــــــــــــــــــــــــــــــــــــــــــــــــــــــــــــــــــــــــــــــــــــــــــــــــــــــــــــــــــــــــــــــــــــــــــــــــــــــــــــــــــــــــــــــــــــــــــــــــــــــــــــــــــــــــــــــــ
62
The A/F ratio is a minimum at A(i.e. richest mixture). As the A/F ratio is increased the "bmep" increases until a maximum is reached at B (usually for an A/F ratio between 10/1 and 13/1). Further increase in A/F ratio produce a decrease in "bmep" with increasing economy until the position of maximum economy is reached at D. beyond D, for increasing A/F ratios, both "bmep" and consumption values are adversely affected. Near the point A the engine could be running unsteadily and there may be combustion of the mixture in the exhaust system. At E, with the weakest mixture, running will be unsteady and the combustion may be slow. Point C is the point of chemically correct A/F ratio.
For multi-cylinder engines the consumption loops are less distinct, but are generally similar to that for the single – cylinder engine. This is also true for tests made at part throttle opening. A series of reading obtained at different throttle positions at constant speed is shown in fig 6-19.
Example 6-5:
A four – cylinder petrol engine has a bore of 57mm and a stroke of 90mm. its rated speed is 2800 rpm and it is tested at this speed against a brake which has a torque arm of 0.356m. The net brake load is 155N and the fuel consumption is 6.74 l/h. The specific gravity of the petrol used is 0.735 and it has a lower calorific value of;44200 kJ/kg. A Morse test is carried out and the cylinders are cut out in the order 1,2,3,4, with corresponding brake load of 111,106.5, 104.2 and 111 N, respectively. Calculate for this speed, the engine torque, the bmep, the brake thermal efficiency, the specific fuel consumption, the mechanical efficiency and the imep.
Solution: Torque T=RP=0.356 × 155 = 55.2 Nm
bar 55.7104280009.0057.0
1060422.162.
2.161060
2.55280022.
52
3
3
ALNn
pbbmep
kwNTpb
26.6%or 266.044200001377.0
2.16
.
.
VCm
pb
fBT
Where kg/s 001377.0735.013600
74.6mf
kg/kW.h 306.02.16
3600001377.0
p.b
msfc f
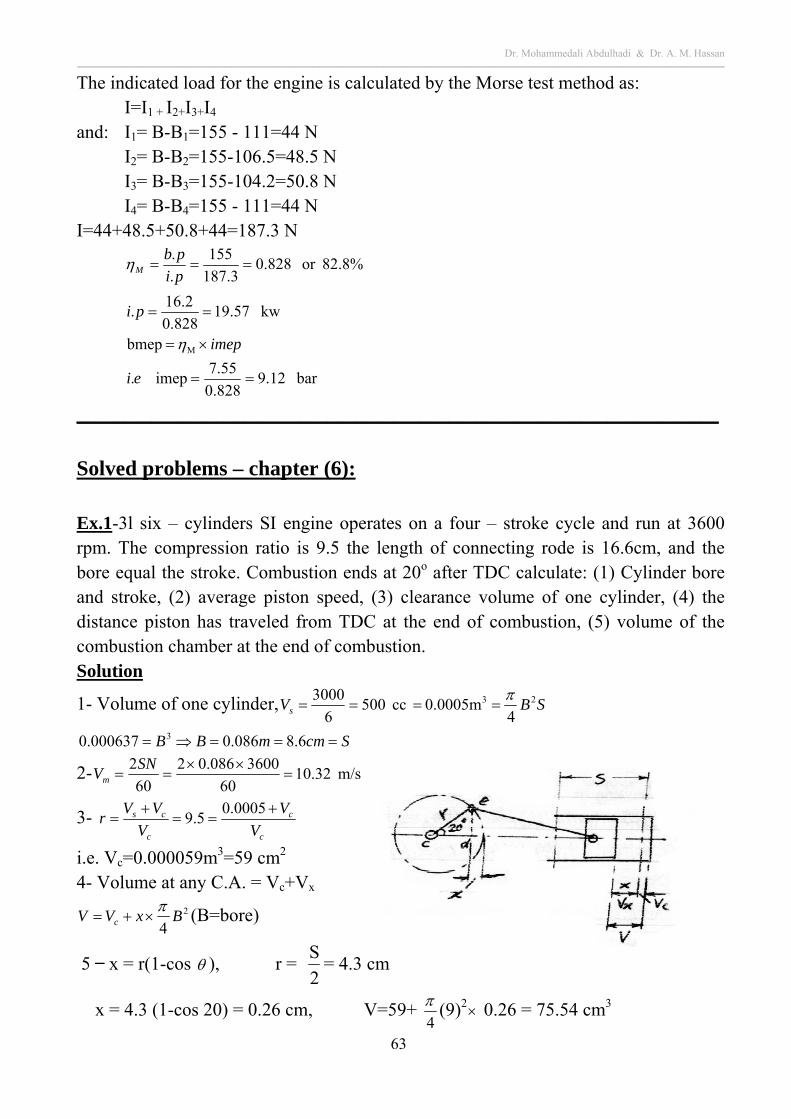
Dr. Mohammedali Abdulhadi & Dr. A. M. Hassan ــــــــــــــــــــــــــــــــــــــــــــــــــــــــــــــــــــــــــــــــــــــــــــــــــــــــــــــــــــــــــــــــــــــــــــــــــــــــــــــــــــــــــــــــــــــــــــــــــــــــــــــــــــــــــــــــــــــــــــــــــــــــــــــــــــــــــــــــــــــــــــــــــــــ
63
The indicated load for the engine is calculated by the Morse test method as: I=I1 + I2+I3+I4
and: I1= B-B1=155 - 111=44 N I2= B-B2=155-106.5=48.5 N I3= B-B3=155-104.2=50.8 N
I4= B-B4=155 - 111=44 N I=44+48.5+50.8+44=187.3 N
82.8%or 828.03.187
155
.
.
pi
pbM
bar 12.90.828
7.55imep .
bmep
kw 57.19828.0
2.16.
M
ei
imep
pi
_____________________________________________________________________
Solved problems – chapter (6):
Ex.1-3l six – cylinders SI engine operates on a four – stroke cycle and run at 3600 rpm. The compression ratio is 9.5 the length of connecting rode is 16.6cm, and the bore equal the stroke. Combustion ends at 20o after TDC calculate: (1) Cylinder bore and stroke, (2) average piston speed, (3) clearance volume of one cylinder, (4) the distance piston has traveled from TDC at the end of combustion, (5) volume of the combustion chamber at the end of combustion. Solution
1- Volume of one cylinder, SBVs23
40.0005m cc 500
6
3000
ScmmBB 6.8086.0000637.0 3
2- m/s 32.1060
3600086.02
60
2
SNVm
3- c
c
c
cs
V
V
V
VVr
0005.05.9
i.e. Vc=0.000059m3=59 cm2
4- Volume at any C.A. = Vc+Vx 2
4BxVV c
(B=bore)
5 ̶ x = r(1-cos ), r = 2
S= 4.3 cm
x = 4.3 (1-cos 20) = 0.26 cm, V=59+ 4
(9)2 0.26 = 75.54 cm3
Dr. Mohammedali Abdulhadi & Dr. A. M. Hassan ــــــــــــــــــــــــــــــــــــــــــــــــــــــــــــــــــــــــــــــــــــــــــــــــــــــــــــــــــــــــــــــــــــــــــــــــــــــــــــــــــــــــــــــــــــــــــــــــــــــــــــــــــــــــــــــــــــــــــــــــــــــــــــــــــــــــــــــــــــــــــــــــــــــ
64
Ex.2- The engine in example 1 is connected to a dynamometer which gives a brake output torque of 205 Nm at 3600 rpm. At this speed air enters the cylinder at 85 kPa and 60oC, and the mechanical efficiency of the engine is 85%. Calculate: (1) b.p, (2) i.p, (3) bmep, (4) imep, (5)fmep, (6) f.p, (7) engine specific volume. Solution
1- kW 3.7720560
360022. NTpb
2- kW 9.9085.0
3.77..
M
pbpi
3- kPa 859636000005.0
2603.77.
LANn
zpbbmep
4- kPa 5.101085.0
859imep
5- kPa 57.1518595.1010)( bmepimepPfmep f
6- kW 64.1360
1
2
636000005.057.151.
z
nLANPpf f
7-Engine specific volume = L/kW 0388.03.77
l3
power brake
meswept volu
The inverse of the specific volume is = 25.8 kW/L
Ex.3-The engine in example 2 is running with A/F ratio =15,afuel of heating value;44000kJ/kg and a combustion efficiency of 97% calculate: (1) the rate of fuel flow. (2) BT , (3) IT ,(4) V , and brake specific consumption.
Solution:
1- The clearance volume of the engine = 0.000059 m3(example 1)
kg 0005.0
)333)(/(287.0
)000059.00005.0)((85)( 3
KkgKkJ
mkPa
RT
VVP
RT
PVm scBDC
fkg 000033.015
0005.0
F
Am
m af Per cylinder per cycle
) /cylindercycle
2
1)(/
60
3600cylinder)( 6)(
.000033.0( effectivesrev
cylindercycle
kgm f
kg/s 006.0
2- 30.2%or 302.097.044000006.0
3.77
V.Cm
p.b
cfBT
3- 35.5%or 355.085.0
302.0
m
BTIT
4- 84.7% or 847.0181.1
1
)m 0005.0)(/(
kg 0005.03
RTPV
m
sa
aV
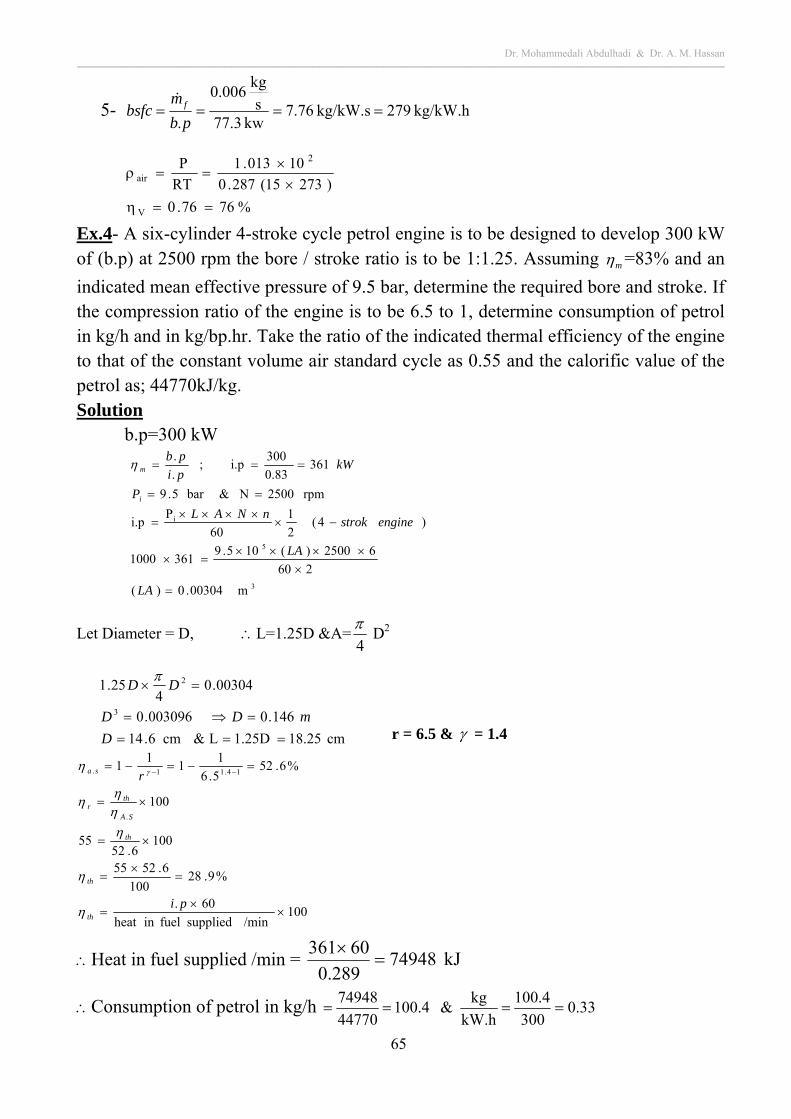
Dr. Mohammedali Abdulhadi & Dr. A. M. Hassan ــــــــــــــــــــــــــــــــــــــــــــــــــــــــــــــــــــــــــــــــــــــــــــــــــــــــــــــــــــــــــــــــــــــــــــــــــــــــــــــــــــــــــــــــــــــــــــــــــــــــــــــــــــــــــــــــــــــــــــــــــــــــــــــــــــــــــــــــــــــــــــــــــــــ
65
cm 18.251.25DL & cm 6.14
146.0003096.0
00304.04
25.1
3
2
D
mDD
DD
5- kg/kW.h 279kg/kW.s 76.7kw 77.3
s
kg 006.0
.
pb
mbsfc f
%7676.0
)27315(287.0
10013.1
RT
P
V
2
air
Ex.4- A six-cylinder 4-stroke cycle petrol engine is to be designed to develop 300 kW of (b.p) at 2500 rpm the bore / stroke ratio is to be 1:1.25. Assuming m =83% and an
indicated mean effective pressure of 9.5 bar, determine the required bore and stroke. If the compression ratio of the engine is to be 6.5 to 1, determine consumption of petrol in kg/h and in kg/bp.hr. Take the ratio of the indicated thermal efficiency of the engine to that of the constant volume air standard cycle as 0.55 and the calorific value of the petrol as; 44770kJ/kg. Solution
b.p=300 kW
Let Diameter = D, L=1.25D &A=4
D2
r = 6.5 & = 1.4
100 /minsupplied fuelin heat
60.
%9.28100
6.5255
1006.52
55
100
%6.525.6
11
11
.
14.11.
pi
r
th
th
th
SA
thr
sa
Heat in fuel supplied /min = kJ 74948289.0
60361
Consumption of petrol in kg/h 33.0300
4.100
kW.h
kg & 4.100
44770
74948
3
5
i
m 00304.0)(
260
62500)(105.93611000
)4(2
1
60
Pi.p
rpm 2500N &bar 5.9
3610.83
300i.p ;
.
.
LA
LA
enginestroknNAL
P
kWpi
pb
i
m
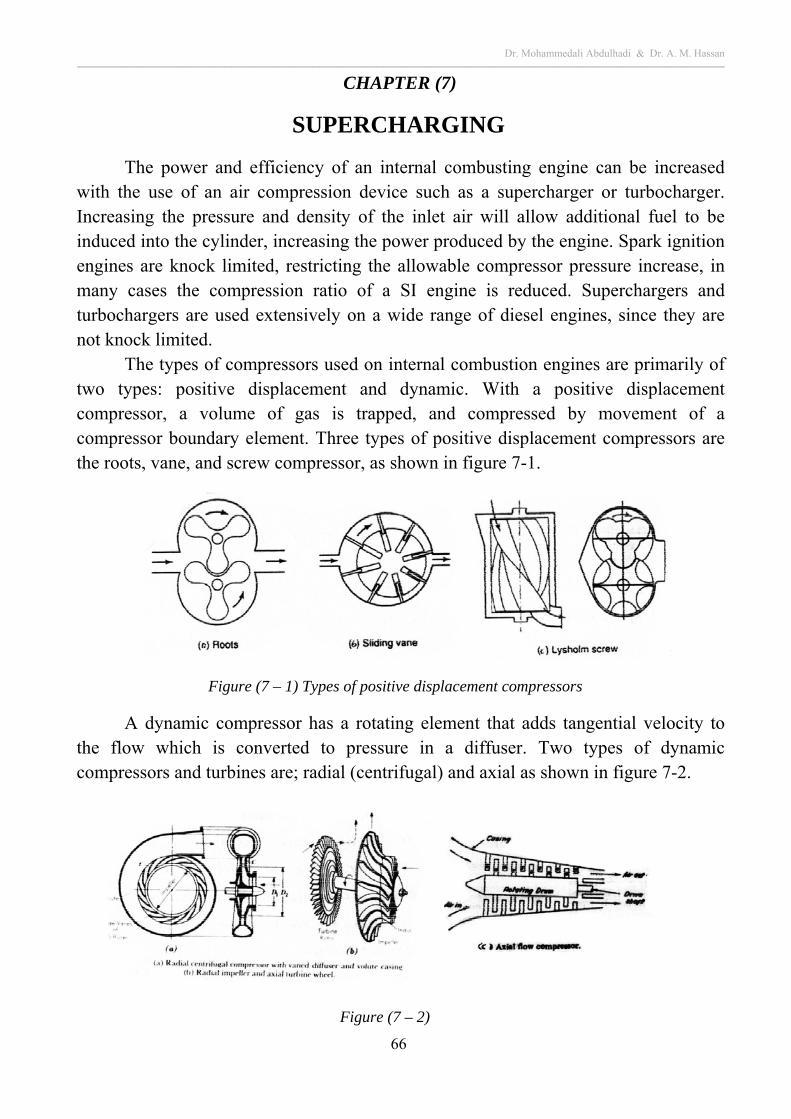
Dr. Mohammedali Abdulhadi & Dr. A. M. Hassan ــــــــــــــــــــــــــــــــــــــــــــــــــــــــــــــــــــــــــــــــــــــــــــــــــــــــــــــــــــــــــــــــــــــــــــــــــــــــــــــــــــــــــــــــــــــــــــــــــــــــــــــــــــــــــــــــــــــــــــــــــــــــــــــــــــــــــــــــــــــــــــــــــــــ
66
CHAPTER (7)
SUPERCHARGING
The power and efficiency of an internal combusting engine can be increased with the use of an air compression device such as a supercharger or turbocharger. Increasing the pressure and density of the inlet air will allow additional fuel to be induced into the cylinder, increasing the power produced by the engine. Spark ignition engines are knock limited, restricting the allowable compressor pressure increase, in many cases the compression ratio of a SI engine is reduced. Superchargers and turbochargers are used extensively on a wide range of diesel engines, since they are not knock limited.
The types of compressors used on internal combustion engines are primarily of two types: positive displacement and dynamic. With a positive displacement compressor, a volume of gas is trapped, and compressed by movement of a compressor boundary element. Three types of positive displacement compressors are the roots, vane, and screw compressor, as shown in figure 7-1.
Figure (7 – 1) Types of positive displacement compressors
A dynamic compressor has a rotating element that adds tangential velocity to the flow which is converted to pressure in a diffuser. Two types of dynamic compressors and turbines are; radial (centrifugal) and axial as shown in figure 7-2. Figure (7 – 2)
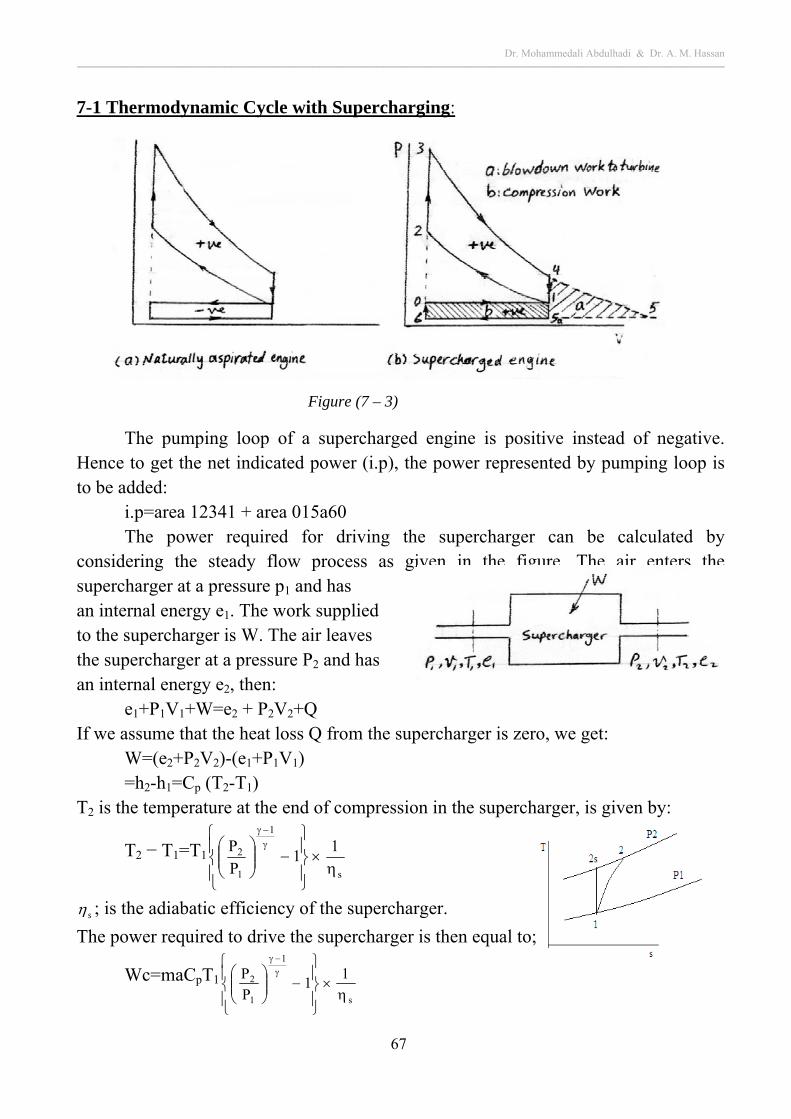
Dr. Mohammedali Abdulhadi & Dr. A. M. Hassan ــــــــــــــــــــــــــــــــــــــــــــــــــــــــــــــــــــــــــــــــــــــــــــــــــــــــــــــــــــــــــــــــــــــــــــــــــــــــــــــــــــــــــــــــــــــــــــــــــــــــــــــــــــــــــــــــــــــــــــــــــــــــــــــــــــــــــــــــــــــــــــــــــــــ
67
7-1 Thermodynamic Cycle with Supercharging:
Figure (7 – 3)
The pumping loop of a supercharged engine is positive instead of negative. Hence to get the net indicated power (i.p), the power represented by pumping loop is to be added:
i.p=area 12341 + area 015a60 The power required for driving the supercharger can be calculated by
considering the steady flow process as given in the figure. The air enters the supercharger at a pressure p1 and has an internal energy e1. The work supplied to the supercharger is W. The air leaves the supercharger at a pressure P2 and has an internal energy e2, then:
e1+P1V1+W=e2 + P2V2+Q If we assume that the heat loss Q from the supercharger is zero, we get:
W=(e2+P2V2)-(e1+P1V1) =h2-h1=Cp (T2-T1)
T2 is the temperature at the end of compression in the supercharger, is given by:
T2 − T1=T1
s
1
1
2 11
P
P
s ; is the adiabatic efficiency of the supercharger.
The power required to drive the supercharger is then equal to;
Wc=maCpT1
s
1
1
2 11
P
P
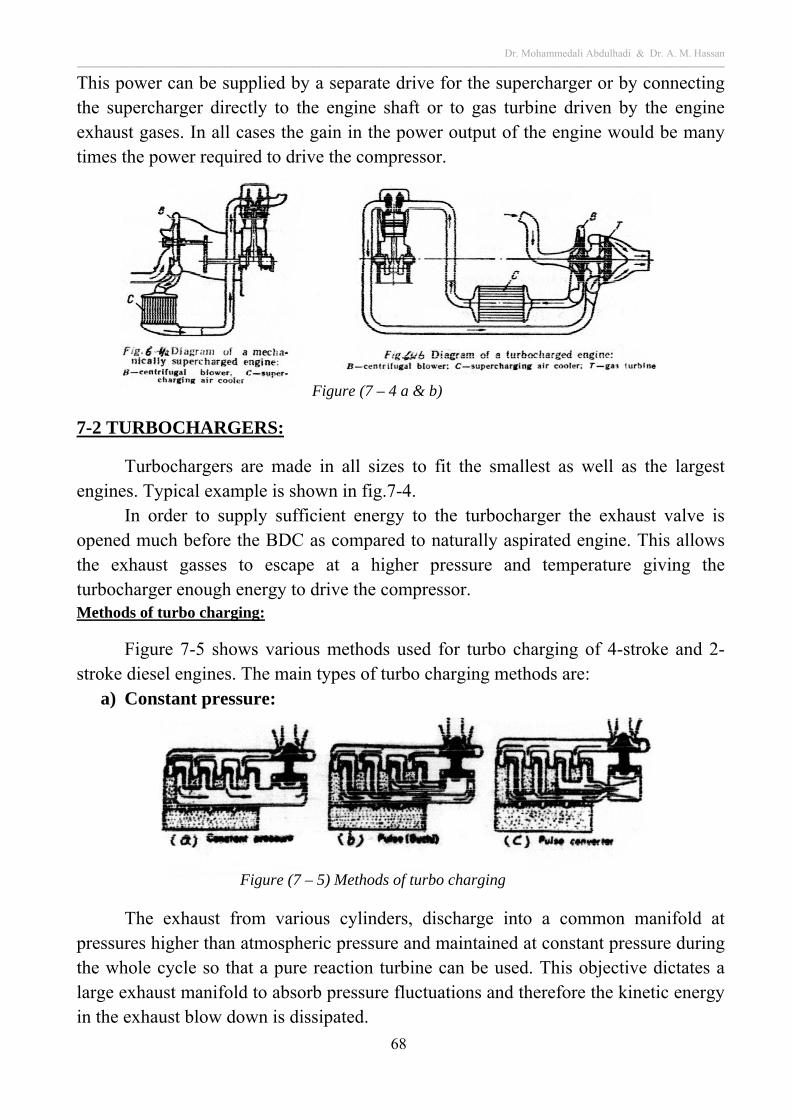
Dr. Mohammedali Abdulhadi & Dr. A. M. Hassan ــــــــــــــــــــــــــــــــــــــــــــــــــــــــــــــــــــــــــــــــــــــــــــــــــــــــــــــــــــــــــــــــــــــــــــــــــــــــــــــــــــــــــــــــــــــــــــــــــــــــــــــــــــــــــــــــــــــــــــــــــــــــــــــــــــــــــــــــــــــــــــــــــــــ
68
This power can be supplied by a separate drive for the supercharger or by connecting the supercharger directly to the engine shaft or to gas turbine driven by the engine exhaust gases. In all cases the gain in the power output of the engine would be many times the power required to drive the compressor.
Figure (7 – 4 a & b)
7-2 TURBOCHARGERS:
Turbochargers are made in all sizes to fit the smallest as well as the largest engines. Typical example is shown in fig.7-4.
In order to supply sufficient energy to the turbocharger the exhaust valve is opened much before the BDC as compared to naturally aspirated engine. This allows the exhaust gasses to escape at a higher pressure and temperature giving the turbocharger enough energy to drive the compressor. Methods of turbo charging:
Figure 7-5 shows various methods used for turbo charging of 4-stroke and 2-stroke diesel engines. The main types of turbo charging methods are:
a) Constant pressure:
Figure (7 – 5) Methods of turbo charging
The exhaust from various cylinders, discharge into a common manifold at pressures higher than atmospheric pressure and maintained at constant pressure during the whole cycle so that a pure reaction turbine can be used. This objective dictates a large exhaust manifold to absorb pressure fluctuations and therefore the kinetic energy in the exhaust blow down is dissipated.
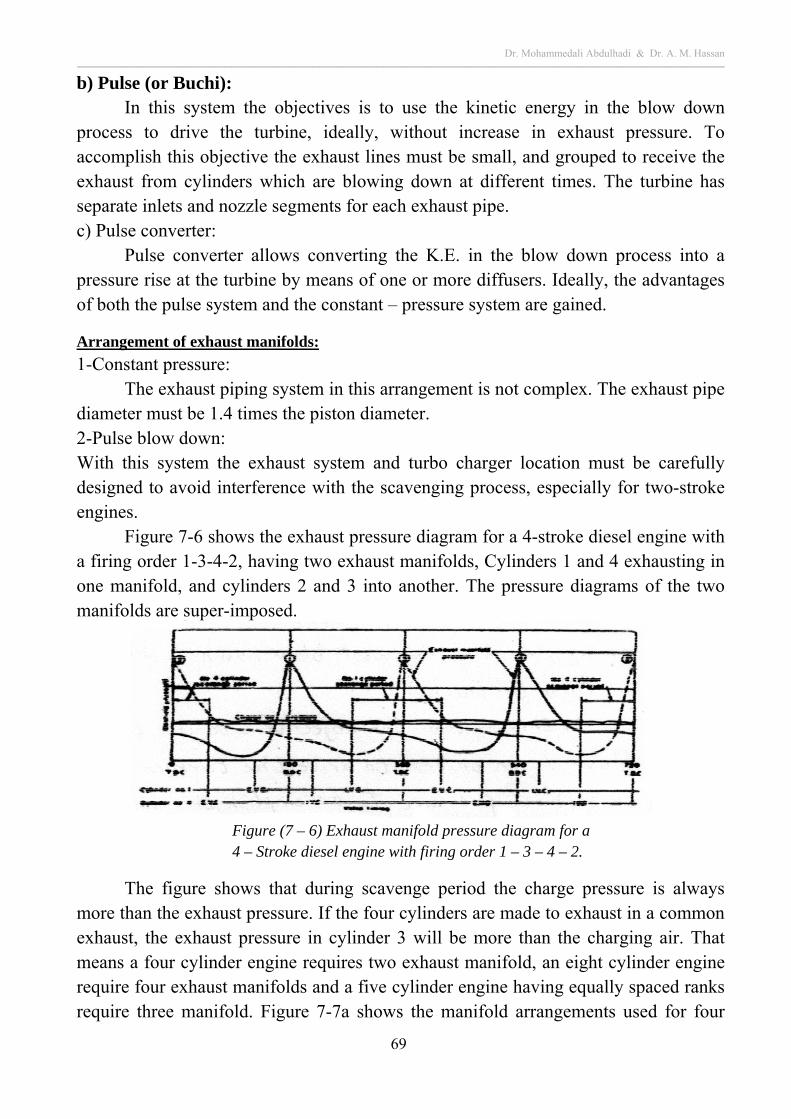
Dr. Mohammedali Abdulhadi & Dr. A. M. Hassan ــــــــــــــــــــــــــــــــــــــــــــــــــــــــــــــــــــــــــــــــــــــــــــــــــــــــــــــــــــــــــــــــــــــــــــــــــــــــــــــــــــــــــــــــــــــــــــــــــــــــــــــــــــــــــــــــــــــــــــــــــــــــــــــــــــــــــــــــــــــــــــــــــــــ
69
b) Pulse (or Buchi): In this system the objectives is to use the kinetic energy in the blow down
process to drive the turbine, ideally, without increase in exhaust pressure. To accomplish this objective the exhaust lines must be small, and grouped to receive the exhaust from cylinders which are blowing down at different times. The turbine has separate inlets and nozzle segments for each exhaust pipe. c) Pulse converter:
Pulse converter allows converting the K.E. in the blow down process into a pressure rise at the turbine by means of one or more diffusers. Ideally, the advantages of both the pulse system and the constant – pressure system are gained.
Arrangement of exhaust manifolds:
1-Constant pressure: The exhaust piping system in this arrangement is not complex. The exhaust pipe
diameter must be 1.4 times the piston diameter. 2-Pulse blow down: With this system the exhaust system and turbo charger location must be carefully designed to avoid interference with the scavenging process, especially for two-stroke engines.
Figure 7-6 shows the exhaust pressure diagram for a 4-stroke diesel engine with a firing order 1-3-4-2, having two exhaust manifolds, Cylinders 1 and 4 exhausting in one manifold, and cylinders 2 and 3 into another. The pressure diagrams of the two manifolds are super-imposed.
Figure (7 – 6) Exhaust manifold pressure diagram for a 4 – Stroke diesel engine with firing order 1 – 3 – 4 – 2.
The figure shows that during scavenge period the charge pressure is always more than the exhaust pressure. If the four cylinders are made to exhaust in a common exhaust, the exhaust pressure in cylinder 3 will be more than the charging air. That means a four cylinder engine requires two exhaust manifold, an eight cylinder engine require four exhaust manifolds and a five cylinder engine having equally spaced ranks require three manifold. Figure 7-7a shows the manifold arrangements used for four
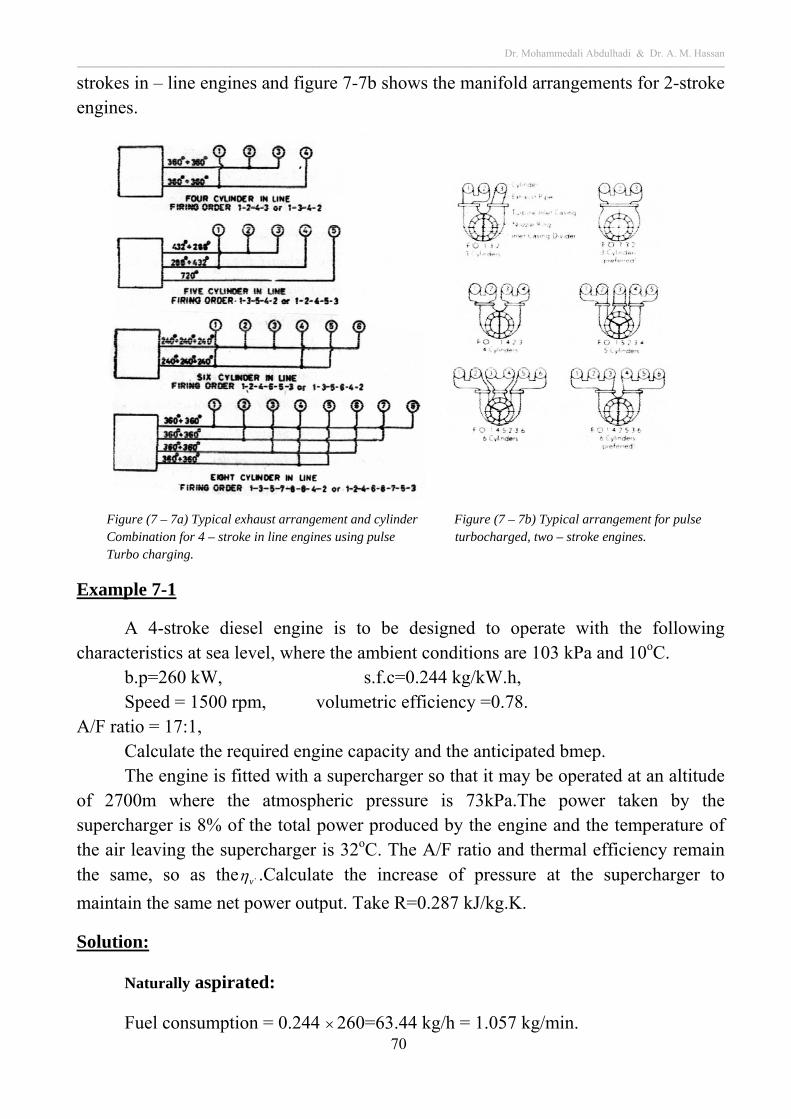
Dr. Mohammedali Abdulhadi & Dr. A. M. Hassan ــــــــــــــــــــــــــــــــــــــــــــــــــــــــــــــــــــــــــــــــــــــــــــــــــــــــــــــــــــــــــــــــــــــــــــــــــــــــــــــــــــــــــــــــــــــــــــــــــــــــــــــــــــــــــــــــــــــــــــــــــــــــــــــــــــــــــــــــــــــــــــــــــــــ
70
strokes in – line engines and figure 7-7b shows the manifold arrangements for 2-stroke engines.
Figure (7 – 7a) Typical exhaust arrangement and cylinder Figure (7 – 7b) Typical arrangement for pulse Combination for 4 – stroke in line engines using pulse turbocharged, two – stroke engines. Turbo charging.
Example 7-1
A 4-stroke diesel engine is to be designed to operate with the following characteristics at sea level, where the ambient conditions are 103 kPa and 10oC.
b.p=260 kW, s.f.c=0.244 kg/kW.h, Speed = 1500 rpm, volumetric efficiency =0.78.
A/F ratio = 17:1, Calculate the required engine capacity and the anticipated bmep. The engine is fitted with a supercharger so that it may be operated at an altitude
of 2700m where the atmospheric pressure is 73kPa.The power taken by the supercharger is 8% of the total power produced by the engine and the temperature of the air leaving the supercharger is 32oC. The A/F ratio and thermal efficiency remain the same, so as the `v .Calculate the increase of pressure at the supercharger to
maintain the same net power output. Take R=0.287 kJ/kg.K.
Solution:
Naturally aspirated:
Fuel consumption = 0.244 260=63.44 kg/h = 1.057 kg/min.
Dr. Mohammedali Abdulhadi & Dr. A. M. Hassan ــــــــــــــــــــــــــــــــــــــــــــــــــــــــــــــــــــــــــــــــــــــــــــــــــــــــــــــــــــــــــــــــــــــــــــــــــــــــــــــــــــــــــــــــــــــــــــــــــــــــــــــــــــــــــــــــــــــــــــــــــــــــــــــــــــــــــــــــــــــــــــــــــــــ
71
Air consumption = 1.05717=17.97 kg/min.
10075003.1
283287.097.17
ss
v VV
V
(PV=mRT)
Vs = 0.0242 m3
kPa 5.85915000242.0
602260..
LAN
npbbmep
Supercharged:
Total power produced by the engine = 260+0.08 260=280.8 kW This is by assuming ideal supercharging, i.e. all the power taken by the
supercharger is added to the engine power.
Mass of fuel required per minute = 280.8 60
244.0 =1.142kg/min
Mass of air/min. =1.14217=19.41kg/min.
Volume of air induced at supercharger outlet conditions = P
mRT
kPa 120
7500242.0
169978.0
min/m 1699305287.041.19
2
2
3
22
p
p
ppV
Increase of pressure required = 120 – 73= 47kPa
Pressure ratio of supercharger = 73
120 =1.644
Example 7-2:
A 4-stroke diesel engine of 3000 C.C. capacity develops 13.42 kW per m3of free air induced per minute. When running at 3500 rev/min., it has a volumetric efficiency of 80 per cent referred to free air conditions of 1.03 bars and 27oC. It is proposed to boost the power of the engine by supercharging by a blower of pressure ratio 1.7 and isentropic efficiency of 75%. Assuming that at the end of induction the cylinders contains a volume of charge equal to the swept volume, at the pressure and temperature of the delivery from the blower, estimate the increase in brake power to be expected from the engine. Take overall mechanical efficiency as 80 per cent.
Solution:
Swept volume, Vs=30002
3500 =5.25106 C.C or 5.25 m3/min
Naturally aspirated induced air volume = 0.85.25=4.2 m3/min. Blower delivery pressure = 1.71.03=1.751 bar
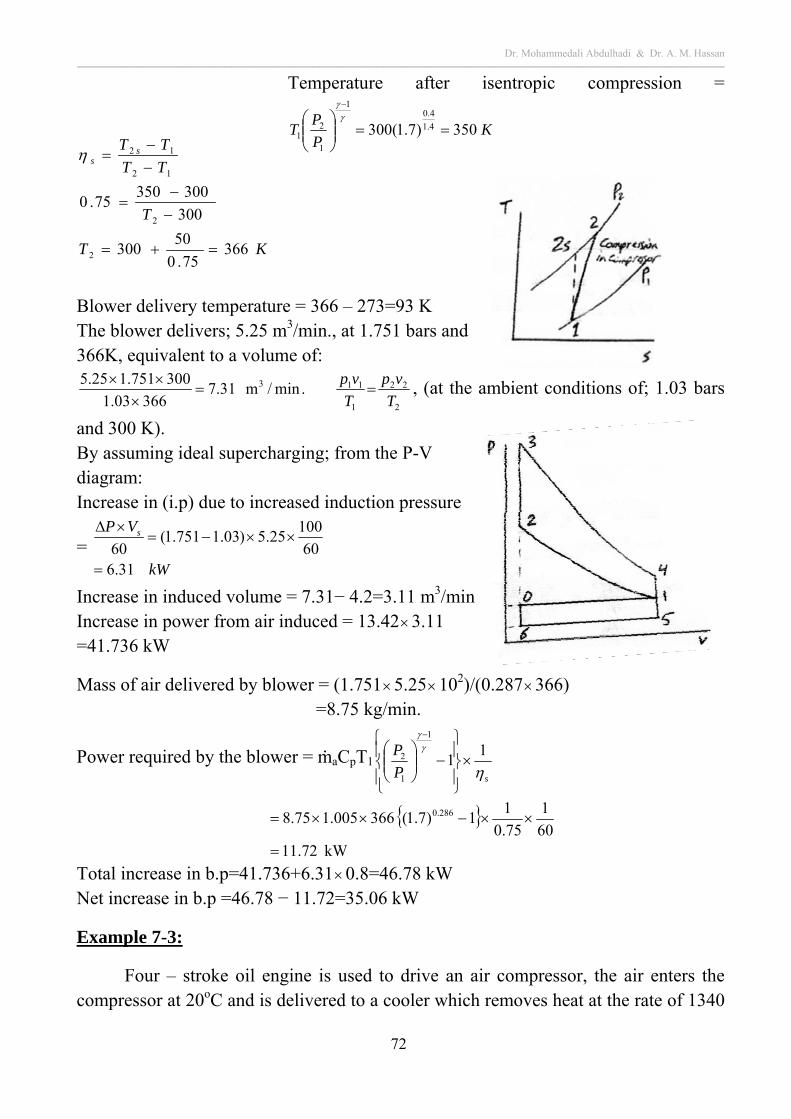
Dr. Mohammedali Abdulhadi & Dr. A. M. Hassan ــــــــــــــــــــــــــــــــــــــــــــــــــــــــــــــــــــــــــــــــــــــــــــــــــــــــــــــــــــــــــــــــــــــــــــــــــــــــــــــــــــــــــــــــــــــــــــــــــــــــــــــــــــــــــــــــــــــــــــــــــــــــــــــــــــــــــــــــــــــــــــــــــــــ
72
Temperature after isentropic compression =
KP
PT 350)7.1(300 4.1
4.01
1
21
Blower delivery temperature = 366 – 273=93 K The blower delivers; 5.25 m3/min., at 1.751 bars and 366K, equivalent to a volume of:
2
22
1
113 .min/m 31.736603.1
300751.125.5
T
vp
T
vp
, (at the ambient conditions of; 1.03 bars
and 300 K). By assuming ideal supercharging; from the P-V diagram: Increase in (i.p) due to increased induction pressure
= kW
VP s
31.660
10025.5)03.1751.1(
60
Increase in induced volume = 7.31− 4.2=3.11 m3/min Increase in power from air induced = 13.423.11 =41.736 kW
Mass of air delivered by blower = (1.7515.25102)/(0.287366) =8.75 kg/min.
Power required by the blower = ṁaCpT1sP
P
11
1
1
2
kW 72.11
60
1
75.0
11)7.1(366005.175.8 286.0
Total increase in b.p=41.736+6.310.8=46.78 kW Net increase in b.p =46.78 − 11.72=35.06 kW
Example 7-3:
Four – stroke oil engine is used to drive an air compressor, the air enters the compressor at 20oC and is delivered to a cooler which removes heat at the rate of 1340
KT
T
TT
TT ss
36675.0
50300
300
30035075.0
2
2
12
12
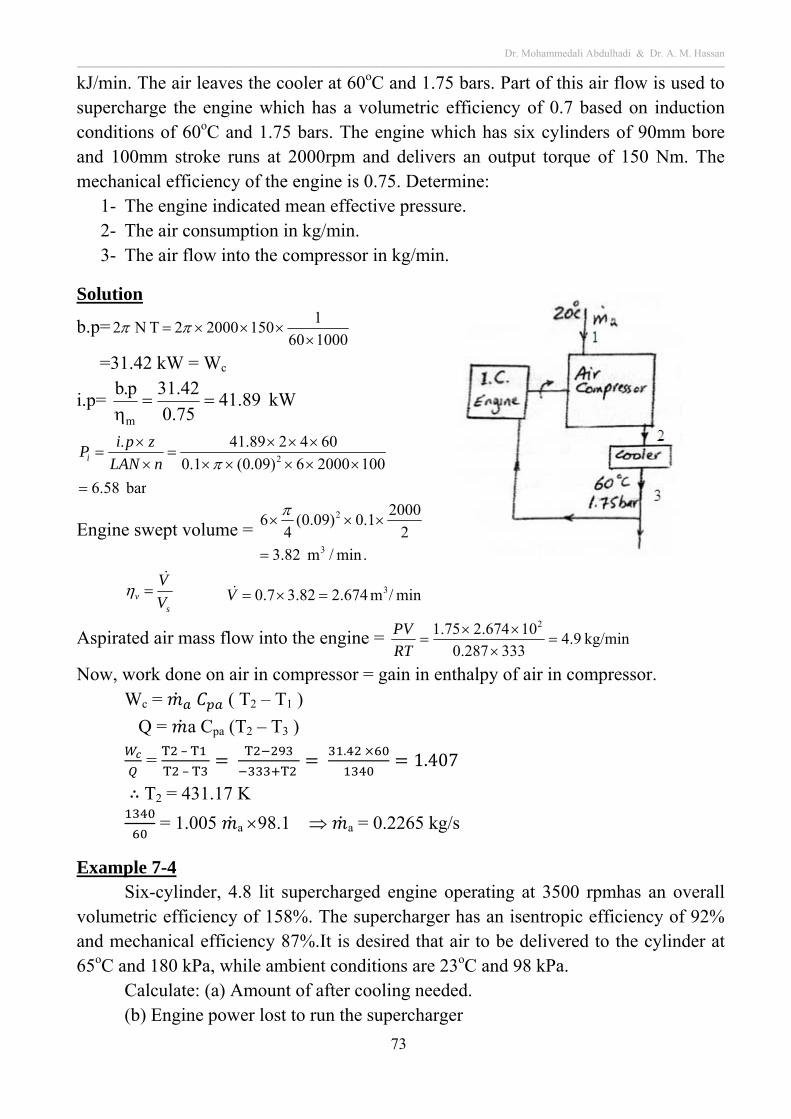
Dr. Mohammedali Abdulhadi & Dr. A. M. Hassan ــــــــــــــــــــــــــــــــــــــــــــــــــــــــــــــــــــــــــــــــــــــــــــــــــــــــــــــــــــــــــــــــــــــــــــــــــــــــــــــــــــــــــــــــــــــــــــــــــــــــــــــــــــــــــــــــــــــــــــــــــــــــــــــــــــــــــــــــــــــــــــــــــــــ
73
sv V
V min/m674.282.37.0 3V
kJ/min. The air leaves the cooler at 60oC and 1.75 bars. Part of this air flow is used to supercharge the engine which has a volumetric efficiency of 0.7 based on induction conditions of 60oC and 1.75 bars. The engine which has six cylinders of 90mm bore and 100mm stroke runs at 2000rpm and delivers an output torque of 150 Nm. The mechanical efficiency of the engine is 0.75. Determine:
1- The engine indicated mean effective pressure. 2- The air consumption in kg/min. 3- The air flow into the compressor in kg/min.
Solution
b.p=100060
115020002 T N 2
=31.42 kW = Wc
i.p= kW 89.4175.0
42.31p.b
m
bar 58.6
10020006)09.0(1.0
604289.41.2
nLAN
zpiPi
Engine swept volume = .min/m 82.3
2
20001.0)09.0(
46
3
2
Aspirated air mass flow into the engine = kg/min 9.4333287.0
10674.275.1 2
RT
PV
Now, work done on air in compressor = gain in enthalpy of air in compressor. Wc = ( T2 – T1 )
Q = a Cpa (T2 – T3 )
= T – T
T – T T
T
. 1.407
T2 = 431.17 K
= 1.005 a 98.1 a = 0.2265 kg/s
Example 7-4 Six-cylinder, 4.8 lit supercharged engine operating at 3500 rpmhas an overall
volumetric efficiency of 158%. The supercharger has an isentropic efficiency of 92% and mechanical efficiency 87%.It is desired that air to be delivered to the cylinder at 65oC and 180 kPa, while ambient conditions are 23oC and 98 kPa.
Calculate: (a) Amount of after cooling needed. (b) Engine power lost to run the supercharger
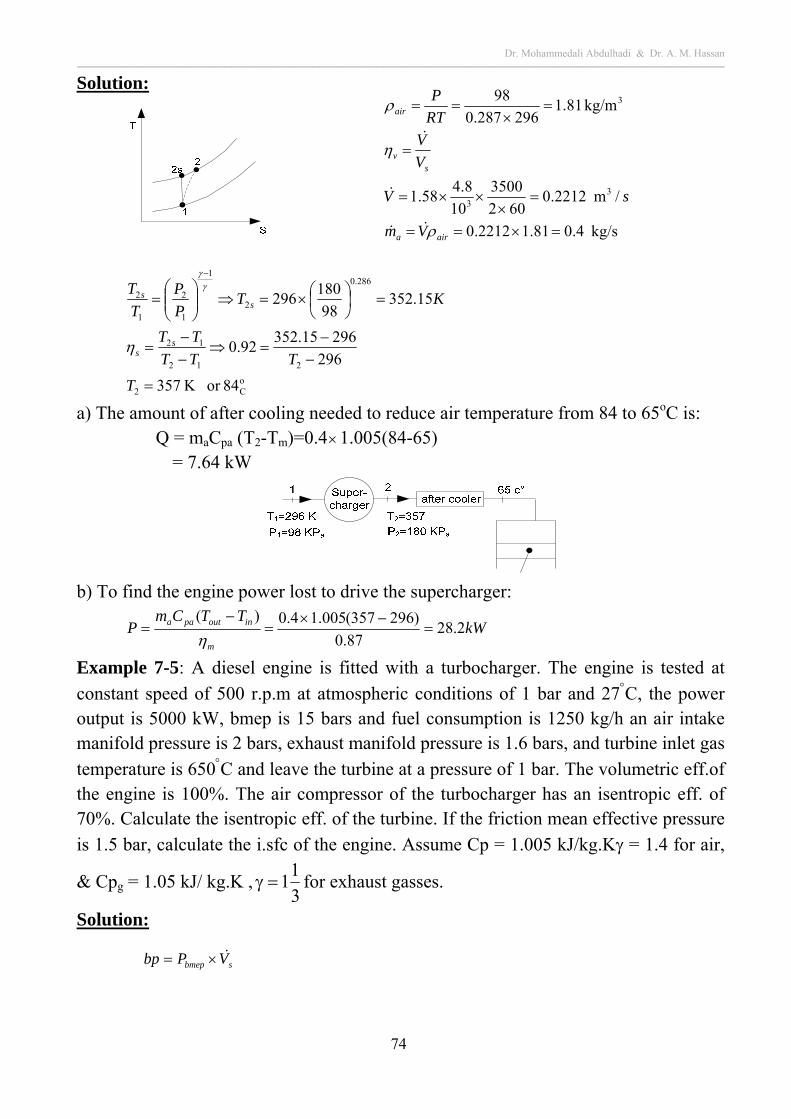
Dr. Mohammedali Abdulhadi & Dr. A. M. Hassan ــــــــــــــــــــــــــــــــــــــــــــــــــــــــــــــــــــــــــــــــــــــــــــــــــــــــــــــــــــــــــــــــــــــــــــــــــــــــــــــــــــــــــــــــــــــــــــــــــــــــــــــــــــــــــــــــــــــــــــــــــــــــــــــــــــــــــــــــــــــــــــــــــــــ
74
kg/s 4.081.12212.0
/m 2212.0602
3500
10
8.458.1
kg/m 81.1296287.0
98
33
3
aira
sv
air
Vm
sV
V
V
RT
P
Solution:
oC2
212
12
286.0
2
1
1
2
1
2
84or K 357
296
29615.35292.0
15.35298
180296
T
TTT
TT
KTP
P
T
T
ss
ss
a) The amount of after cooling needed to reduce air temperature from 84 to 65oC is: Q = maCpa (T2-Tm)=0.41.005(84-65)
= 7.64 kW
b) To find the engine power lost to drive the supercharger:
kWTTCm
Pm
inoutpaa 2.2887.0
)296357(005.14.0)(
Example 7-5: A diesel engine is fitted with a turbocharger. The engine is tested at
constant speed of 500 r.p.m at atmospheric conditions of 1 bar and 27C, the power output is 5000 kW, bmep is 15 bars and fuel consumption is 1250 kg/h an air intake manifold pressure is 2 bars, exhaust manifold pressure is 1.6 bars, and turbine inlet gas
temperature is 650C and leave the turbine at a pressure of 1 bar. The volumetric eff.of the engine is 100%. The air compressor of the turbocharger has an isentropic eff. of 70%. Calculate the isentropic eff. of the turbine. If the friction mean effective pressure
is 1.5 bar, calculate the i.sfc of the engine. Assume Cp = 1.005 kJ/kg.K = 1.4 for air,
& Cpg = 1.05 kJ/ kg.K ,3
11 for exhaust gasses.
Solution:
sbmep VPbp
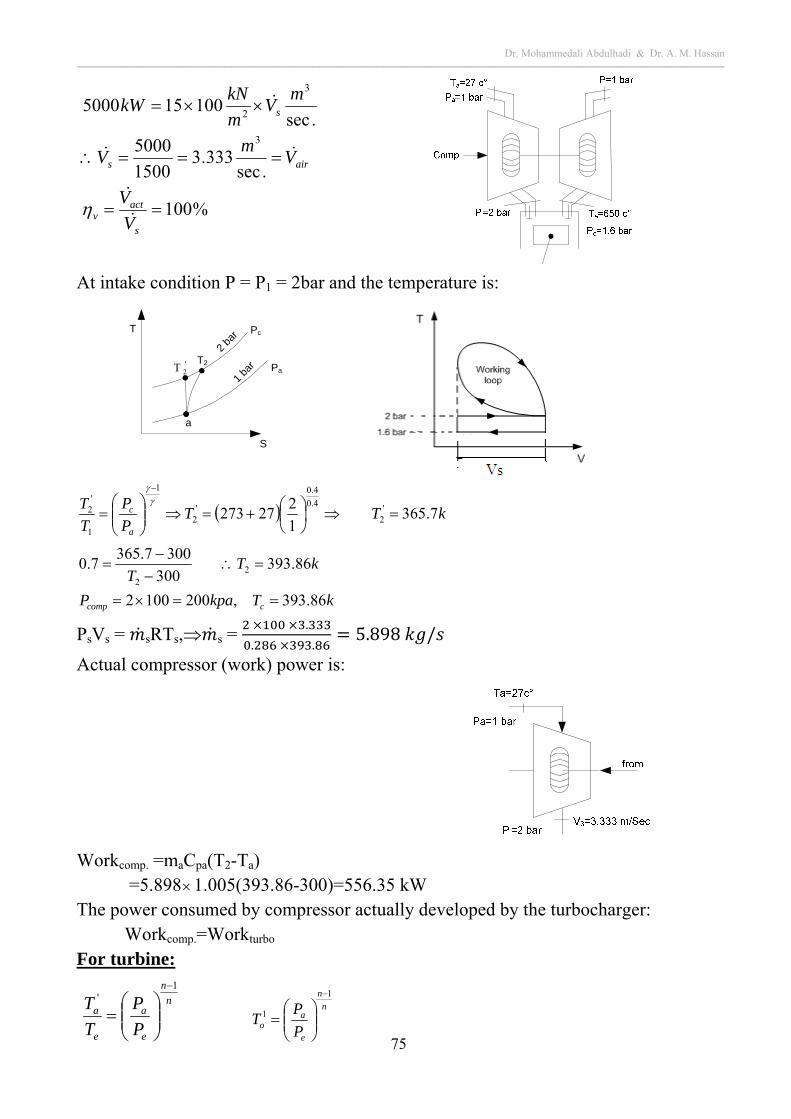
Dr. Mohammedali Abdulhadi & Dr. A. M. Hassan ــــــــــــــــــــــــــــــــــــــــــــــــــــــــــــــــــــــــــــــــــــــــــــــــــــــــــــــــــــــــــــــــــــــــــــــــــــــــــــــــــــــــــــــــــــــــــــــــــــــــــــــــــــــــــــــــــــــــــــــــــــــــــــــــــــــــــــــــــــــــــــــــــــــ
75
%100
.sec333.3
1500
5000
.sec100155000
3
3
2
s
actv
airs
s
V
V
Vm
V
mV
m
kNkW
n
n
e
a
e
a
P
P
T
T1
'
n
n
e
ao P
PT
1
1
At intake condition P = P1 = 2bar and the temperature is:
T
2 ba
r
Pa
a
'2T
T2
S
Pc
1 ba
r
kTTP
P
T
T
a
c 7.3651
227273 '
2
4.0
4.0
'2
1
1
'2
kTkpaP
kTT
ccomp 86.393,2001002
86.393300
3007.3657.0 2
2
PsVs = sRTs, s = .
. .5.898 /
Actual compressor (work) power is:
Workcomp. =maCpa(T2-Ta)
=5.8981.005(393.86-300)=556.35 kW The power consumed by compressor actually developed by the turbocharger:
Workcomp.=Workturbo For turbine:
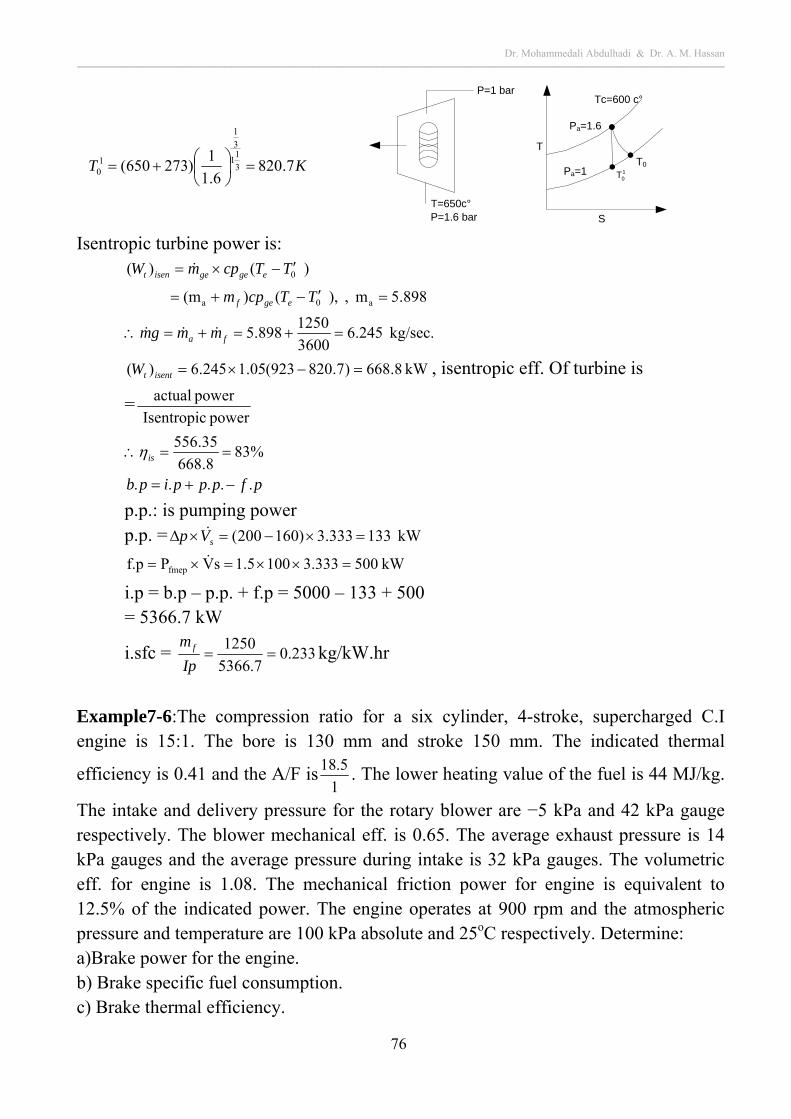
Dr. Mohammedali Abdulhadi & Dr. A. M. Hassan ــــــــــــــــــــــــــــــــــــــــــــــــــــــــــــــــــــــــــــــــــــــــــــــــــــــــــــــــــــــــــــــــــــــــــــــــــــــــــــــــــــــــــــــــــــــــــــــــــــــــــــــــــــــــــــــــــــــــــــــــــــــــــــــــــــــــــــــــــــــــــــــــــــــ
76
P=1 bar
T=650c°P=1.6 bar
T
Tc=600 c°
Pa=1.6
Pa=1 10T
T0
S
Isentropic turbine power is:
kg/sec. 245.63600
1250898.5
898.5m , ),()(m
)()(
a0a
0
fa
egef
egegeisent
mmgm
TTcpm
TTcpmW
kW 8.668)7.820923(05.1245.6)( isenttW , isentropic eff. Of turbine is
=power Isentropic
power actual
pfpppipb
is
.....
%838.668
35.556
p.p.: is pumping power p.p. = kW 133333.3)160200( sVp
kW 5003.3331001.5sVPf.p fmep
i.p = b.p – p.p. + f.p = 5000 – 133 + 500 = 5366.7 kW
i.sfc = 233.07.5366
1250
Ip
m f kg/kW.hr
Example7-6:The compression ratio for a six cylinder, 4-stroke, supercharged C.I engine is 15:1. The bore is 130 mm and stroke 150 mm. The indicated thermal
efficiency is 0.41 and the A/F is1
5.18 . The lower heating value of the fuel is 44 MJ/kg.
The intake and delivery pressure for the rotary blower are −5 kPa and 42 kPa gauge respectively. The blower mechanical eff. is 0.65. The average exhaust pressure is 14 kPa gauges and the average pressure during intake is 32 kPa gauges. The volumetric eff. for engine is 1.08. The mechanical friction power for engine is equivalent to 12.5% of the indicated power. The engine operates at 900 rpm and the atmospheric pressure and temperature are 100 kPa absolute and 25oC respectively. Determine: a)Brake power for the engine. b) Brake specific fuel consumption. c) Brake thermal efficiency.
KT 7.8206.1
1)273650( 3
11
3
1
10
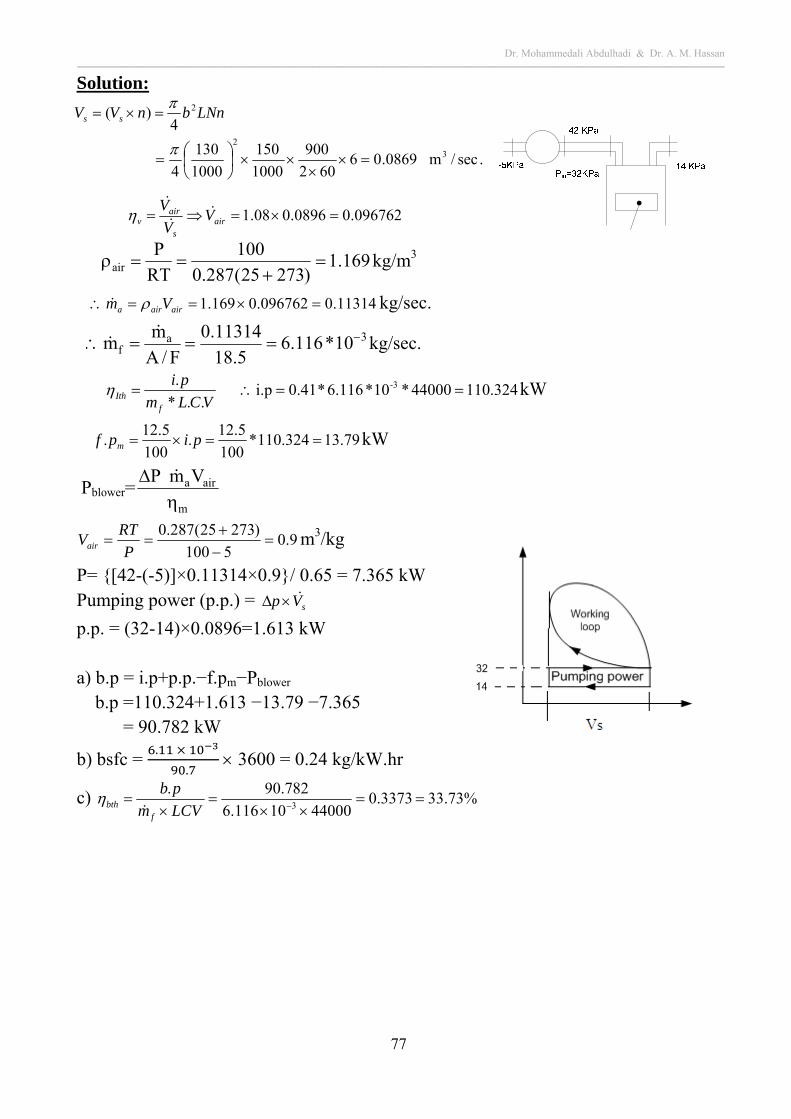
Dr. Mohammedali Abdulhadi & Dr. A. M. Hassan ــــــــــــــــــــــــــــــــــــــــــــــــــــــــــــــــــــــــــــــــــــــــــــــــــــــــــــــــــــــــــــــــــــــــــــــــــــــــــــــــــــــــــــــــــــــــــــــــــــــــــــــــــــــــــــــــــــــــــــــــــــــــــــــــــــــــــــــــــــــــــــــــــــــ
77
.sec/m 0869.06602
900
1000
150
1000
130
4
4)(
32
2
LNnbnVV ss
096762.00896.008.1 airs
airv V
V
V
Solution:
169.1
)27325(287.0
100
RT
Pair
kg/m3
11314.0096762.0169.1 airaira Vm kg/sec.
3af 10*116.6
5.18
11314.0
F/A
mm
kg/sec.
324.11044000*10*6.116*0.41i.p
..*
. 3- VCLm
pi
fIth kW
79.13324.110*
100
5.12.
100
5.12. pipf m kW
Pblower=m
airaVm P
9.05100
)27325(287.0
P
RTVair m3/kg
P= {[42-(-5)]×0.11314×0.9}/ 0.65 = 7.365 kW Pumping power (p.p.) = sVp
p.p. = (32-14)×0.0896=1.613 kW a) b.p = i.p+p.p.−f.pm−Pblower b.p =110.324+1.613 −13.79 −7.365 = 90.782 kW
b) bsfc = .
. 3600 = 0.24 kg/kW.hr
c) %73.333373.04400010116.6
782.90.3
LCVm
pb
fbth
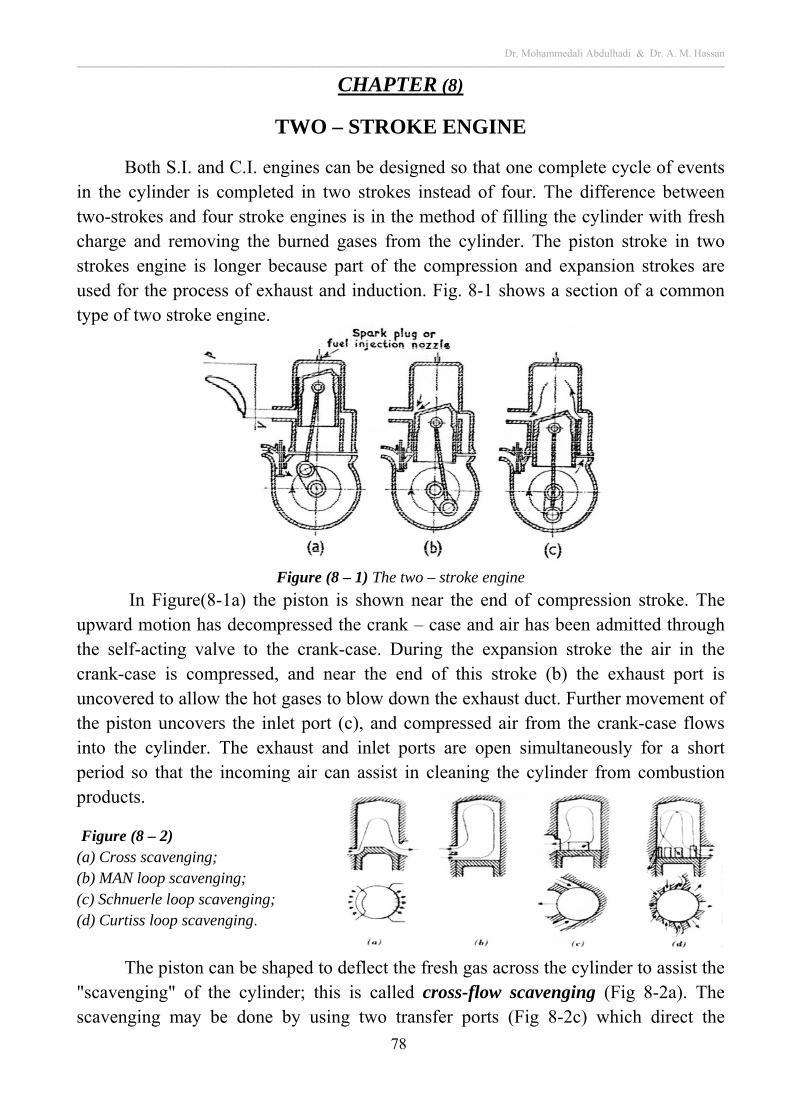
Dr. Mohammedali Abdulhadi & Dr. A. M. Hassan ــــــــــــــــــــــــــــــــــــــــــــــــــــــــــــــــــــــــــــــــــــــــــــــــــــــــــــــــــــــــــــــــــــــــــــــــــــــــــــــــــــــــــــــــــــــــــــــــــــــــــــــــــــــــــــــــــــــــــــــــــــــــــــــــــــــــــــــــــــــــــــــــــــــ
78
CHAPTER (8)
TWO – STROKE ENGINE
Both S.I. and C.I. engines can be designed so that one complete cycle of events in the cylinder is completed in two strokes instead of four. The difference between two-strokes and four stroke engines is in the method of filling the cylinder with fresh charge and removing the burned gases from the cylinder. The piston stroke in two strokes engine is longer because part of the compression and expansion strokes are used for the process of exhaust and induction. Fig. 8-1 shows a section of a common type of two stroke engine.
Figure (8 – 1) The two – stroke engine
In Figure(8-1a) the piston is shown near the end of compression stroke. The upward motion has decompressed the crank – case and air has been admitted through the self-acting valve to the crank-case. During the expansion stroke the air in the crank-case is compressed, and near the end of this stroke (b) the exhaust port is uncovered to allow the hot gases to blow down the exhaust duct. Further movement of the piston uncovers the inlet port (c), and compressed air from the crank-case flows into the cylinder. The exhaust and inlet ports are open simultaneously for a short period so that the incoming air can assist in cleaning the cylinder from combustion products.
Figure (8 – 2) (a) Cross scavenging; (b) MAN loop scavenging; (c) Schnuerle loop scavenging; (d) Curtiss loop scavenging.
The piston can be shaped to deflect the fresh gas across the cylinder to assist the
"scavenging" of the cylinder; this is called cross-flow scavenging (Fig 8-2a). The scavenging may be done by using two transfer ports (Fig 8-2c) which direct the
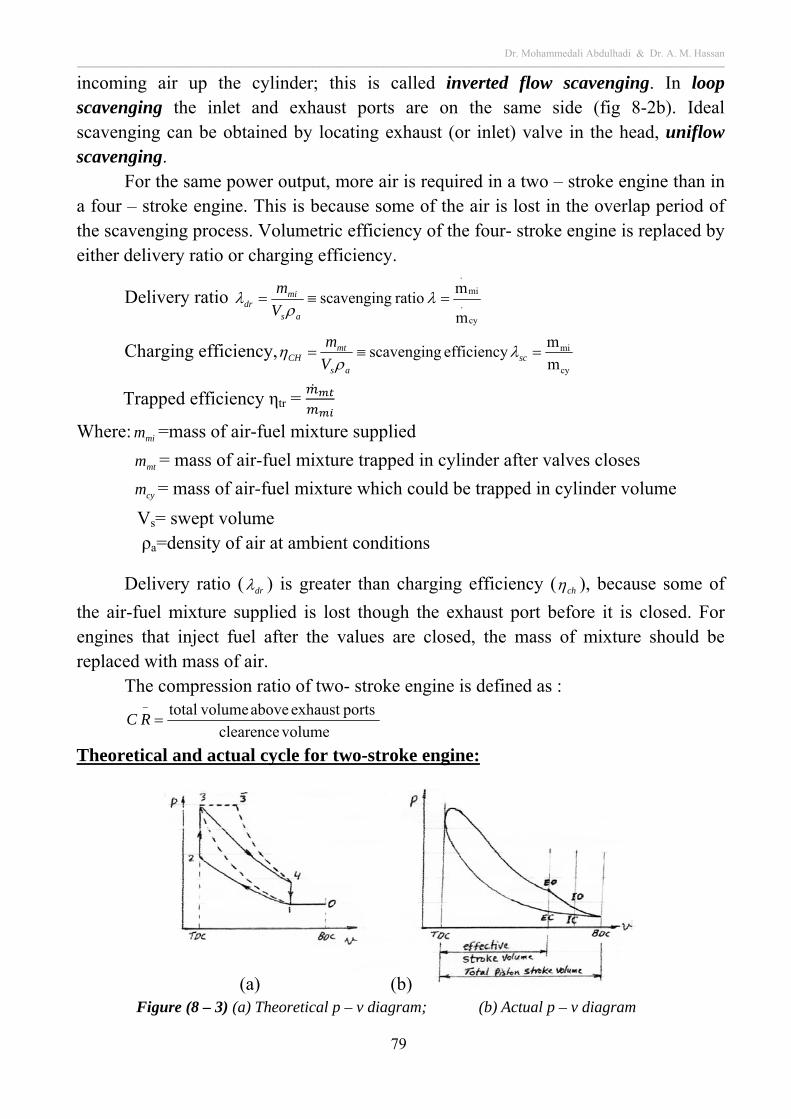
Dr. Mohammedali Abdulhadi & Dr. A. M. Hassan ــــــــــــــــــــــــــــــــــــــــــــــــــــــــــــــــــــــــــــــــــــــــــــــــــــــــــــــــــــــــــــــــــــــــــــــــــــــــــــــــــــــــــــــــــــــــــــــــــــــــــــــــــــــــــــــــــــــــــــــــــــــــــــــــــــــــــــــــــــــــــــــــــــــ
79
incoming air up the cylinder; this is called inverted flow scavenging. In loop scavenging the inlet and exhaust ports are on the same side (fig 8-2b). Ideal scavenging can be obtained by locating exhaust (or inlet) valve in the head, uniflow scavenging.
For the same power output, more air is required in a two – stroke engine than in a four – stroke engine. This is because some of the air is lost in the overlap period of the scavenging process. Volumetric efficiency of the four- stroke engine is replaced by either delivery ratio or charging efficiency.
Delivery ratio cy
.
mi
.
m
m ratio scavenging
as
midr V
m
Charging efficiency,cy
mi
m
m efficiency scavenging sc
as
mtCH V
m
Trapped efficiency ηtr =
Where: mim =mass of air-fuel mixture supplied
mtm = mass of air-fuel mixture trapped in cylinder after valves closes
cym = mass of air-fuel mixture which could be trapped in cylinder volume
Vs= swept volume ρa=density of air at ambient conditions
Delivery ratio ( dr ) is greater than charging efficiency ( ch ), because some of
the air-fuel mixture supplied is lost though the exhaust port before it is closed. For engines that inject fuel after the values are closed, the mass of mixture should be replaced with mass of air.
The compression ratio of two- stroke engine is defined as :
volumeclearence
portsexhaust above volumetotal
RC
Theoretical and actual cycle for two-stroke engine:
(a) (b) Figure (8 – 3) (a) Theoretical p – v diagram; (b) Actual p – v diagram
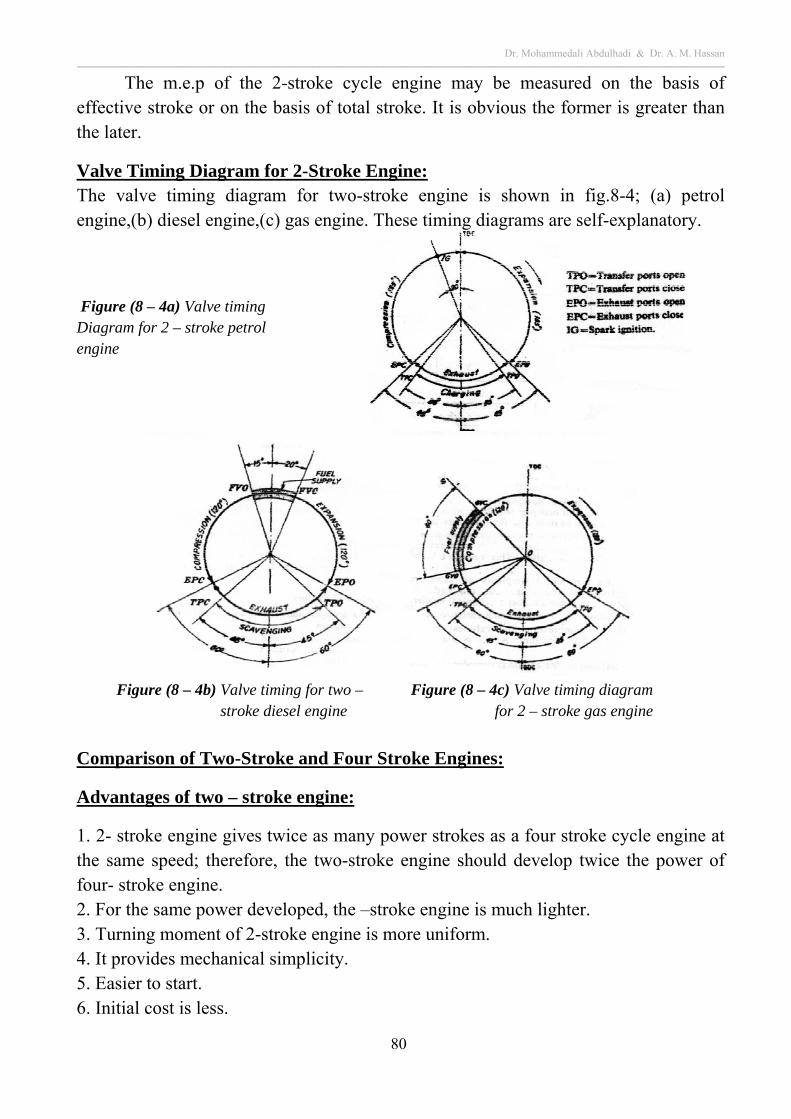
Dr. Mohammedali Abdulhadi & Dr. A. M. Hassan ــــــــــــــــــــــــــــــــــــــــــــــــــــــــــــــــــــــــــــــــــــــــــــــــــــــــــــــــــــــــــــــــــــــــــــــــــــــــــــــــــــــــــــــــــــــــــــــــــــــــــــــــــــــــــــــــــــــــــــــــــــــــــــــــــــــــــــــــــــــــــــــــــــــ
80
The m.e.p of the 2-stroke cycle engine may be measured on the basis of effective stroke or on the basis of total stroke. It is obvious the former is greater than the later.
Valve Timing Diagram for 2-Stroke Engine: The valve timing diagram for two-stroke engine is shown in fig.8-4; (a) petrol engine,(b) diesel engine,(c) gas engine. These timing diagrams are self-explanatory.
Figure (8 – 4a) Valve timing Diagram for 2 – stroke petrol engine
Figure (8 – 4b) Valve timing for two – Figure (8 – 4c) Valve timing diagram stroke diesel engine for 2 – stroke gas engine
Comparison of Two-Stroke and Four Stroke Engines:
Advantages of two – stroke engine:
1. 2- stroke engine gives twice as many power strokes as a four stroke cycle engine at the same speed; therefore, the two-stroke engine should develop twice the power of four- stroke engine. 2. For the same power developed, the –stroke engine is much lighter. 3. Turning moment of 2-stroke engine is more uniform. 4. It provides mechanical simplicity. 5. Easier to start. 6. Initial cost is less.
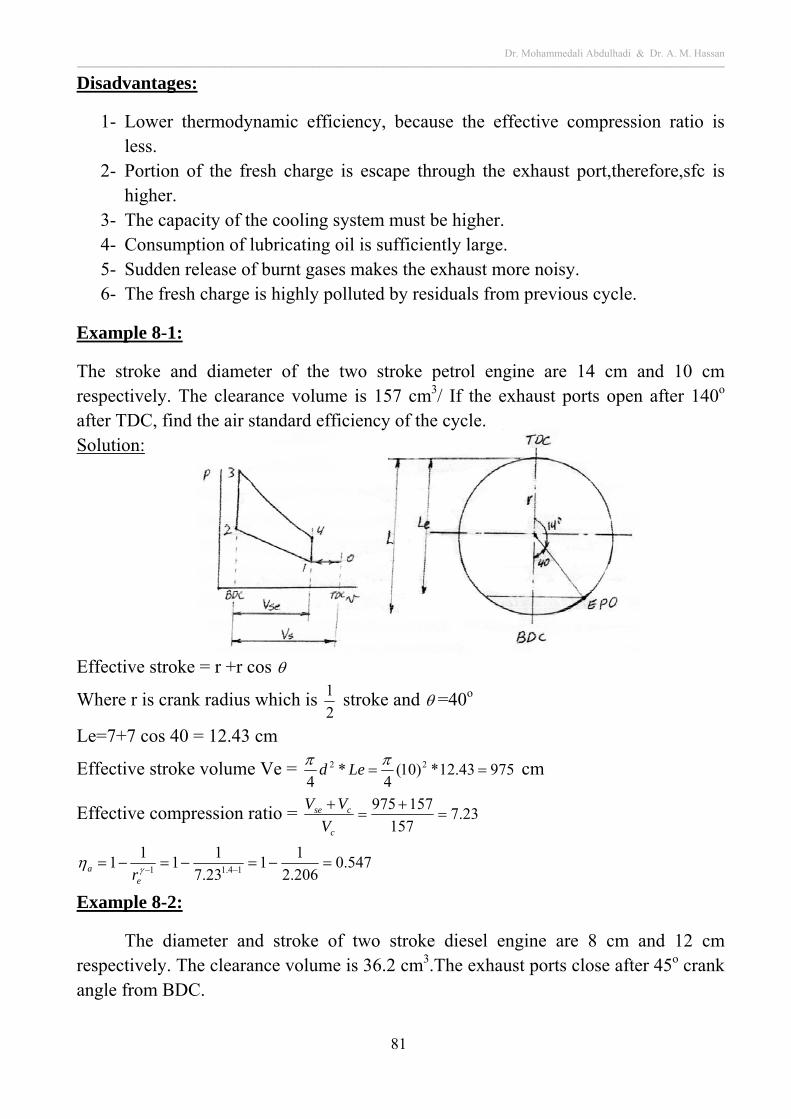
Dr. Mohammedali Abdulhadi & Dr. A. M. Hassan ــــــــــــــــــــــــــــــــــــــــــــــــــــــــــــــــــــــــــــــــــــــــــــــــــــــــــــــــــــــــــــــــــــــــــــــــــــــــــــــــــــــــــــــــــــــــــــــــــــــــــــــــــــــــــــــــــــــــــــــــــــــــــــــــــــــــــــــــــــــــــــــــــــــ
81
Disadvantages:
1- Lower thermodynamic efficiency, because the effective compression ratio is less.
2- Portion of the fresh charge is escape through the exhaust port,therefore,sfc is higher.
3- The capacity of the cooling system must be higher. 4- Consumption of lubricating oil is sufficiently large. 5- Sudden release of burnt gases makes the exhaust more noisy. 6- The fresh charge is highly polluted by residuals from previous cycle.
Example 8-1:
The stroke and diameter of the two stroke petrol engine are 14 cm and 10 cm respectively. The clearance volume is 157 cm3/ If the exhaust ports open after 140o after TDC, find the air standard efficiency of the cycle. Solution: Effective stroke = r +r cos
Where r is crank radius which is 2
1 stroke and =40o
Le=7+7 cos 40 = 12.43 cm
Effective stroke volume Ve = 97543.12*)10(4
*4
22
Led cm
Effective compression ratio = 23.7157
157975
c
cse
V
VV
547.0206.2
11
23.7
11
11
14.11
ea r
Example 8-2:
The diameter and stroke of two stroke diesel engine are 8 cm and 12 cm respectively. The clearance volume is 36.2 cm3.The exhaust ports close after 45o crank angle from BDC.
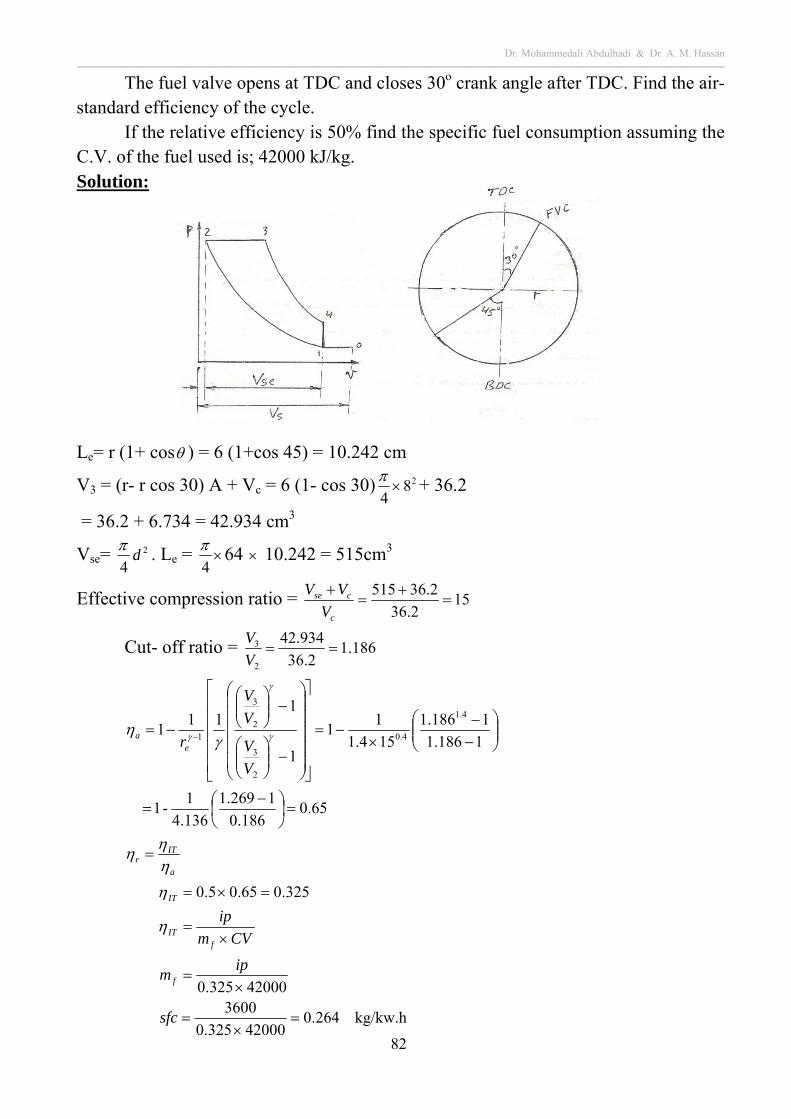
Dr. Mohammedali Abdulhadi & Dr. A. M. Hassan ــــــــــــــــــــــــــــــــــــــــــــــــــــــــــــــــــــــــــــــــــــــــــــــــــــــــــــــــــــــــــــــــــــــــــــــــــــــــــــــــــــــــــــــــــــــــــــــــــــــــــــــــــــــــــــــــــــــــــــــــــــــــــــــــــــــــــــــــــــــــــــــــــــــ
82
kg/kw.h 264.042000325.0
360042000325.0
325.065.05.0
sfc
ipm
CVm
ip
f
fIT
IT
The fuel valve opens at TDC and closes 30o crank angle after TDC. Find the air-standard efficiency of the cycle.
If the relative efficiency is 50% find the specific fuel consumption assuming the C.V. of the fuel used is; 42000 kJ/kg. Solution: Le= r (1+ cos ) = 6 (1+cos 45) = 10.242 cm
V3 = (r- r cos 30) A + Vc = 6 (1- cos 30) 284
+ 36.2
= 36.2 + 6.734 = 42.934 cm3
Vse= 2
4d
. Le = 4
64 10.242 = 515cm3
Effective compression ratio = 152.36
2.36515
c
cse
V
VV
Cut- off ratio = 186.12.36
934.42
2
3 V
V
a
ITr
ea
V
V
V
V
r
65.0186.0
1269.1
4.136
1 -1
1186.1
1186.1
154.1
11
1
111
14.1
4.0
2
3
2
3
1
Dr. Mohammedali Abdulhadi & Dr. A. M. Hassan ــــــــــــــــــــــــــــــــــــــــــــــــــــــــــــــــــــــــــــــــــــــــــــــــــــــــــــــــــــــــــــــــــــــــــــــــــــــــــــــــــــــــــــــــــــــــــــــــــــــــــــــــــــــــــــــــــــــــــــــــــــــــــــــــــــــــــــــــــــــــــــــــــــــ
83
612.016.102356.0
01673.0
as
mtCH PV
m
Example 8-3:
A 2-stroke diesel engine having bore 10 cm, stroke 12 cm, compression ratio 16:1, runs at 1500 rpm. During trail run of the engine, the following observations were made:
Atmospheric pressure 103 kPa Atmospheric temperature 35oC Air supplied by blower = 125 kg/hr If the scavenging efficiency of the engine is 57.4%, calculate the scavenging
ratio, trapped efficiency, and charging efficient. Solution:
Scavenging efficiency = sccy
mt
m
m
mcy=Vcy Pa
sscy VVr
rV
116
16
1
Scavenging ratio 19.116.1025133.03600
125
cy
mi
m
m
Trapped efficiency 4818.0125
360001673.0
mi
mttrap m
m
Example 8-4:
A 2-stroke single cylinder diesel engine has a bore 125 mm, stroke 150 mm, compression ratio 15:1, runs on 1800 rpm, the atmospheric conditions are 300 k and 1 atm. The trapping efficiency is 60%, air / fuel ratio= 30:1, LCV = 43000 kJ/kg, imep = 4.36 bar and IT =35%. Evaluate:
a) Scavenging ratio b) charging efficiency c) Delivery ratio d) scavenging efficiency
kg/s 01673.016.1025133.0574.0
/m 025133.002356.015
16
.min/m 1.4136or /m 02356.0160
1500
100
12
100
10
4
kg/m 16.1308287.0
103
.
3.
332
.
3
cyscmt
cy
S
a
as
mtCH
mm
sV
sV
RT
P
PV
m
Dr. Mohammedali Abdulhadi & Dr. A. M. Hassan ــــــــــــــــــــــــــــــــــــــــــــــــــــــــــــــــــــــــــــــــــــــــــــــــــــــــــــــــــــــــــــــــــــــــــــــــــــــــــــــــــــــــــــــــــــــــــــــــــــــــــــــــــــــــــــــــــــــــــــــــــــــــــــــــــــــــــــــــــــــــــــــــــــــ
84
Solution:
055.0160
1800
1000
150
1000
125
4
2.
sV m3/s
0591.0055.014
15
1
.
scy Vr
rV m3/s
161.1300287.0
100
a
24055.010036.4..
si Vppi kW
0016.04300035.0
24
LCV
ipm
ITf
kg/s
048.0300016.0 F
Amm fmt kg/s
08.06.0
048.0 mi
mi
mttrap m
m
m kg/s
a) 169.10684.0
08.0
16.10591.0
08.0
cy
mi
m
m
b) 75.23%or 7523.016.1055.0
048.0
as
mtCH V
m
c) 25.10638.0
08.0
as
midr V
m
d) 70%or 7.00684.0
048.0
cy
mtsc m
m
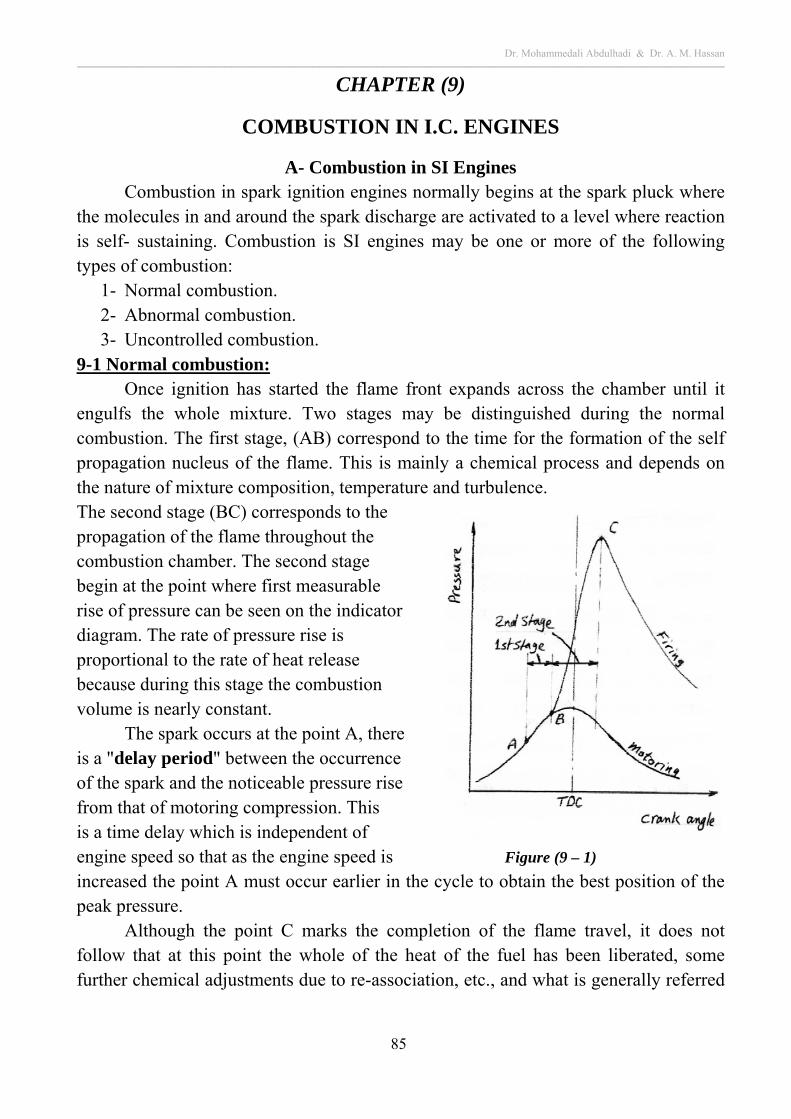
Dr. Mohammedali Abdulhadi & Dr. A. M. Hassan ــــــــــــــــــــــــــــــــــــــــــــــــــــــــــــــــــــــــــــــــــــــــــــــــــــــــــــــــــــــــــــــــــــــــــــــــــــــــــــــــــــــــــــــــــــــــــــــــــــــــــــــــــــــــــــــــــــــــــــــــــــــــــــــــــــــــــــــــــــــــــــــــــــــ
85
CHAPTER (9)
COMBUSTION IN I.C. ENGINES
A- Combustion in SI Engines Combustion in spark ignition engines normally begins at the spark pluck where
the molecules in and around the spark discharge are activated to a level where reaction is self- sustaining. Combustion is SI engines may be one or more of the following types of combustion:
1- Normal combustion. 2- Abnormal combustion. 3- Uncontrolled combustion.
9-1 Normal combustion: Once ignition has started the flame front expands across the chamber until it
engulfs the whole mixture. Two stages may be distinguished during the normal combustion. The first stage, (AB) correspond to the time for the formation of the self propagation nucleus of the flame. This is mainly a chemical process and depends on the nature of mixture composition, temperature and turbulence. The second stage (BC) corresponds to the propagation of the flame throughout the combustion chamber. The second stage begin at the point where first measurable rise of pressure can be seen on the indicator diagram. The rate of pressure rise is proportional to the rate of heat release because during this stage the combustion volume is nearly constant.
The spark occurs at the point A, there is a "delay period" between the occurrence of the spark and the noticeable pressure rise from that of motoring compression. This is a time delay which is independent of engine speed so that as the engine speed is Figure (9 – 1)
increased the point A must occur earlier in the cycle to obtain the best position of the peak pressure.
Although the point C marks the completion of the flame travel, it does not follow that at this point the whole of the heat of the fuel has been liberated, some further chemical adjustments due to re-association, etc., and what is generally referred
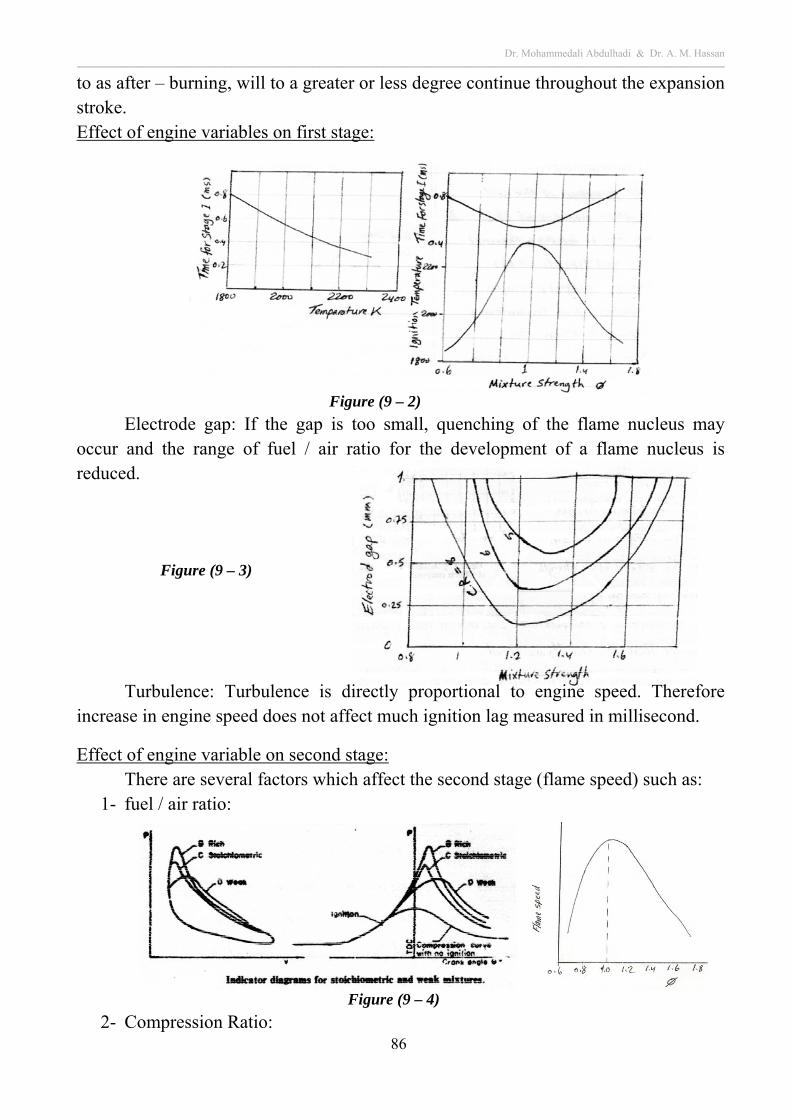
Dr. Mohammedali Abdulhadi & Dr. A. M. Hassan ــــــــــــــــــــــــــــــــــــــــــــــــــــــــــــــــــــــــــــــــــــــــــــــــــــــــــــــــــــــــــــــــــــــــــــــــــــــــــــــــــــــــــــــــــــــــــــــــــــــــــــــــــــــــــــــــــــــــــــــــــــــــــــــــــــــــــــــــــــــــــــــــــــــ
86
to as after – burning, will to a greater or less degree continue throughout the expansion stroke. Effect of engine variables on first stage:
Figure (9 – 2)
Electrode gap: If the gap is too small, quenching of the flame nucleus may occur and the range of fuel / air ratio for the development of a flame nucleus is reduced.
Figure (9 – 3)
Turbulence: Turbulence is directly proportional to engine speed. Therefore increase in engine speed does not affect much ignition lag measured in millisecond.
Effect of engine variable on second stage: There are several factors which affect the second stage (flame speed) such as:
1- fuel / air ratio:
Figure (9 – 4)
2- Compression Ratio:
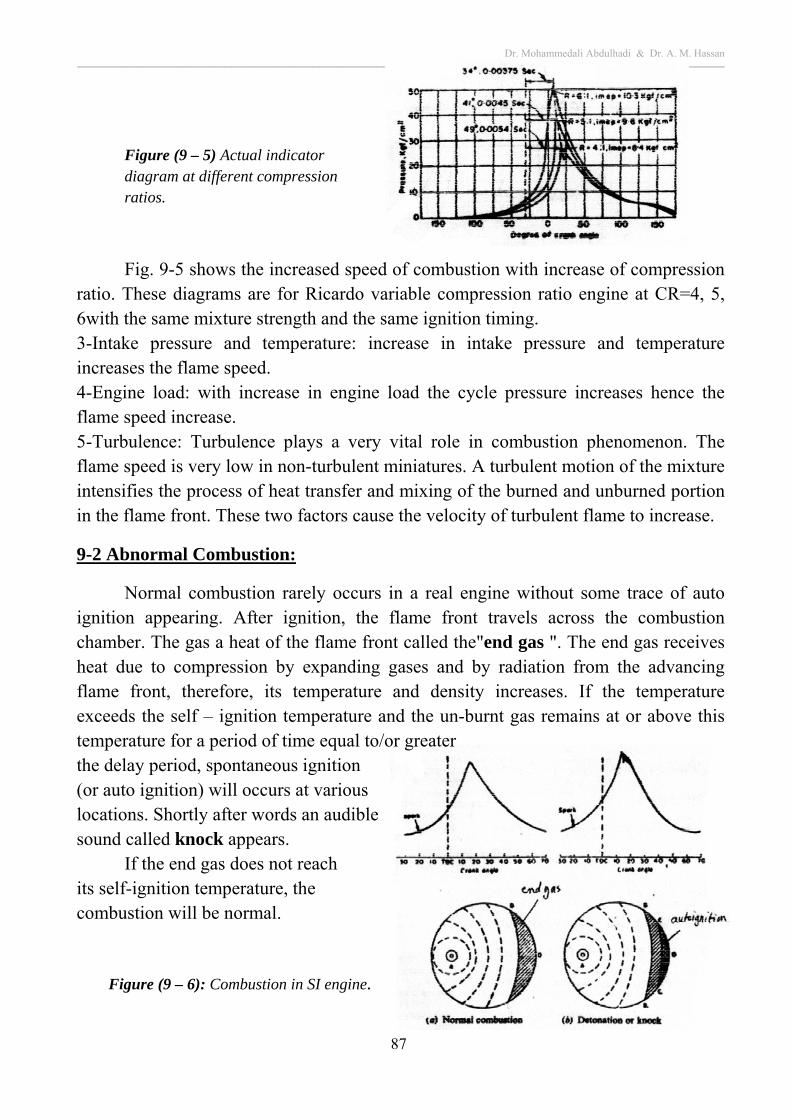
Dr. Mohammedali Abdulhadi & Dr. A. M. Hassan ــــــــــــــــــــــــــــــــــــــــــــــــــــــــــــــــــــــــــــــــــــــــــــــــــــــــــــــــــــــــــــــــــــــــــــــــــــــــــــــــــــــــــــــــــــــــــــــــــــــــــــــــــــــــــــــــــــــــــــــــــــــــــــــــــــــــــــــــــــــــــــــــــــــ
87
Figure (9 – 5) Actual indicator diagram at different compression ratios.
Fig. 9-5 shows the increased speed of combustion with increase of compression
ratio. These diagrams are for Ricardo variable compression ratio engine at CR=4, 5, 6with the same mixture strength and the same ignition timing. 3-Intake pressure and temperature: increase in intake pressure and temperature increases the flame speed. 4-Engine load: with increase in engine load the cycle pressure increases hence the flame speed increase. 5-Turbulence: Turbulence plays a very vital role in combustion phenomenon. The flame speed is very low in non-turbulent miniatures. A turbulent motion of the mixture intensifies the process of heat transfer and mixing of the burned and unburned portion in the flame front. These two factors cause the velocity of turbulent flame to increase.
9-2 Abnormal Combustion:
Normal combustion rarely occurs in a real engine without some trace of auto ignition appearing. After ignition, the flame front travels across the combustion chamber. The gas a heat of the flame front called the"end gas ". The end gas receives heat due to compression by expanding gases and by radiation from the advancing flame front, therefore, its temperature and density increases. If the temperature exceeds the self – ignition temperature and the un-burnt gas remains at or above this temperature for a period of time equal to/or greater the delay period, spontaneous ignition (or auto ignition) will occurs at various locations. Shortly after words an audible sound called knock appears.
If the end gas does not reach its self-ignition temperature, the combustion will be normal.
Figure (9 – 6): Combustion in SI engine.
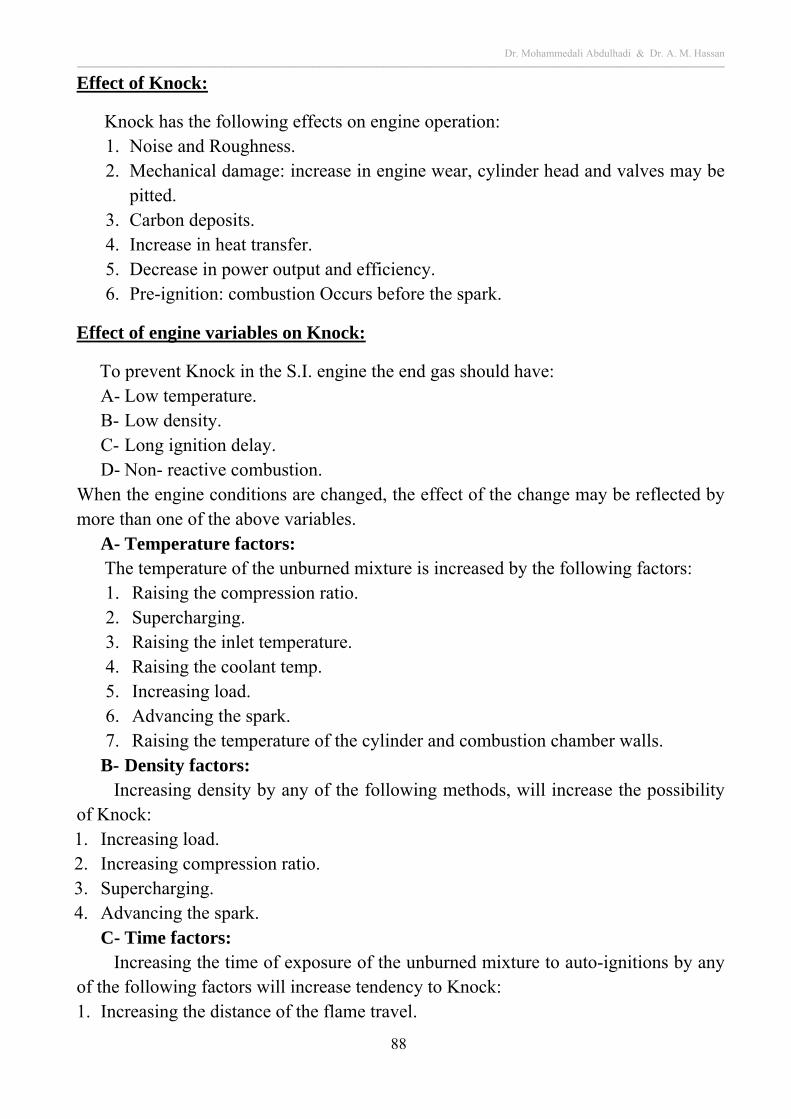
Dr. Mohammedali Abdulhadi & Dr. A. M. Hassan ــــــــــــــــــــــــــــــــــــــــــــــــــــــــــــــــــــــــــــــــــــــــــــــــــــــــــــــــــــــــــــــــــــــــــــــــــــــــــــــــــــــــــــــــــــــــــــــــــــــــــــــــــــــــــــــــــــــــــــــــــــــــــــــــــــــــــــــــــــــــــــــــــــــ
88
Effect of Knock:
Knock has the following effects on engine operation: 1. Noise and Roughness. 2. Mechanical damage: increase in engine wear, cylinder head and valves may be
pitted. 3. Carbon deposits. 4. Increase in heat transfer. 5. Decrease in power output and efficiency. 6. Pre-ignition: combustion Occurs before the spark.
Effect of engine variables on Knock:
To prevent Knock in the S.I. engine the end gas should have: A- Low temperature. B- Low density. C- Long ignition delay. D- Non- reactive combustion.
When the engine conditions are changed, the effect of the change may be reflected by more than one of the above variables.
A- Temperature factors: The temperature of the unburned mixture is increased by the following factors:
1. Raising the compression ratio. 2. Supercharging. 3. Raising the inlet temperature. 4. Raising the coolant temp. 5. Increasing load. 6. Advancing the spark. 7. Raising the temperature of the cylinder and combustion chamber walls.
B- Density factors: Increasing density by any of the following methods, will increase the possibility of Knock: 1. Increasing load. 2. Increasing compression ratio. 3. Supercharging. 4. Advancing the spark.
C- Time factors: Increasing the time of exposure of the unburned mixture to auto-ignitions by any of the following factors will increase tendency to Knock: 1. Increasing the distance of the flame travel.
Dr. Mohammedali Abdulhadi & Dr. A. M. Hassan ــــــــــــــــــــــــــــــــــــــــــــــــــــــــــــــــــــــــــــــــــــــــــــــــــــــــــــــــــــــــــــــــــــــــــــــــــــــــــــــــــــــــــــــــــــــــــــــــــــــــــــــــــــــــــــــــــــــــــــــــــــــــــــــــــــــــــــــــــــــــــــــــــــــ
89
2001704.03238.011619.01
221.6100100
TTT
TaboveON
2. Decreasing the turbulence of mixture. 3. Decreasing the speed of the engine.
D- Composition: The probability of Knock in S.I. engines is decreased by: 1. Increasing the octane rating of the fuel. 2. Either rich or lean mixtures. 3. Stratifying the mixture. 4. Increasing the humidity of the entering air.
9-3 Knock rating of S.I. Fuels:
The Knock rating of a gasoline is found by comparing the Knock of the fuel under test with that of a blend of primary reference fuels (PRF). These fuels are n- heptane (C7H16), which have a very low auto ignition reaction time and treated as fuel with octane number (ON) of O and 2,2,4- trimethyl pentane (iso- octane), which has inactive auto ignition reaction and is treated as ON equal to 100. The fuel is rated by the percent of iso - octane in the n- heptane and iso- octane mixture. The scale of octane rating is extended above 100 by adding Tetra- ethyl- lead (TEL) to iso- octane, and:
Where T = ml TEL/ lt There are several methods of Knock rating to suit the various matching conditions for different engines and operating variables, and in each of these methods, a standard engine built to exacting specifications must be run under prescribed operating conditions. The standard engine used for either the research or motor method is the CFR (Co - operative Fuel research) engine. Motor and research methods: the engine must first be calibrated under specified conditions, such as those indicated below:
Test method Engine speed (rpm)
Coolant temp. (C) A/f ratio Spark timing (bTDC)
Research 600 100 Max 13 Motor 900 100 Max 14-26
The sensitivity of a fuel to knock is measured by the difference in the two knock ratings; the greater the difference the greater the fuel sensitivity. The Octane rating of fuel is lower in the motor method than in the research method.
Dr. Mohammedali Abdulhadi & Dr. A. M. Hassan ــــــــــــــــــــــــــــــــــــــــــــــــــــــــــــــــــــــــــــــــــــــــــــــــــــــــــــــــــــــــــــــــــــــــــــــــــــــــــــــــــــــــــــــــــــــــــــــــــــــــــــــــــــــــــــــــــــــــــــــــــــــــــــــــــــــــــــــــــــــــــــــــــــــ
90
Influence of fuel additive on knock:
It is the possible to raise the Octane number of fuel by refining methods alone, but these methods are in general expensive. These additives are used to raise ON of the fuel, control surface ignition, reduce spark plug fouling, resist gum formation, prevent rust, reduce carburetor icing, remove carburetor or injector deposits, minimize deposits in intake system, and prevent valve sticking. The most effective antiknock agents are lead alkyls. Tetraethyl lead (TEL), (C2H5)4 Pb, was first introduced in 1923. Tetramethyl lead (TML), (CH3)4 Pb, was introduced in 1960. In 1959 manganese antiknock compound (methylcyclopentadienyl manganese tricarbonyl), MMT, was introduced. The intereste in unleaded gasoline was started in 1970 because of the issue of legislation in many developing countries which control harmful pollutants. Lead has toxicological effect in the urban environment and the use of catalytic devices for emission control was introduced. The expanding use of unleaded fuels has increased interest in other methods of increasing the ON of gasoline, one of these methods is; the oxygenates (alcohols and ethers) as fuel additives to increase Octane rating.
9-4 Uncontrolled Combustion:
Under certain conditions the fuel- air mixture is ignited by hot spot in the cylinder. The hot spot might be the spark plug insulator or electrode, or combustion deposits etc…. When ignition occurs before the spark the phenomenon is called pre-ignition. When the phenomenon occurs after ignition is switched off it is called running- on. Combustion deposit ignition is called rumbling.
B- Combustion in CI engines: In compression ignition engine usually air is drawn during intake stroke. A compression ratio between 12 and 20 is used, so that temperature of the air near the end of compression stroke is quite high. Just before TDC, fuel is sprayed into the combustion chamber. This spray of fuel with the aid air movement distributes the fuel through the air. Owing to the high temperature of the air, the fuel ignites and burns almost as soon as introduced. Since the cylinder contents are not homogeneous (heterogeneous). They vary from fuel, F/A combustion products mixture to air alone in different regions. These regions may exist close to each other. Because of the dependence of combustion on the process of the fuel finding oxygen, C.I. engines require excess air to a greater extent than do S.I. engines if high efficiency and low smoke levels are to be achieved.
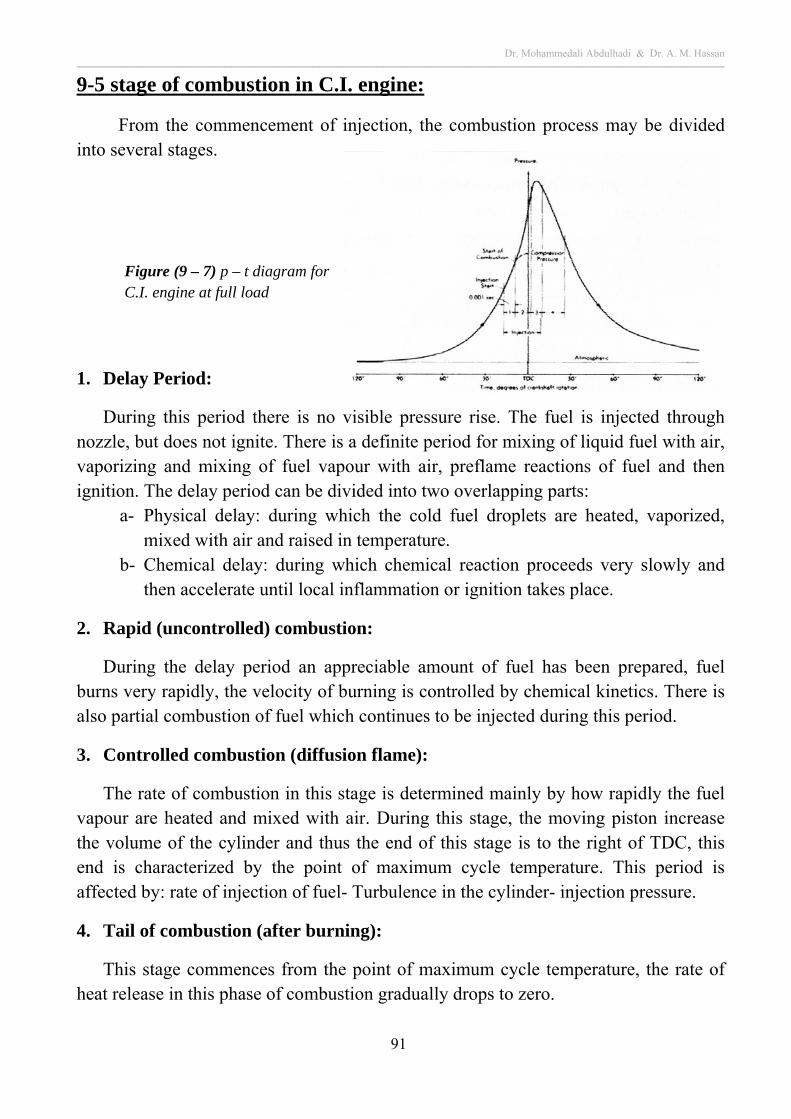
Dr. Mohammedali Abdulhadi & Dr. A. M. Hassan ــــــــــــــــــــــــــــــــــــــــــــــــــــــــــــــــــــــــــــــــــــــــــــــــــــــــــــــــــــــــــــــــــــــــــــــــــــــــــــــــــــــــــــــــــــــــــــــــــــــــــــــــــــــــــــــــــــــــــــــــــــــــــــــــــــــــــــــــــــــــــــــــــــــ
91
9-5 stage of combustion in C.I. engine:
From the commencement of injection, the combustion process may be divided into several stages.
Figure (9 – 7) p – t diagram for C.I. engine at full load
1. Delay Period:
During this period there is no visible pressure rise. The fuel is injected through nozzle, but does not ignite. There is a definite period for mixing of liquid fuel with air, vaporizing and mixing of fuel vapour with air, preflame reactions of fuel and then ignition. The delay period can be divided into two overlapping parts:
a- Physical delay: during which the cold fuel droplets are heated, vaporized, mixed with air and raised in temperature.
b- Chemical delay: during which chemical reaction proceeds very slowly and then accelerate until local inflammation or ignition takes place.
2. Rapid (uncontrolled) combustion:
During the delay period an appreciable amount of fuel has been prepared, fuel burns very rapidly, the velocity of burning is controlled by chemical kinetics. There is also partial combustion of fuel which continues to be injected during this period.
3. Controlled combustion (diffusion flame):
The rate of combustion in this stage is determined mainly by how rapidly the fuel vapour are heated and mixed with air. During this stage, the moving piston increase the volume of the cylinder and thus the end of this stage is to the right of TDC, this end is characterized by the point of maximum cycle temperature. This period is affected by: rate of injection of fuel- Turbulence in the cylinder- injection pressure.
4. Tail of combustion (after burning):
This stage commences from the point of maximum cycle temperature, the rate of heat release in this phase of combustion gradually drops to zero.
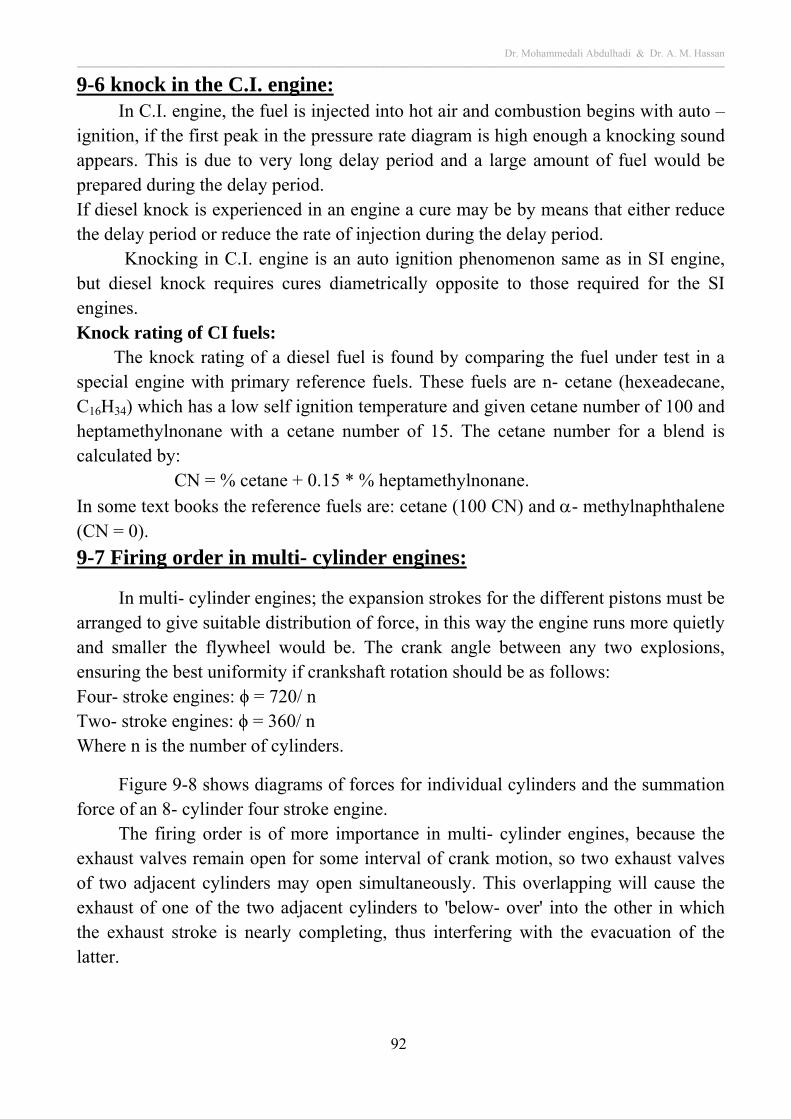
Dr. Mohammedali Abdulhadi & Dr. A. M. Hassan ــــــــــــــــــــــــــــــــــــــــــــــــــــــــــــــــــــــــــــــــــــــــــــــــــــــــــــــــــــــــــــــــــــــــــــــــــــــــــــــــــــــــــــــــــــــــــــــــــــــــــــــــــــــــــــــــــــــــــــــــــــــــــــــــــــــــــــــــــــــــــــــــــــــ
92
9-6 knock in the C.I. engine: In C.I. engine, the fuel is injected into hot air and combustion begins with auto – ignition, if the first peak in the pressure rate diagram is high enough a knocking sound appears. This is due to very long delay period and a large amount of fuel would be prepared during the delay period. If diesel knock is experienced in an engine a cure may be by means that either reduce the delay period or reduce the rate of injection during the delay period.
Knocking in C.I. engine is an auto ignition phenomenon same as in SI engine, but diesel knock requires cures diametrically opposite to those required for the SI engines. Knock rating of CI fuels: The knock rating of a diesel fuel is found by comparing the fuel under test in a special engine with primary reference fuels. These fuels are n- cetane (hexeadecane, C16H34) which has a low self ignition temperature and given cetane number of 100 and heptamethylnonane with a cetane number of 15. The cetane number for a blend is calculated by: CN = % cetane + 0.15 * % heptamethylnonane.
In some text books the reference fuels are: cetane (100 CN) and - methylnaphthalene (CN = 0).
9-7 Firing order in multi- cylinder engines:
In multi- cylinder engines; the expansion strokes for the different pistons must be arranged to give suitable distribution of force, in this way the engine runs more quietly and smaller the flywheel would be. The crank angle between any two explosions, ensuring the best uniformity if crankshaft rotation should be as follows: Four- stroke engines: ϕ = 720/ n Two- stroke engines: ϕ = 360/ n Where n is the number of cylinders.
Figure 9-8 shows diagrams of forces for individual cylinders and the summation force of an 8- cylinder four stroke engine. The firing order is of more importance in multi- cylinder engines, because the exhaust valves remain open for some interval of crank motion, so two exhaust valves of two adjacent cylinders may open simultaneously. This overlapping will cause the exhaust of one of the two adjacent cylinders to 'below- over' into the other in which the exhaust stroke is nearly completing, thus interfering with the evacuation of the latter.
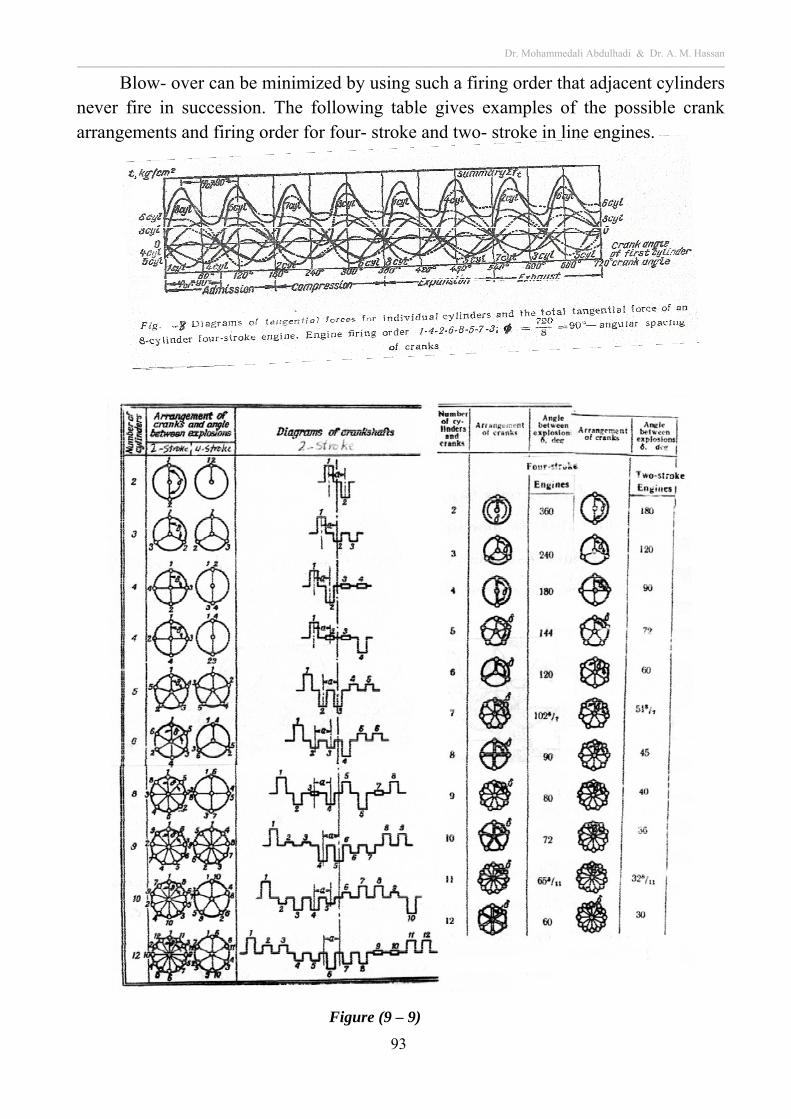
Dr. Mohammedali Abdulhadi & Dr. A. M. Hassan ــــــــــــــــــــــــــــــــــــــــــــــــــــــــــــــــــــــــــــــــــــــــــــــــــــــــــــــــــــــــــــــــــــــــــــــــــــــــــــــــــــــــــــــــــــــــــــــــــــــــــــــــــــــــــــــــــــــــــــــــــــــــــــــــــــــــــــــــــــــــــــــــــــــ
93
Blow- over can be minimized by using such a firing order that adjacent cylinders never fire in succession. The following table gives examples of the possible crank arrangements and firing order for four- stroke and two- stroke in line engines.
Figure (9 – 9)