dr shah april 2006
TRANSCRIPT
8/8/2019 Dr Shah April 2006
http://slidepdf.com/reader/full/dr-shah-april-2006 1/48
PRESENTATION ON
The Present Economic Outlookfor Pakistan
By
Ministry of Finance
Government of Pakistan
April, 2006
8/8/2019 Dr Shah April 2006
http://slidepdf.com/reader/full/dr-shah-april-2006 2/48
2
Outline of Presentation
Key Macroeconomic Challenges of the 1990s
How did we address those challenges
Where Are We Now?
Where do we want to see Pakistan in the next five years
Key Macroeconomic targets for the next five years
New Challenges
How to address new challenges
Concluding remarks
8/8/2019 Dr Shah April 2006
http://slidepdf.com/reader/full/dr-shah-april-2006 3/48
3
Overcoming macroeconomic challenges
• 1990s Macroeconomic Scenario – Macroeconomic imbalances leading to buildup of public debt,
deceleration of growth and investment, and stagnation in exports• Challenges of the 90s
– Improve macroeconomic environment
– Bring debt situation under control – Restore investor confidence – Revive economic growth – Restore financial sovereignty
• 2000-onwards: Two-pronged Strategy followed – Policies pursued to strengthen macroeconomic environment – Introducing wide-ranging structural reforms
8/8/2019 Dr Shah April 2006
http://slidepdf.com/reader/full/dr-shah-april-2006 4/48
4
Policies pursued to strengthen macroeconomicenvironment
•
Reducing “Twin Deficits”• Keeping inflation low• Building foreign exchange reserves• Maintaining stability in exchange rate•
Maintaining consistency and continuity in policies
8/8/2019 Dr Shah April 2006
http://slidepdf.com/reader/full/dr-shah-april-2006 5/48
5
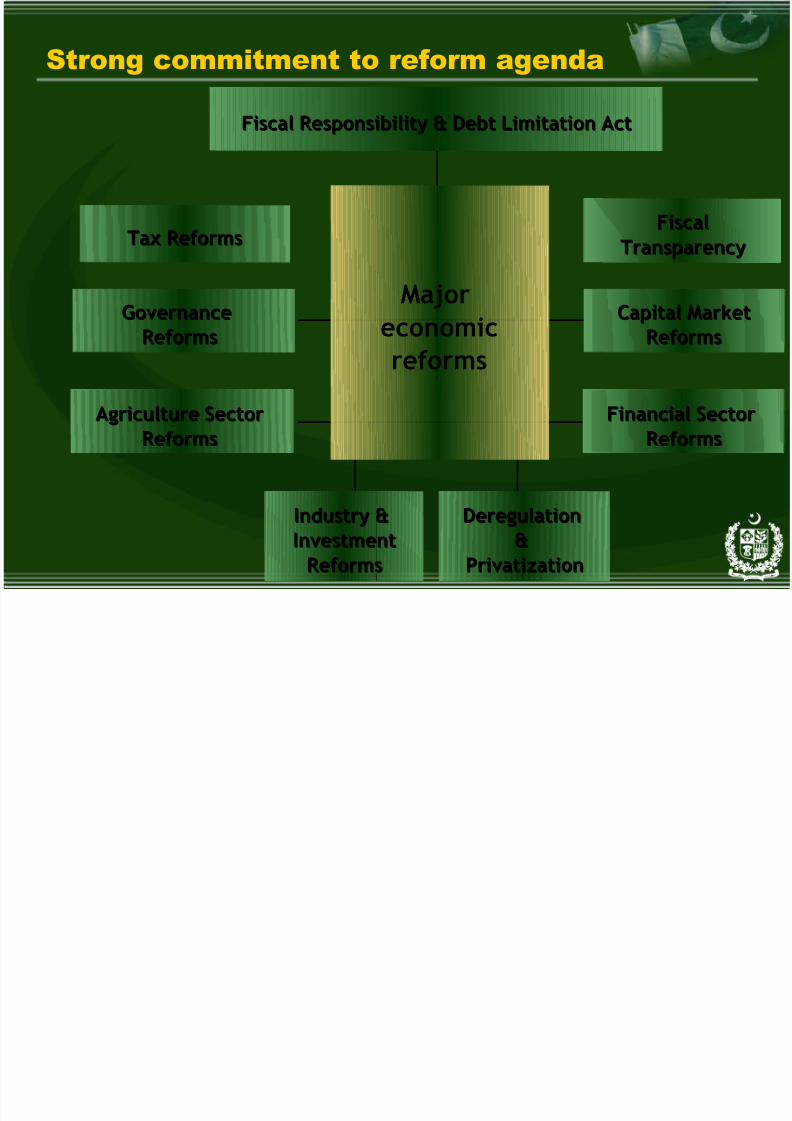
Strong commitment to reform agenda
Majoreconomicreforms
Tax ReformsTax Reforms
GovernanceGovernanceReformsReforms
Capital MarketCapital MarketReformsReforms
Industry &Industry &InvestmentInvestment
ReformsReforms
FiscalFiscalTransparencyTransparency
Agriculture SectorAgriculture SectorReformsReforms
Financial SectorFinancial SectorReformsReforms
DeregulationDeregulation&&
PrivatizationPrivatization
Fiscal Responsibility & Debt Limitation ActFiscal Responsibility & Debt Limitation Act
8/8/2019 Dr Shah April 2006
http://slidepdf.com/reader/full/dr-shah-april-2006 6/48
6
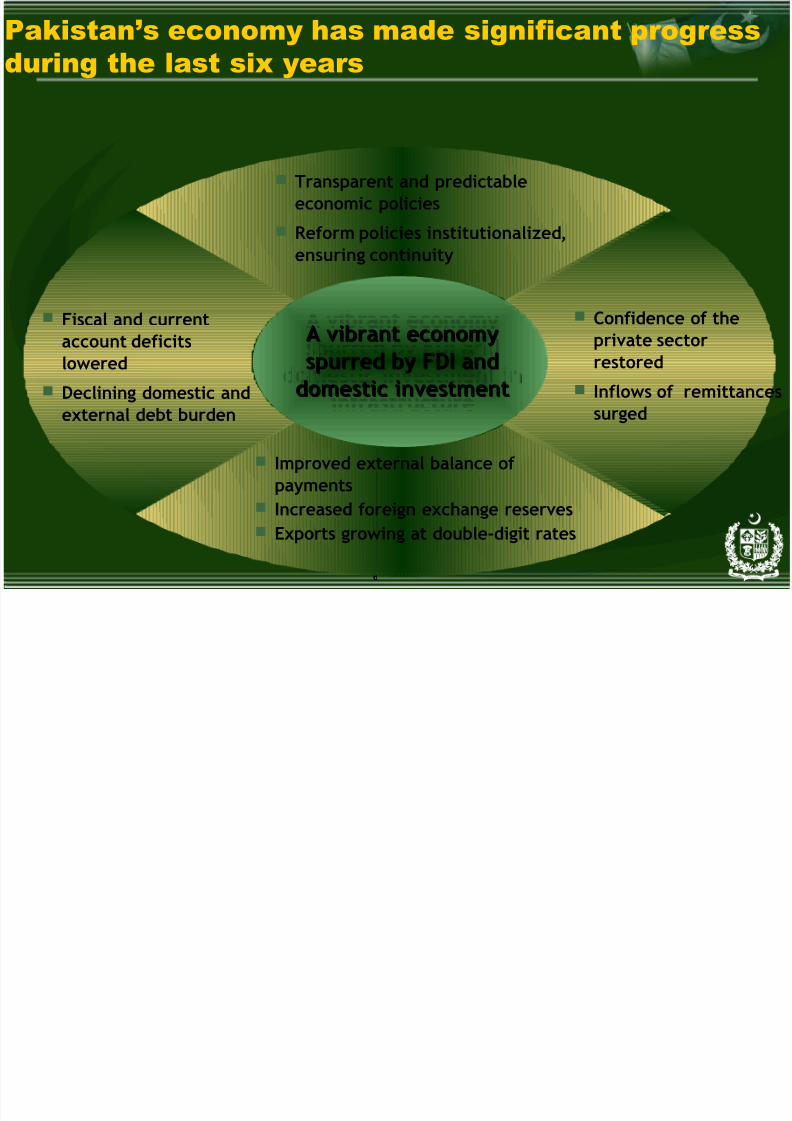
Improved external balance of paymentsIncreased foreign exchange reservesExports growing at double-digit rates
Pakistan’s economy has made significant progressduring the last six years
A vibrant economyA vibrant economyspurred by FDI andspurred by FDI and
domestic investment indomestic investment in
infrastructureinfrastructure
Transparent and predictableeconomic policies
Reform policies institutionalized,ensuring continuity
Confidence of theprivate sectorrestored
Inflows of remittances
surged
Fiscal and currentaccount deficitslowered
Declining domestic and
external debt burden
A vibrant economyA vibrant economyspurred by FDI andspurred by FDI and
domestic investmentdomestic investment
8/8/2019 Dr Shah April 2006
http://slidepdf.com/reader/full/dr-shah-april-2006 7/48
Where Are We Now ?
8/8/2019 Dr Shah April 2006
http://slidepdf.com/reader/full/dr-shah-april-2006 8/488
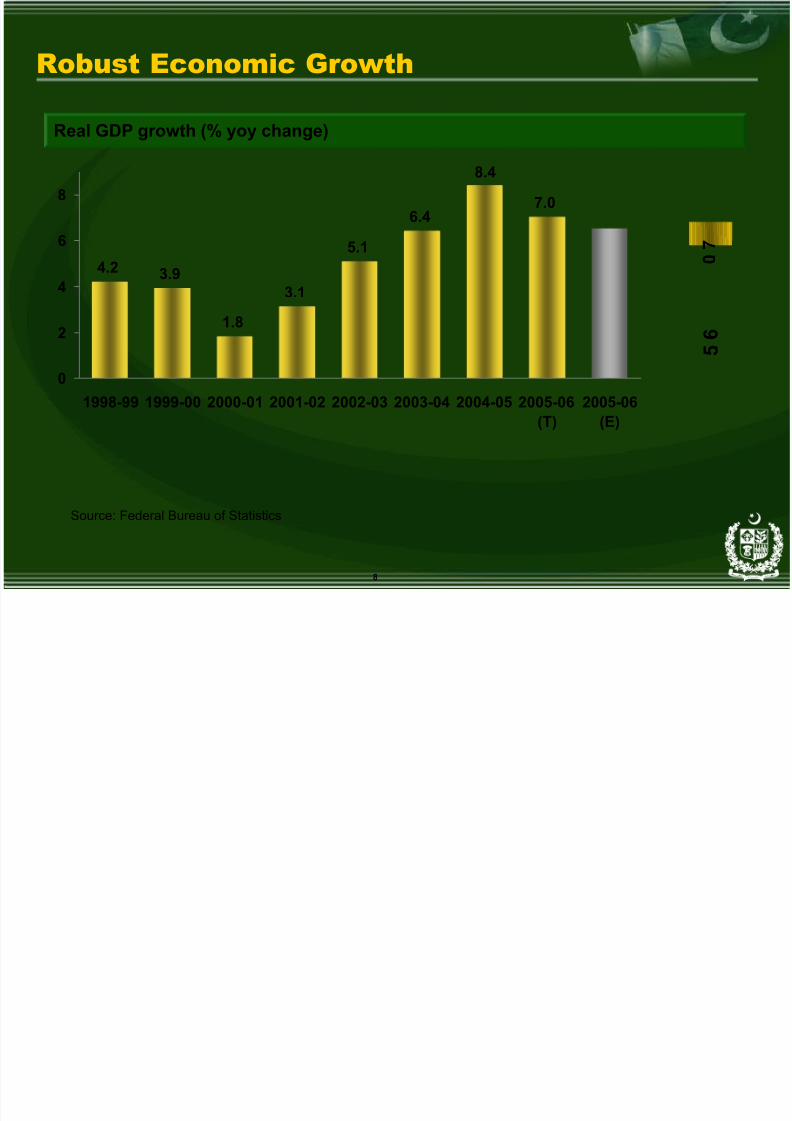
Robust Economic Growth
Real GDP growth (% yoy change)
4.23.9
1.8
3.1
5.1
6.47.0
8.4
0
2
4
6
8
1998-99 1999-00 2000-01 2001-02 2002-03 2003-04 2004-05 2005-06(T)
2005-06(E)
Source: Federal Bureau of Statistics
6 . 5
7 . 0
8/8/2019 Dr Shah April 2006
http://slidepdf.com/reader/full/dr-shah-april-2006 9/489
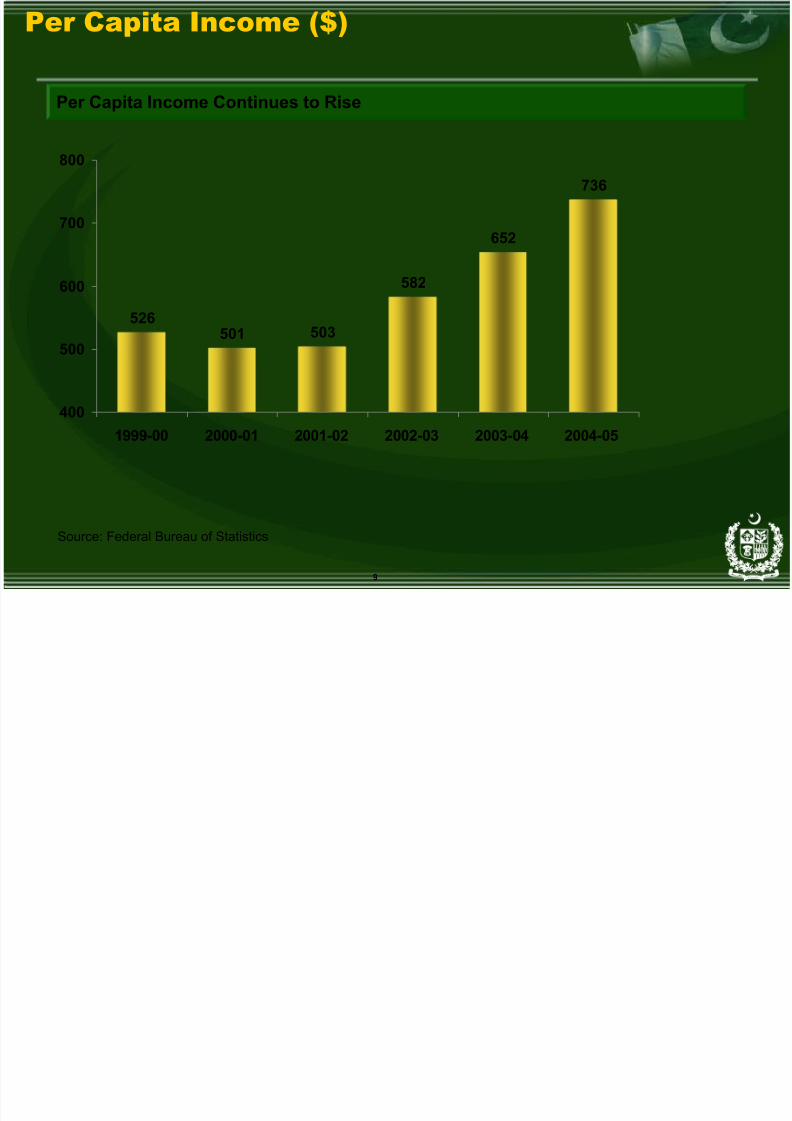
Per Capita Income ($)
526501 503
582
652
736
400
500
600
700
800
1999-00 2000-01 2001-02 2002-03 2003-04 2004-05
Per Capita Income Continues to Rise
Source: Federal Bureau of Statistics
8/8/2019 Dr Shah April 2006
http://slidepdf.com/reader/full/dr-shah-april-2006 10/4810
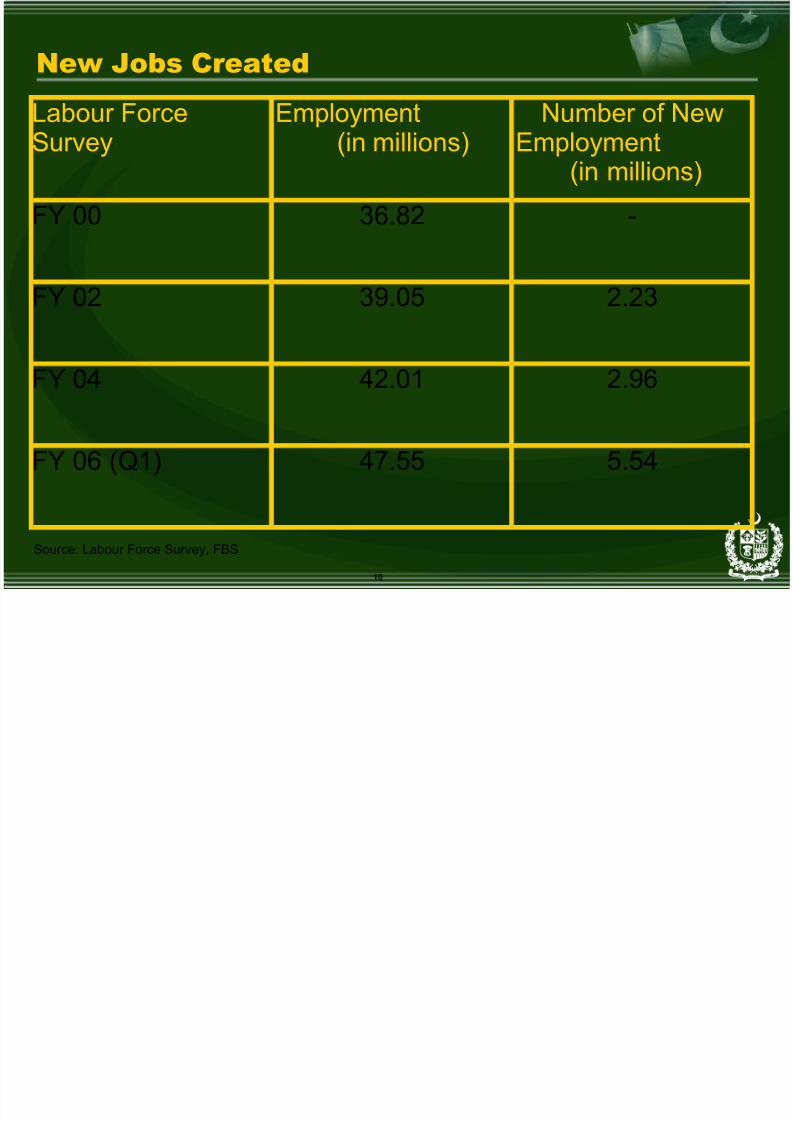
New Jobs Created
Labour ForceSurvey
Employment(in millions)
Number of NewEmployment
(in millions)
FY 00 36.82 -
FY 02 39.05 2.23
FY 04 42.01 2.96
FY 06 (Q1) 47.55 5.54
Source: Labour Force Survey, FBS
8/8/2019 Dr Shah April 2006
http://slidepdf.com/reader/full/dr-shah-april-2006 11/4811
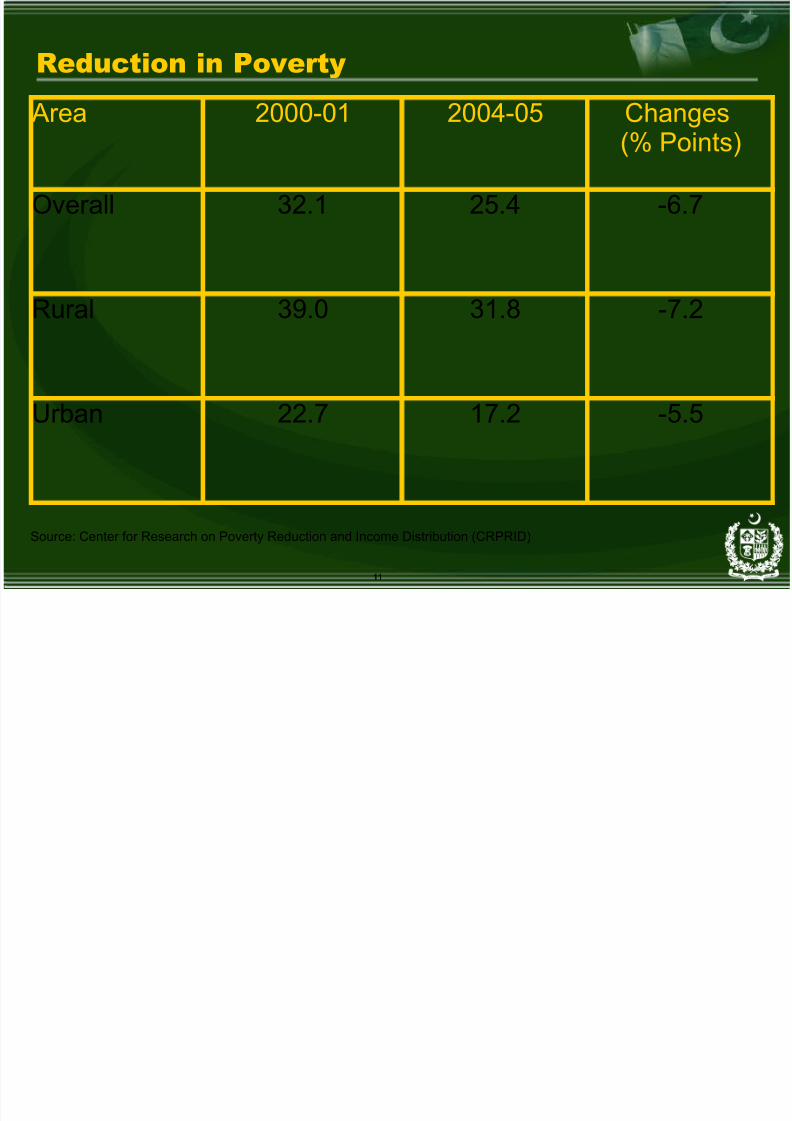
Reduction in Poverty
Area 2000-01 2004-05 Changes(% Points)
Overall 32.1 25.4 -6.7
Rural 39.0 31.8 -7.2
Urban 22.7 17.2 -5.5
Source: Center for Research on Poverty Reduction and Income Distribution (CRPRID)
8/8/2019 Dr Shah April 2006
http://slidepdf.com/reader/full/dr-shah-april-2006 12/4812
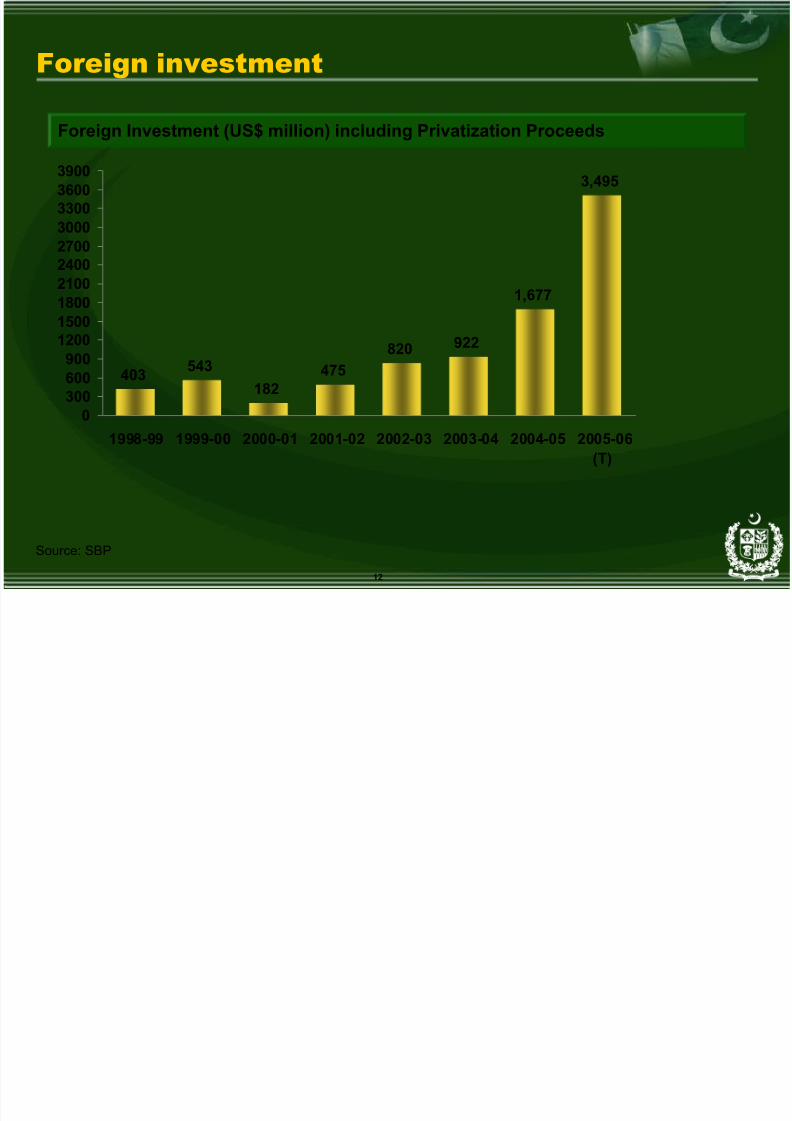
Foreign investment
Foreign Investment (US$ million) including Privatization Proceeds
Source: SBP
403 543182
475820 922
1,677
3,495
0
300600900
1200150018002100240027003000330036003900
1998-99 1999-00 2000-01 2001-02 2002-03 2003-04 2004-05 2005-06(T)
8/8/2019 Dr Shah April 2006
http://slidepdf.com/reader/full/dr-shah-april-2006 13/4813
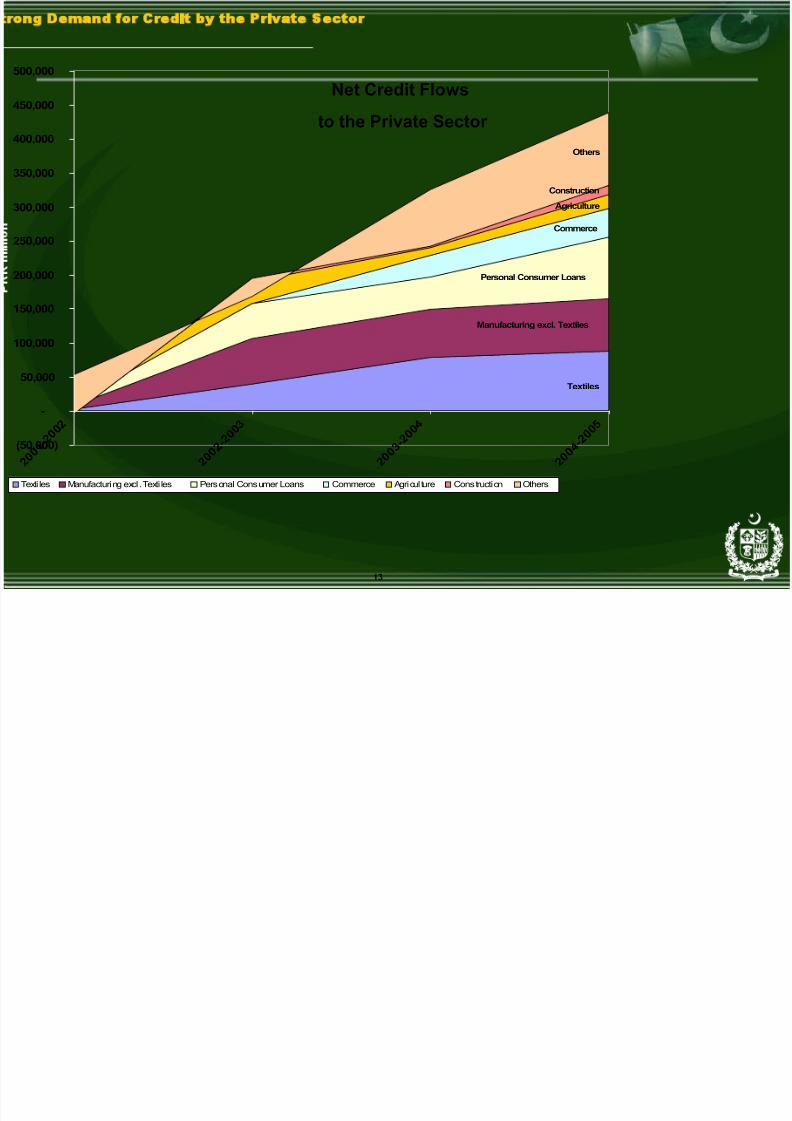
rong Demand for Credit by the Private Sector
Textiles
Manufacturing excl. Textiles
Personal Consumer Loans
Commerce
Agriculture
Construction
Others
(50,000)
-
50,000
100,000
150,000
200,000
250,000
300,000
350,000
400,000
450,000
500,000
2 0 0 1
- 2 0 0 2
2 0 0 2
- 2 0 0 3
2 0 0 3
- 2 0 0 4
2 0 0 4
- 2 0 0 5
Texti les Manufacturing excl . Texti les Personal Consumer Loans Commerce Agricul ture Construction Others
Net Credit Flows
to the Private Sector
8/8/2019 Dr Shah April 2006
http://slidepdf.com/reader/full/dr-shah-april-2006 14/4814
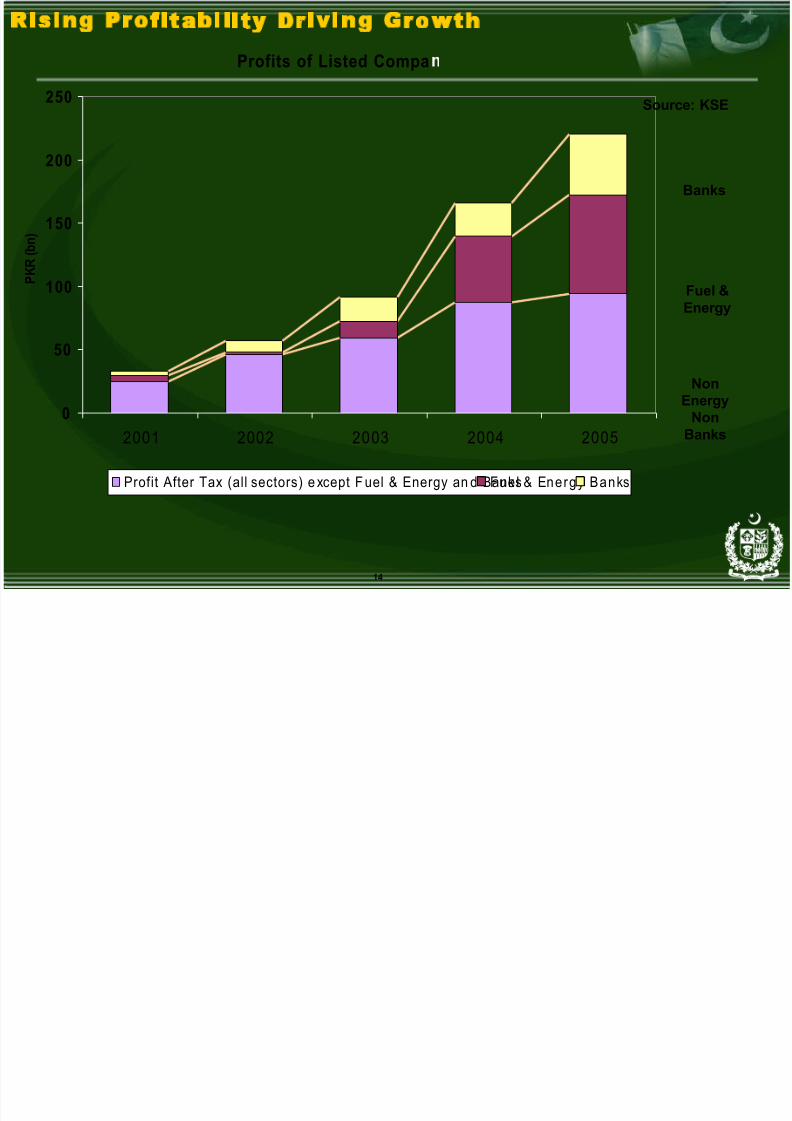
Profits of Listed Compa
0
50
100
150
200
250
2001 2002 2003 2004 2005
P K R ( b n )
Profit After Tax (all sectors) e xcept F uel & Energy an d BanksFuel & Energy Banks
Banks
Fuel &Energy
NonEnergy
NonBanks
Rising Profitability Driving Growth
Source: KSE
8/8/2019 Dr Shah April 2006
http://slidepdf.com/reader/full/dr-shah-april-2006 15/4815
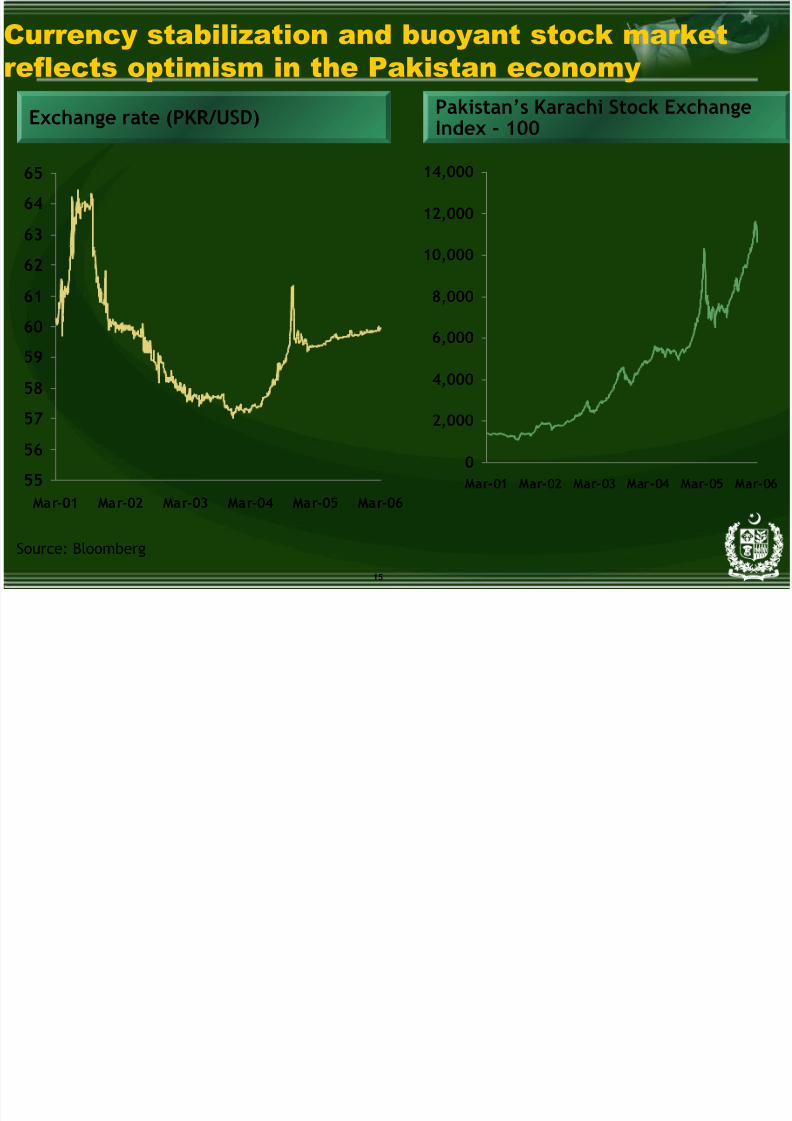
Currency stabilization and buoyant stock marketreflects optimism in the Pakistan economy
Source: Bloomberg
Exchange rate (PKR/USD) Pakistan’s Karachi Stock ExchangeIndex - 100
55
56
57
58
59
60
61
62
63
64
65
Mar-01 Mar-02 Mar-03 Mar-04 Mar-05 Mar-06
0
2,000
4,000
6,000
8,000
10,000
12,000
14,000
Mar-01 Mar-02 Mar-03 Mar-04 Mar-05 Mar-06
8/8/2019 Dr Shah April 2006
http://slidepdf.com/reader/full/dr-shah-april-2006 16/4816
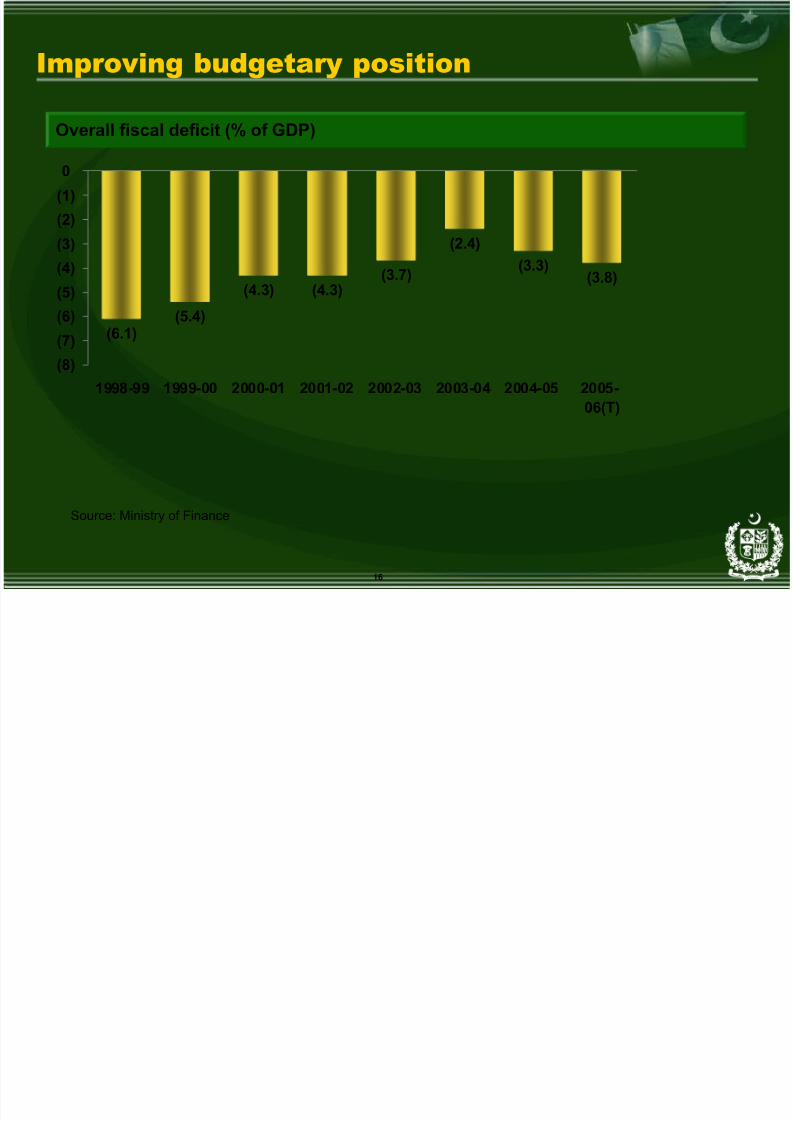
Improving budgetary position
Overall fiscal deficit (% of GDP)
Source: Ministry of Finance
(6.1)(5.4)
(4.3) (4.3) (3.7)
(2.4)(3.3)
(3.8)
(8)
(7)
(6)
(5)
(4)
(3)
(2)
(1)
0
1998-99 1999-00 2000-01 2001-02 2002-03 2003-04 2004-05 2005-06(T)
8/8/2019 Dr Shah April 2006
http://slidepdf.com/reader/full/dr-shah-april-2006 17/4817
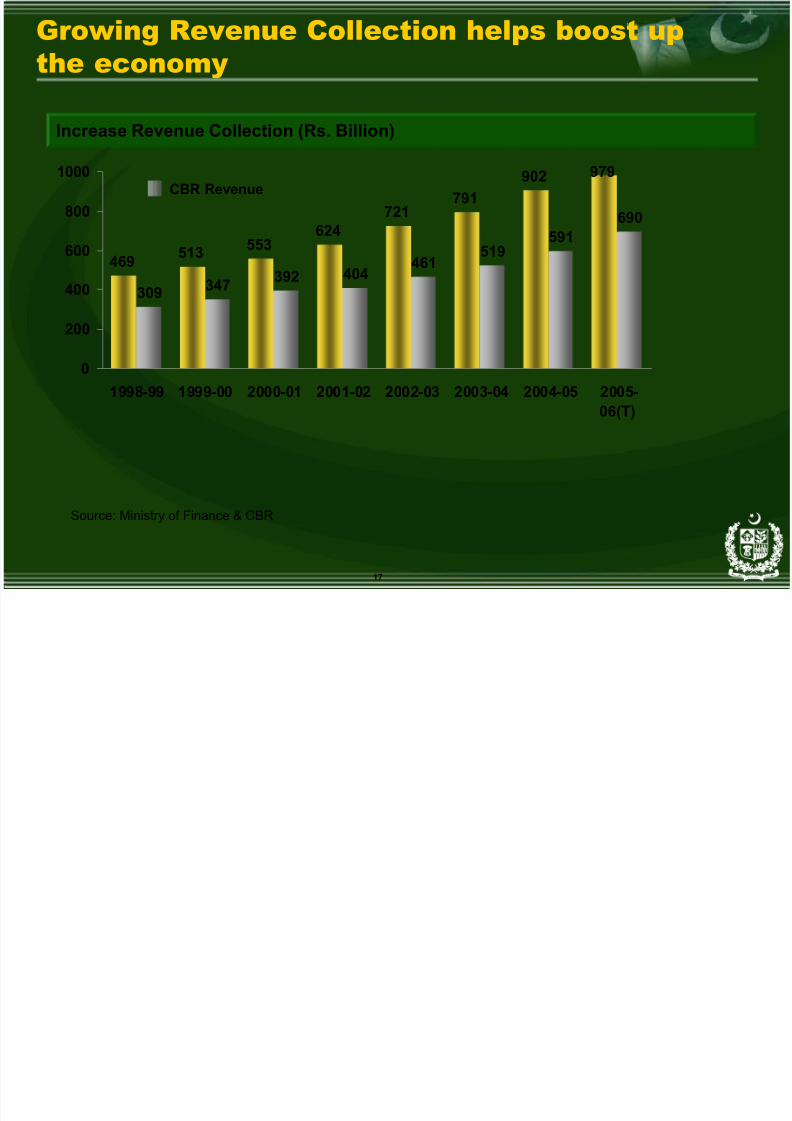
Growing Revenue Collection helps boost upthe economy
Increase Revenue Collection (Rs. Billion)
469 513 553624
721791
902 979
309 347 392 404461
519591
690
0
200
400
600
800
1000
1998-99 1999-00 2000-01 2001-02 2002-03 2003-04 2004-05 2005-
06(T)
Source: Ministry of Finance & CBR
CBR Revenue
8/8/2019 Dr Shah April 2006
http://slidepdf.com/reader/full/dr-shah-april-2006 18/4818
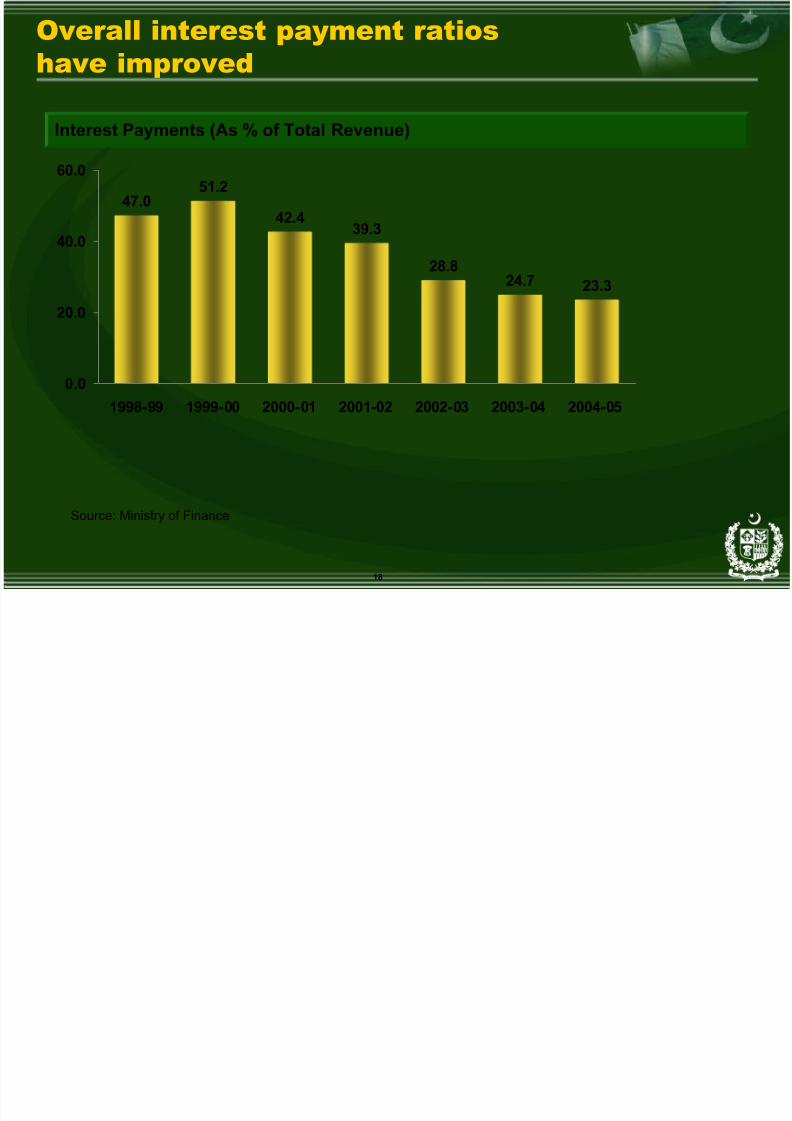
Overall interest payment ratioshave improved
Interest Payments (As % of Total Revenue)
Source: Ministry of Finance
47.051.2
42.439.3
28.824.7 23.3
0.0
20.0
40.0
60.0
1998-99 1999-00 2000-01 2001-02 2002-03 2003-04 2004-05
8/8/2019 Dr Shah April 2006
http://slidepdf.com/reader/full/dr-shah-april-2006 19/4819
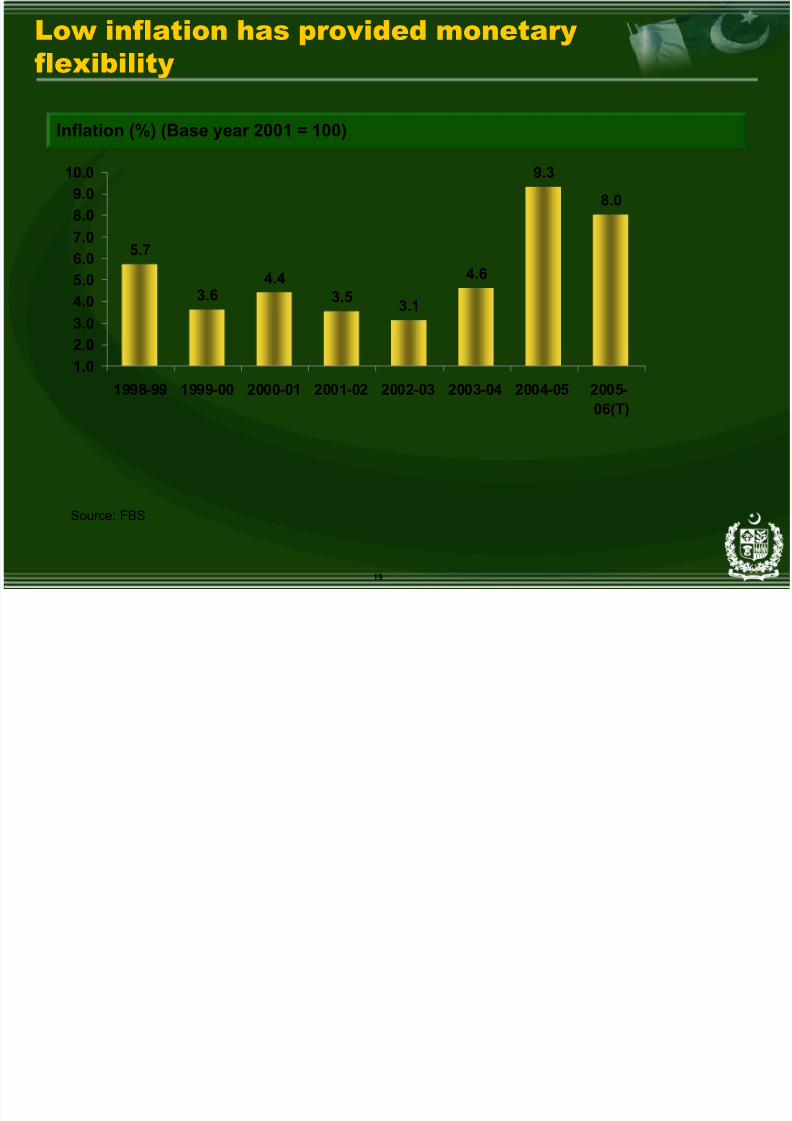
Low inflation has provided monetaryflexibility
Source: FBS
Inflation (%) (Base year 2001 = 100)
5.7
3.64.4
3.5 3.14.6
9.3
8.0
1.02.03.04.05.0
6.07.08.09.0
10.0
1998-99 1999-00 2000-01 2001-02 2002-03 2003-04 2004-05 2005-
06(T)
8/8/2019 Dr Shah April 2006
http://slidepdf.com/reader/full/dr-shah-april-2006 20/48
20
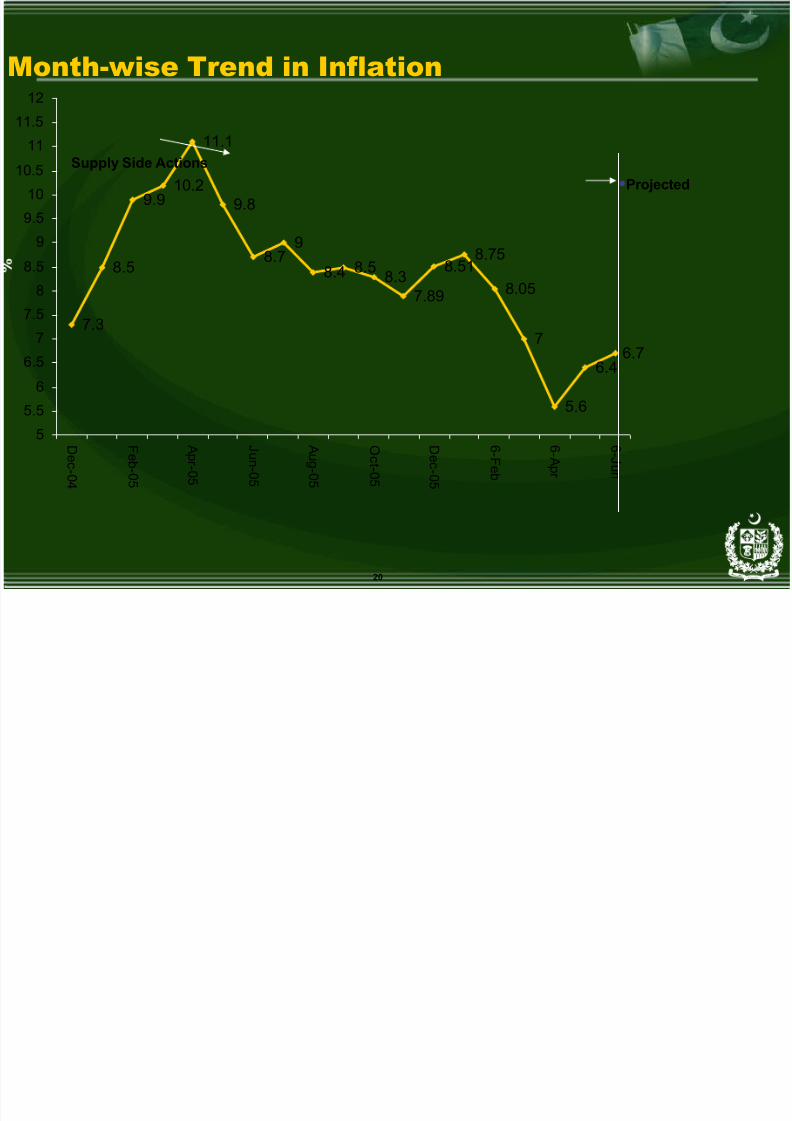
7.3
8.5
9.910.2
11.1
9.8
8.79
8.48.5
8.37.89
8.518.75
8.05
7
5.6
6.46.7
55.5
6
6.5
7
7.5
8
8.5
9
9.5
10
10.5
11
11.5
12
D e c - 0 4
F e b - 0 5
A pr - 0 5
J un- 0 5
A u g- 0 5
O c t - 0 5
D e c - 0 5
6 -F e b
6 -A
pr
6 - J un
Month-wise Trend in Inflation
Supply Side Actions
•Projected
8/8/2019 Dr Shah April 2006
http://slidepdf.com/reader/full/dr-shah-april-2006 21/48
8/8/2019 Dr Shah April 2006
http://slidepdf.com/reader/full/dr-shah-april-2006 22/48
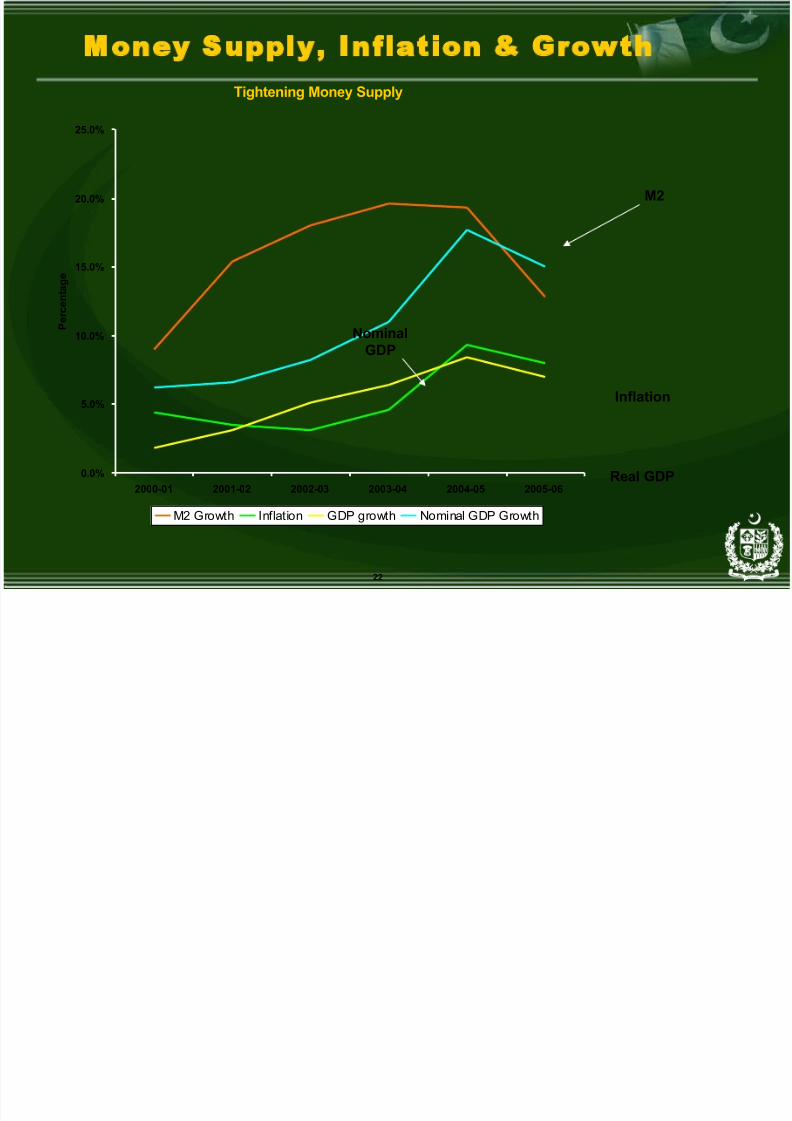
22
Money Supply, Inflation & GrowthTightening Money Supply
0.0%
5.0%
10.0%
15.0%
20.0%
25.0%
2000-01 2001-02 2002-03 2003-04 2004-05 2005-06
P e r c e n t a g e
M2 Growth Inflation GDP growth Nominal GDP Growth
M2
NominalGDP
Inflation
Real GDP
8/8/2019 Dr Shah April 2006
http://slidepdf.com/reader/full/dr-shah-april-2006 23/48
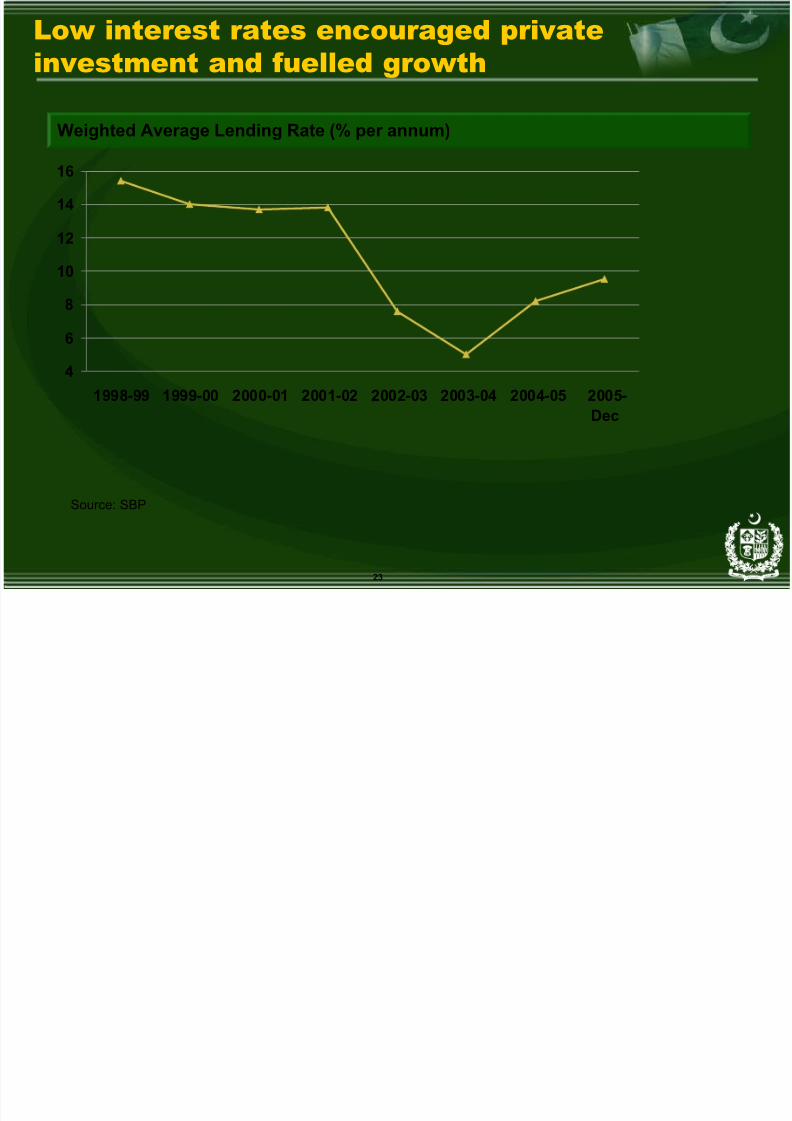
23
Low interest rates encouraged privateinvestment and fuelled growth
Weighted Average Lending Rate (% per annum)
Source: SBP
4
6
810
12
14
16
1998-99 1999-00 2000-01 2001-02 2002-03 2003-04 2004-05 2005-
Dec
8/8/2019 Dr Shah April 2006
http://slidepdf.com/reader/full/dr-shah-april-2006 24/48
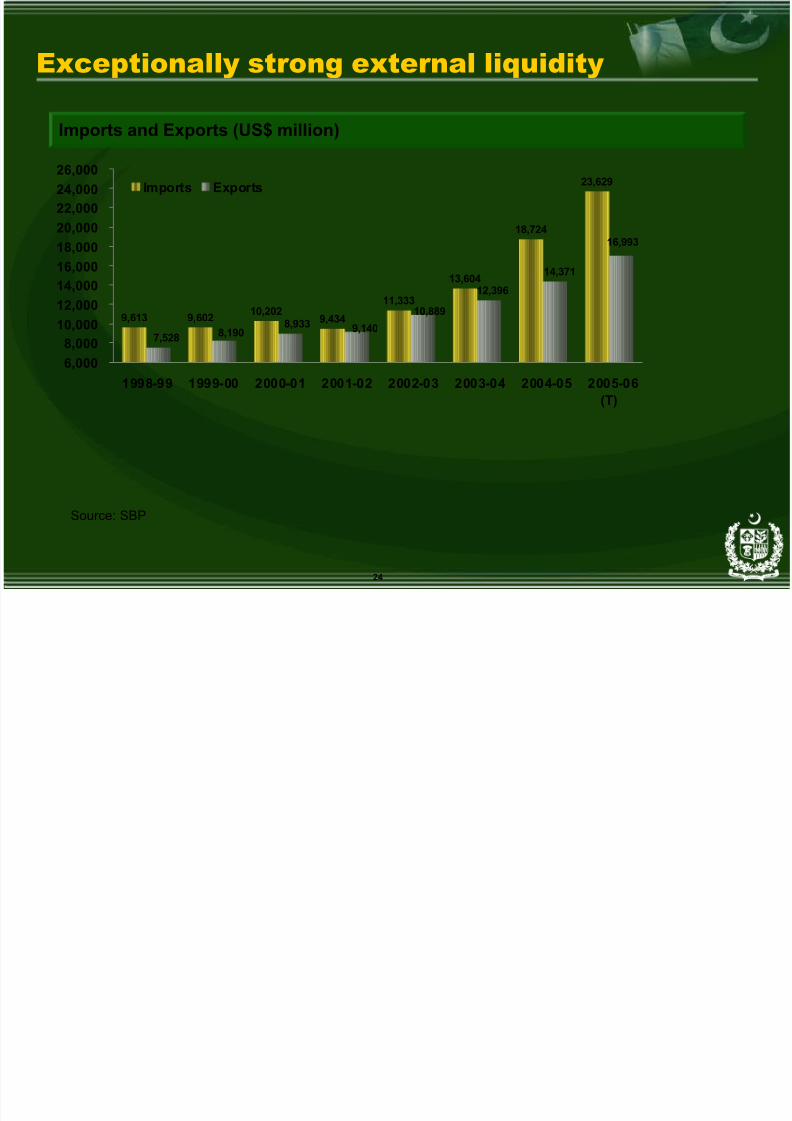
24
Exceptionally strong external liquidity
Source: SBP
Imports and Exports (US$ million)
9,613 9,602 10,2029,434
11,333
13,604
18,724
23,629
14,371
16,993
8,9338,1907,528
12,396
10,889
9,140
6,0008,000
10,00012,00014,00016,00018,00020,00022,00024,00026,000
1998-99 1999-00 2000-01 2001-02 2002-03 2003-04 2004-05 2005-06(T)
Imports Exports
8/8/2019 Dr Shah April 2006
http://slidepdf.com/reader/full/dr-shah-april-2006 25/48
25
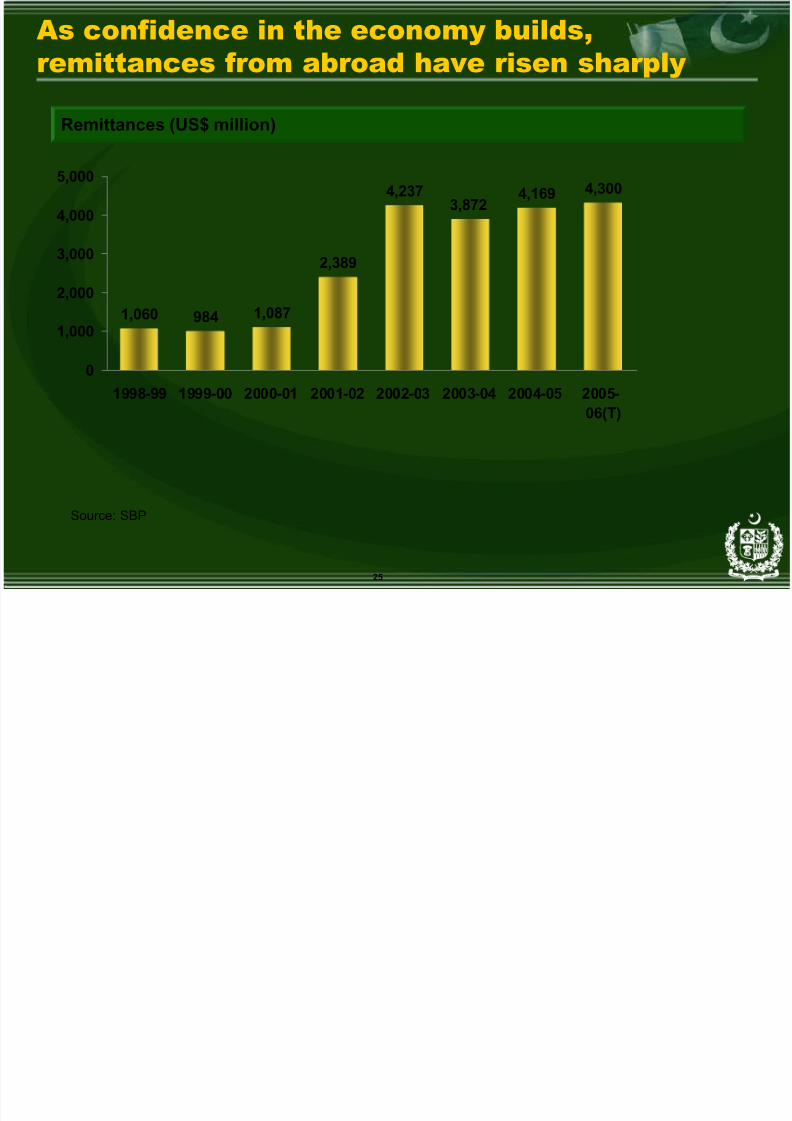
As confidence in the economy builds,remittances from abroad have risen sharply
Source: SBP
Remittances (US$ million)
1,060 984 1,087
2,389
4,2373,872
4,169 4,300
0
1,000
2,000
3,000
4,000
5,000
1998-99 1999-00 2000-01 2001-02 2002-03 2003-04 2004-05 2005-
06(T)
8/8/2019 Dr Shah April 2006
http://slidepdf.com/reader/full/dr-shah-april-2006 26/48
26
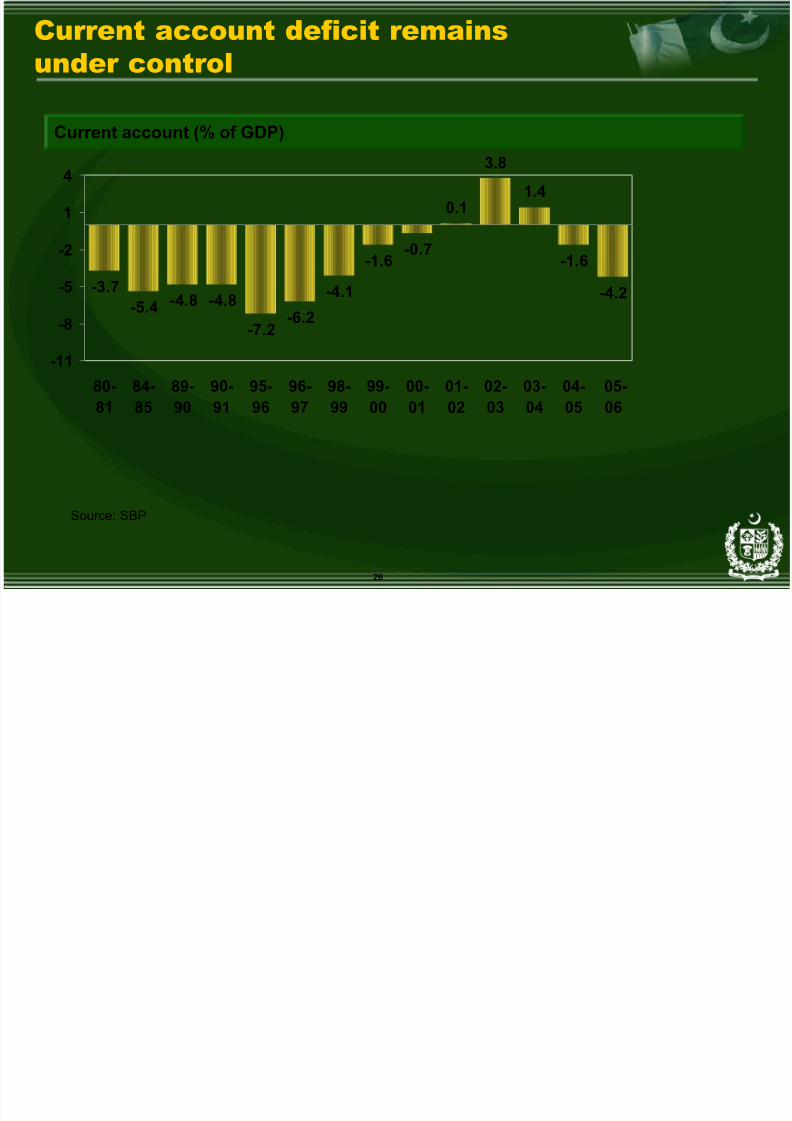
Current account (% of GDP)
Current account deficit remainsunder control
-3.7-5.4 -4.8 -4.8
-7.2-6.2
-4.1
-1.6-0.7
0.1
3.8
1.4
-1.6
-4.2
-11
-8
-5
-2
1
4
80-81
84-85
89-90
90-91
95-96
96-97
98-99
99-00
00-01
01-02
02-03
03-04
04-05
05-06
Source: SBP
8/8/2019 Dr Shah April 2006
http://slidepdf.com/reader/full/dr-shah-april-2006 27/48
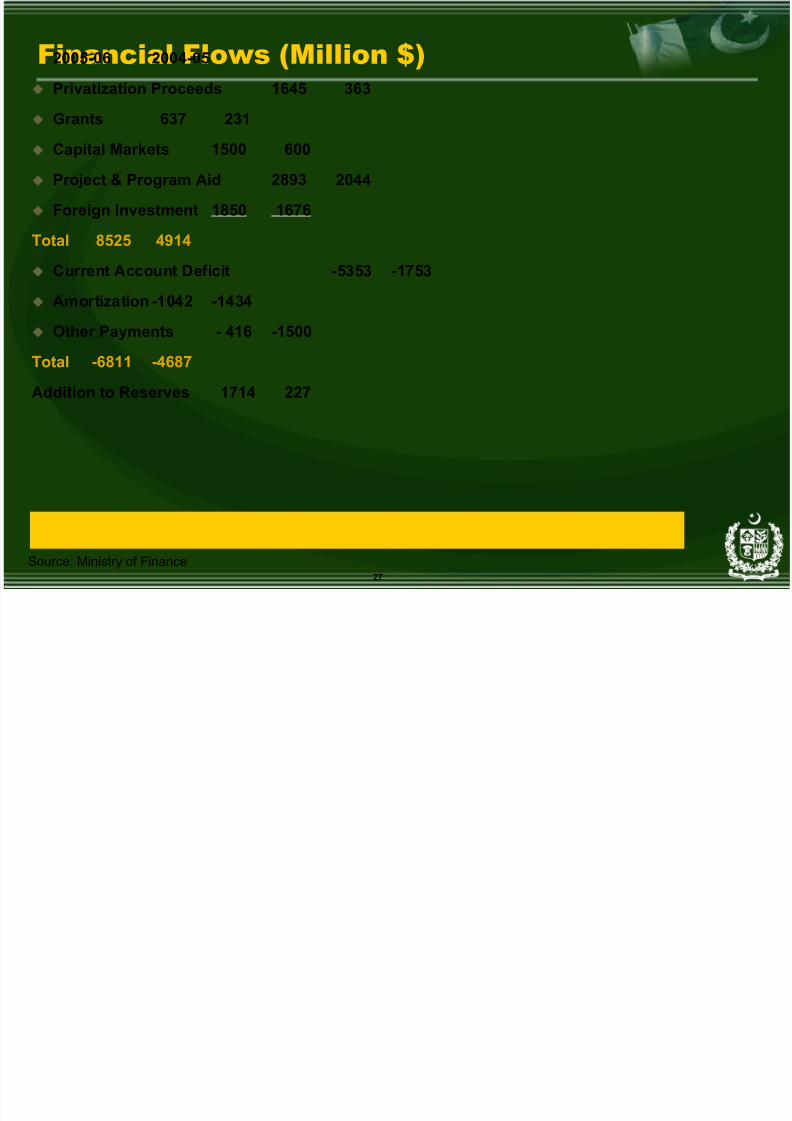
27
Financial Flows (Million $)2005-06 2004-05
Privatization Proceeds 1645 363
Grants 637 231
Capital Markets 1500 600
Project & Program Aid 2893 2044
Foreign Investment 1850 1676
Total 8525 4914
Current Account Deficit -5353 -1753
Amortization -1042 -1434
Other Payments - 416 -1500
Total -6811 -4687
Addition to Reserves 1714 227
Source: Ministry of Finance
8/8/2019 Dr Shah April 2006
http://slidepdf.com/reader/full/dr-shah-april-2006 28/48
28
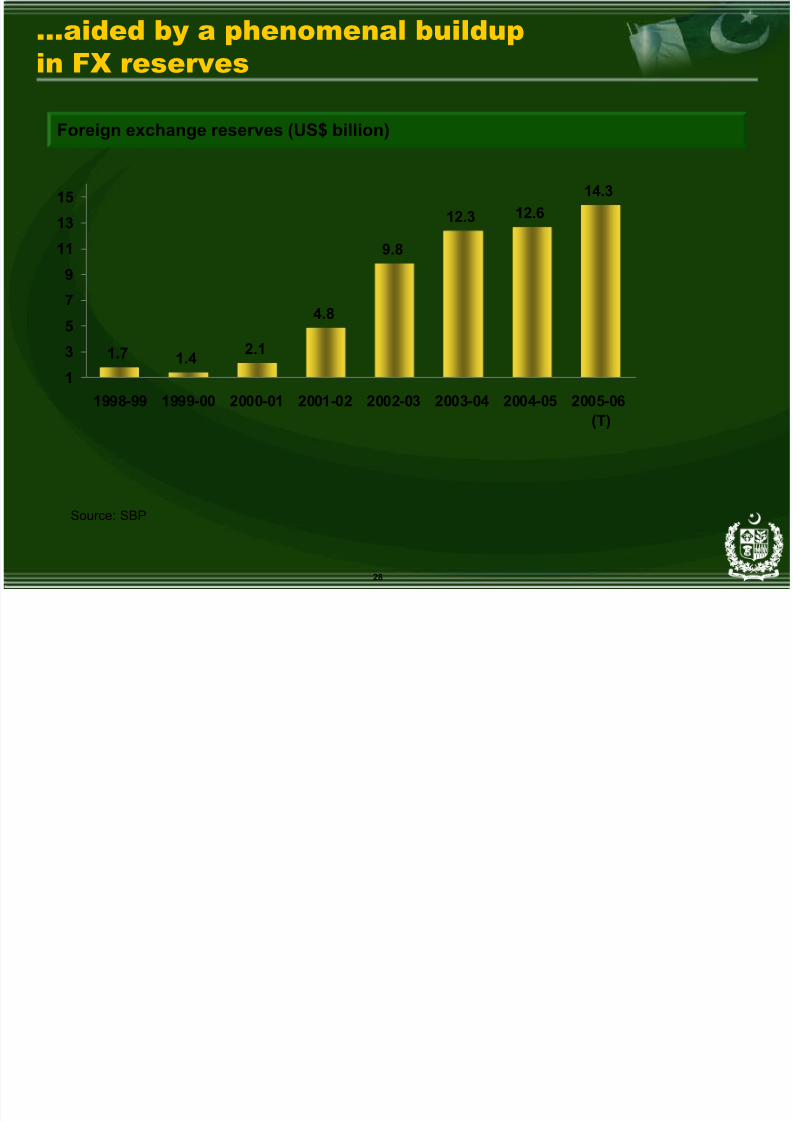
...aided by a phenomenal buildupin FX reserves
Source: SBP
Foreign exchange reserves (US$ billion)
1.7 1.42.1
4.8
9.8
12.3 12.614.3
1
3
5
79
11
13
15
1998-99 1999-00 2000-01 2001-02 2002-03 2003-04 2004-05 2005-06
(T)
8/8/2019 Dr Shah April 2006
http://slidepdf.com/reader/full/dr-shah-april-2006 29/48
Debt Profile of Pakistan
8/8/2019 Dr Shah April 2006
http://slidepdf.com/reader/full/dr-shah-april-2006 30/48
30
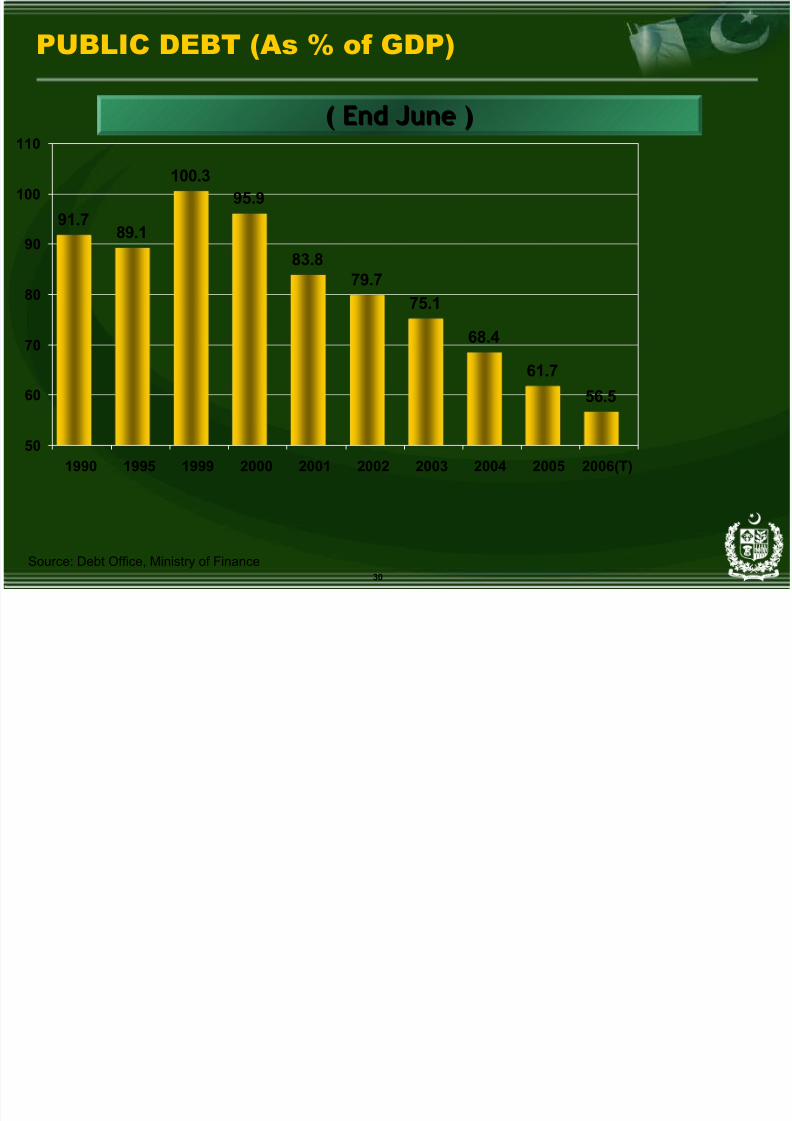
PUBLIC DEBT (As % of GDP)
91.789.1
100.3
56.5
61.7
68.4
75.179.7
83.8
95.9
50
60
70
80
90
100
110
1990 1995 1999 2000 2001 2002 2003 2004 2005 2006(T)
( End June )( End June )
Source: Debt Office, Ministry of Finance
8/8/2019 Dr Shah April 2006
http://slidepdf.com/reader/full/dr-shah-april-2006 31/48
31
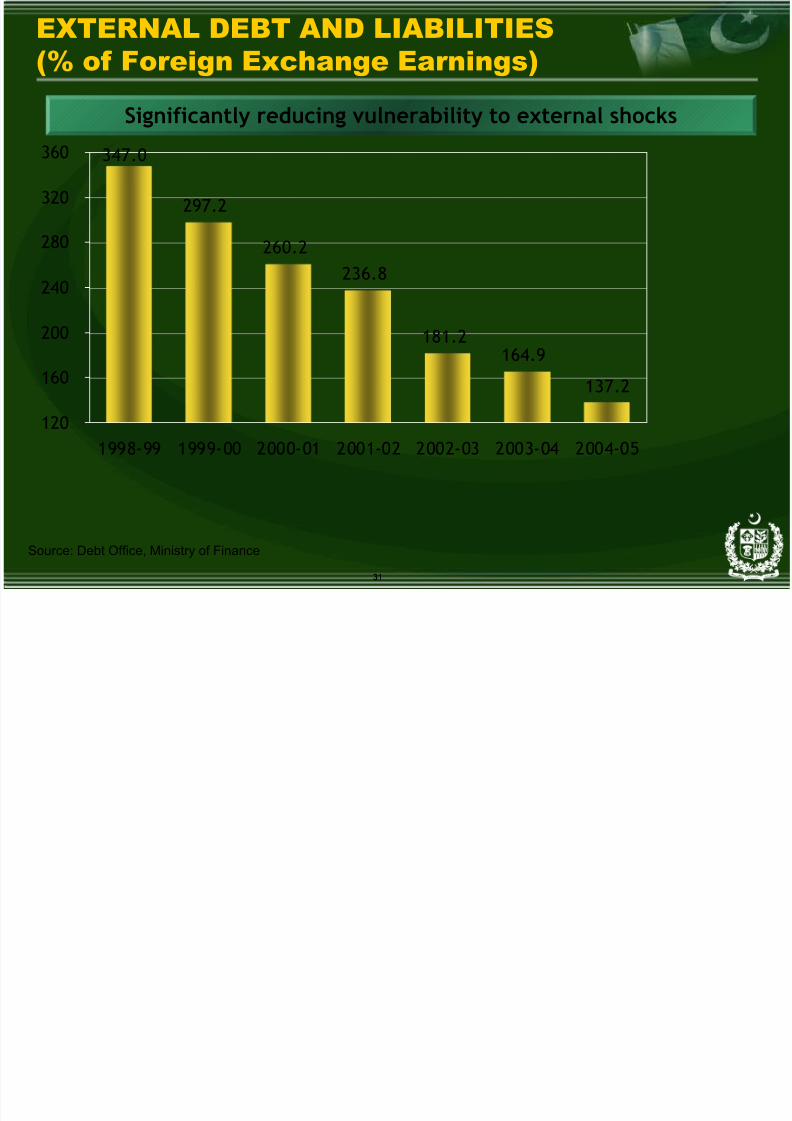
EXTERNAL DEBT AND LIABILITIES(% of Foreign Exchange Earnings)
297.2
260.2
236.8
181.2164.9
137.2
347.0
120
160
200
240
280
320
360
1998-99 1999-00 2000-01 2001-02 2002-03 2003-04 2004-05
Significantly reducing vulnerability to external shocks
Source: Debt Office, Ministry of Finance
8/8/2019 Dr Shah April 2006
http://slidepdf.com/reader/full/dr-shah-april-2006 32/48
32
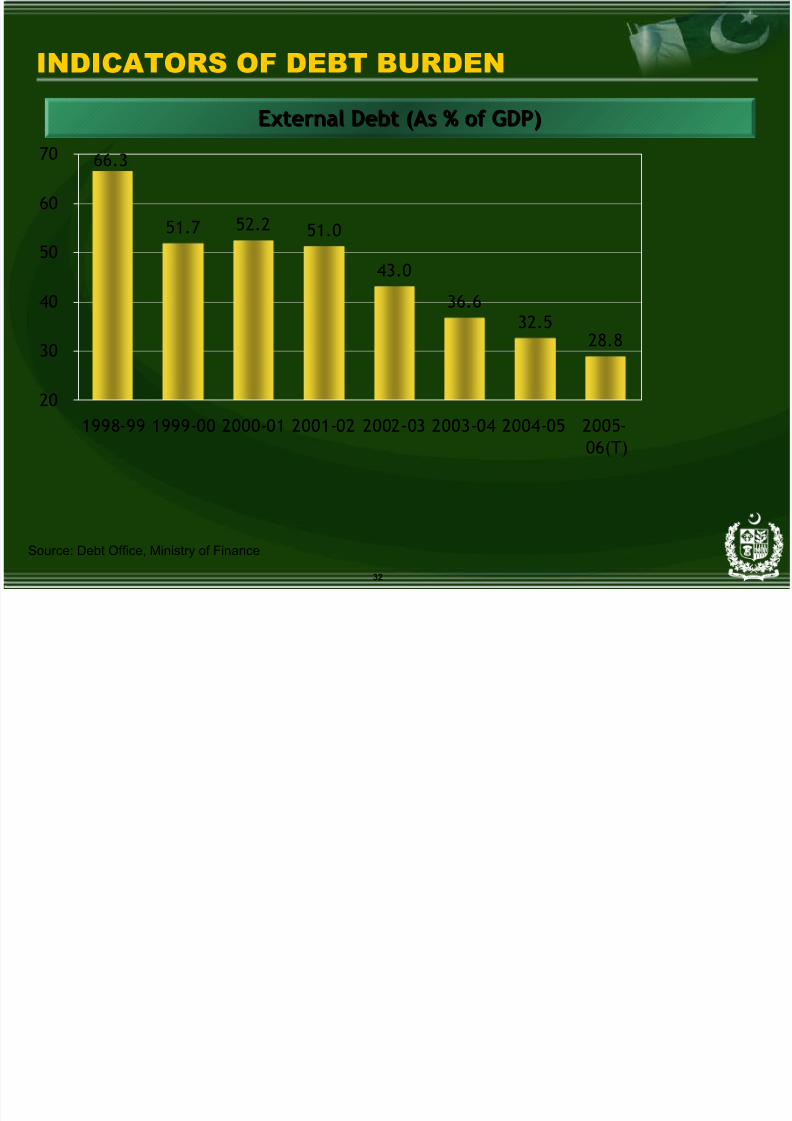
INDICATORS OF DEBT BURDEN
51.7 52.2 51.0
43.0
36.632.5
28.8
66.3
20
30
40
50
60
70
1998-99 1999-00 2000-01 2001-02 2002-03 2003-04 2004-05 2005-06(T)
External Debt (As % of GDP)External Debt (As % of GDP)
Source: Debt Office, Ministry of Finance
8/8/2019 Dr Shah April 2006
http://slidepdf.com/reader/full/dr-shah-april-2006 33/48
33
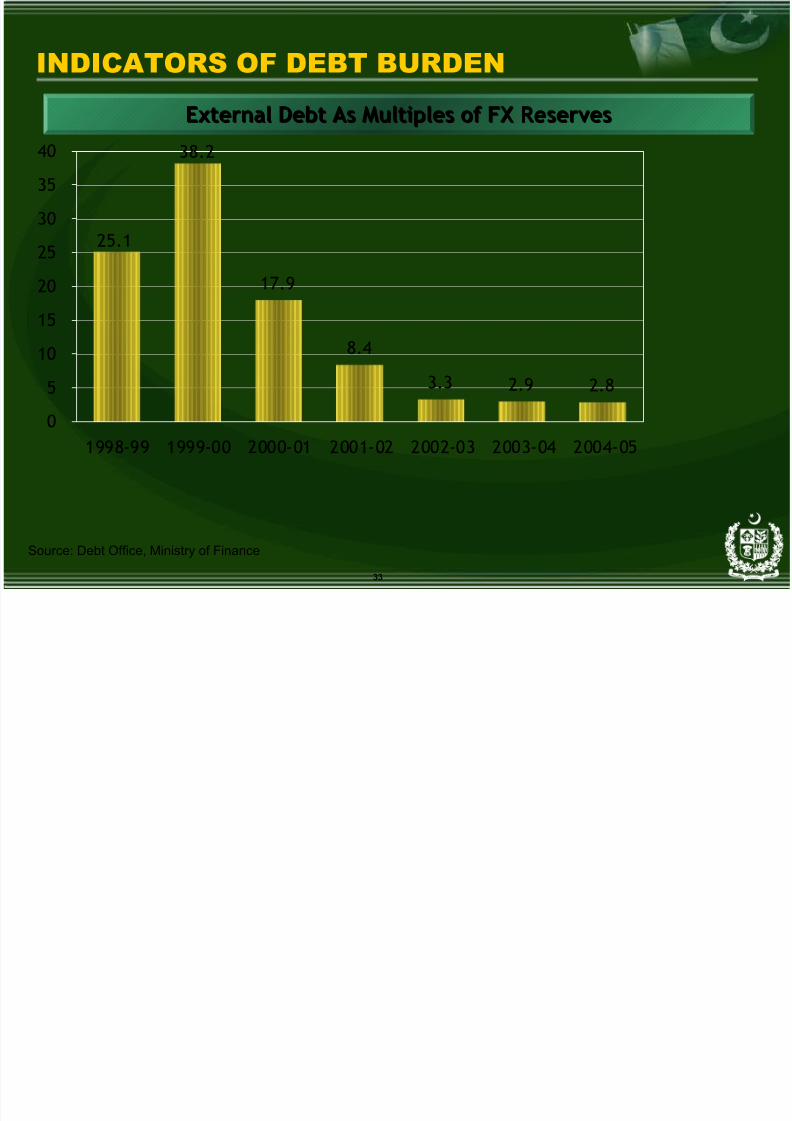
INDICATORS OF DEBT BURDEN
38.2
17.9
8.4
3.3 2.9 2.8
25.1
0
5
10
15
20
25
30
35
40
1998-99 1999-00 2000-01 2001-02 2002-03 2003-04 2004-05
External Debt As Multiples of FX ReservesExternal Debt As Multiples of FX Reserves
Source: Debt Office, Ministry of Finance
8/8/2019 Dr Shah April 2006
http://slidepdf.com/reader/full/dr-shah-april-2006 34/48
Pakistan’s EconomyIn the Next Five Years
8/8/2019 Dr Shah April 2006
http://slidepdf.com/reader/full/dr-shah-april-2006 35/48
35
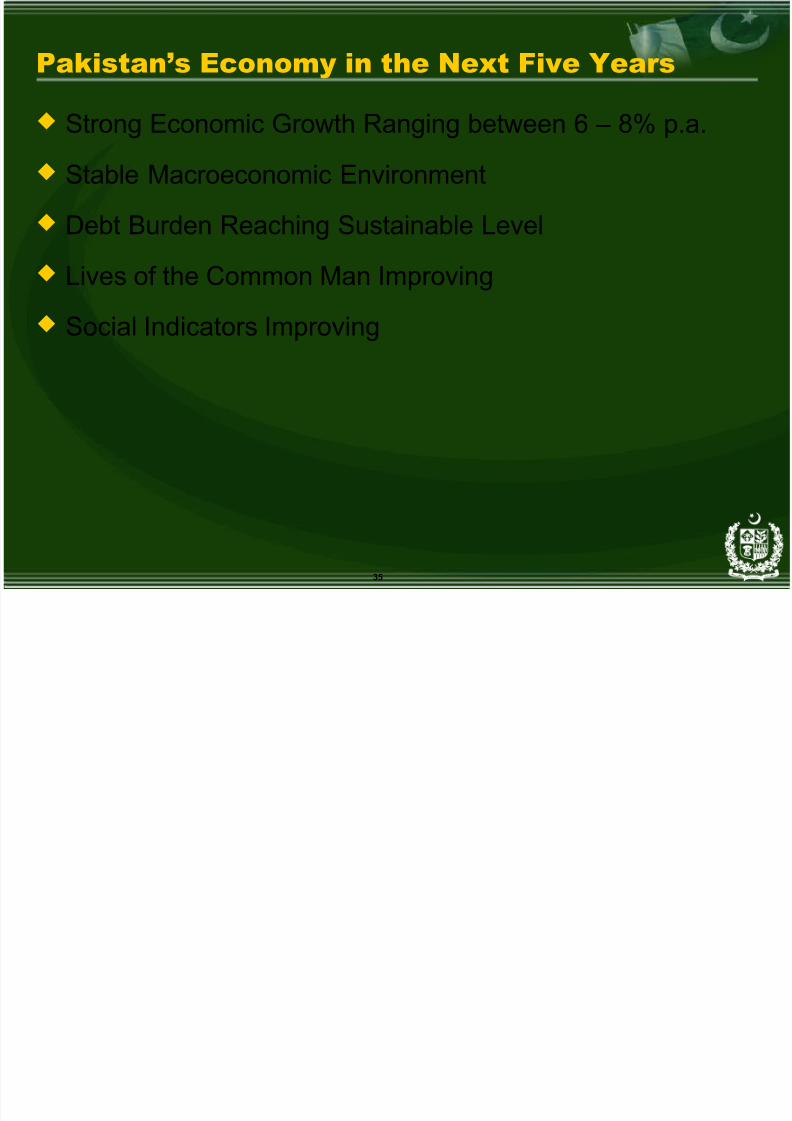
Pakistan’s Economy in the Next Five Years
Strong Economic Growth Ranging between 6 – 8% p.a.
Stable Macroeconomic Environment
Debt Burden Reaching Sustainable Level
Lives of the Common Man ImprovingSocial Indicators Improving
8/8/2019 Dr Shah April 2006
http://slidepdf.com/reader/full/dr-shah-april-2006 36/48
Key Macroeconomic TargetsFor The Next Five Years
8/8/2019 Dr Shah April 2006
http://slidepdf.com/reader/full/dr-shah-april-2006 37/48
37
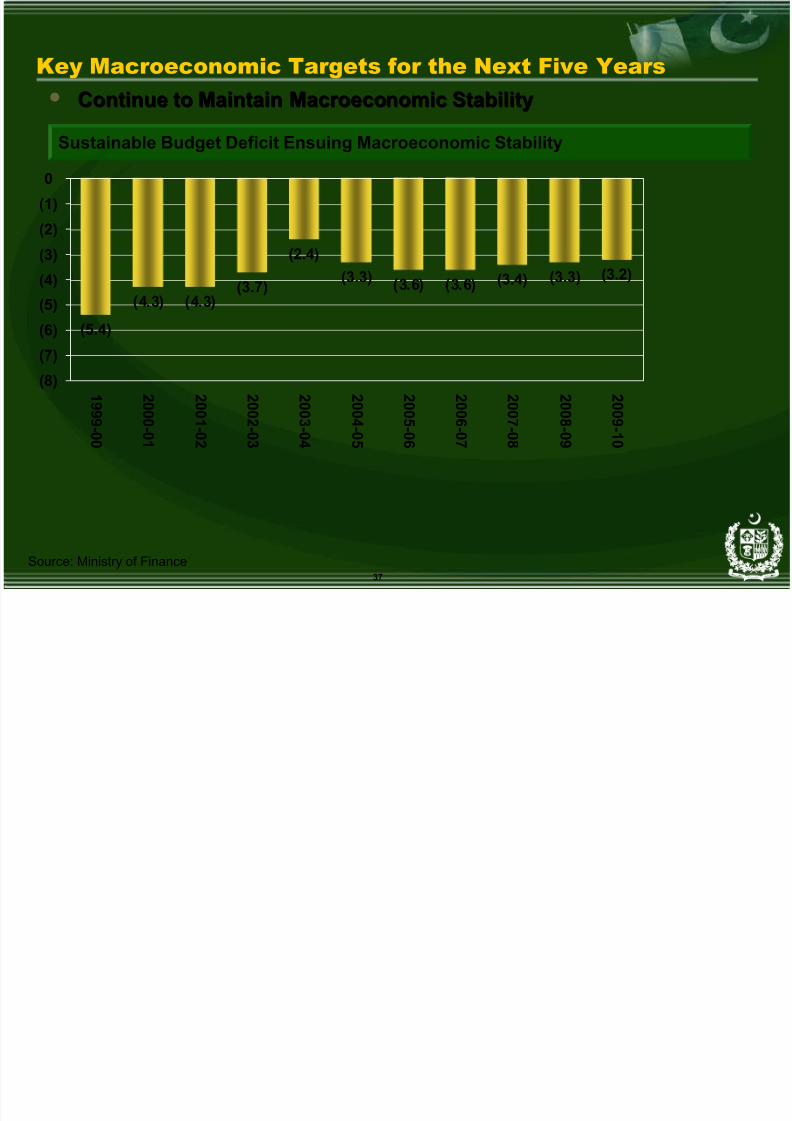
Key Macroeconomic Targets for the Next Five Years
Sustainable Budget Deficit Ensuing Macroeconomic Stability
• Continue to Maintain Macroeconomic StabilityContinue to Maintain Macroeconomic Stability
(5.4)
(4.3) (4.3)(3.7)
(2.4)
(3.3) (3.6) (3.6) (3.4) (3.3) (3.2)
(8)
(7)
(6)
(5)(4)
(3)
(2)
(1)
0
1 9 9 9 - 0 0
2 0 0 0 - 0 1
2 0 0 1 - 0 2
2 0 0 2 - 0 3
2 0 0 3 - 0 4
2 0 0 4 - 0 5
2 0 0 5 - 0 6
2 0 0 6 - 0 7
2 0 0 7 - 0 8
2 0 0 8 - 0 9
2 0 0 9 -1 0
Source: Ministry of Finance
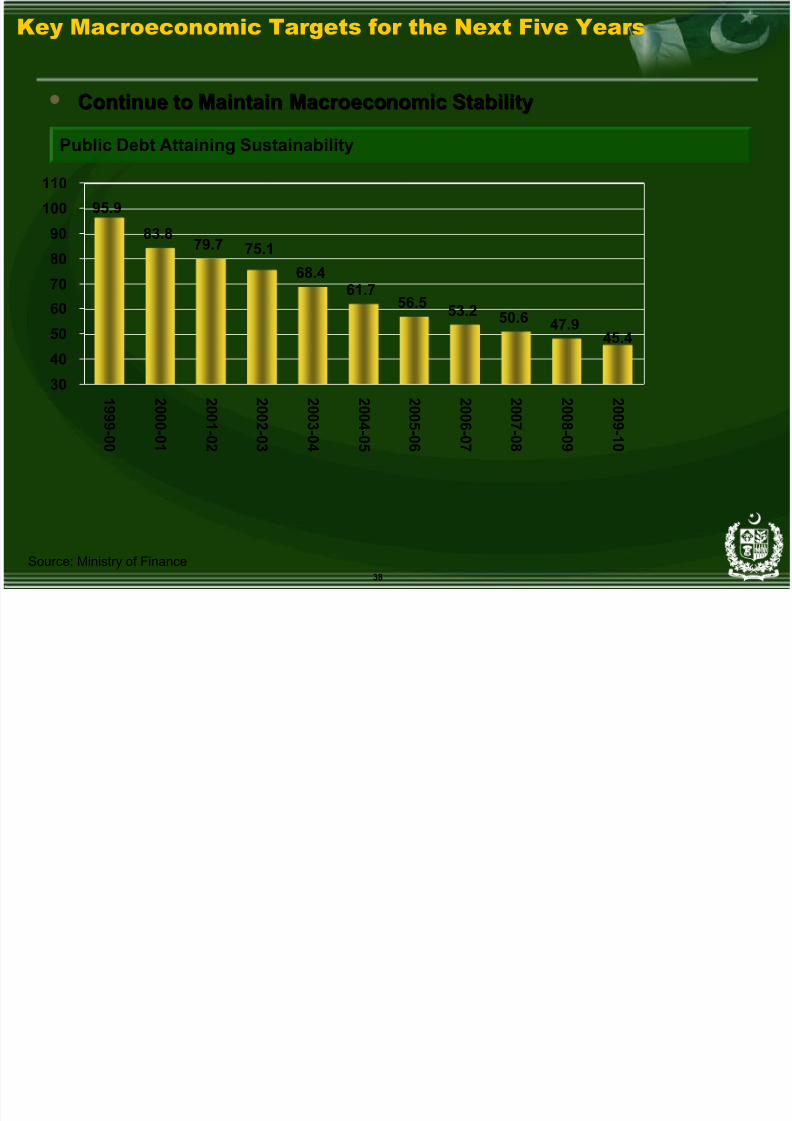
Key Macroeconomic Targets for the Next Five Years
8/8/2019 Dr Shah April 2006
http://slidepdf.com/reader/full/dr-shah-april-2006 38/48
38
Public Debt Attaining Sustainability
• Continue to Maintain Macroeconomic StabilityContinue to Maintain Macroeconomic Stability
83.879.7
68.461.7
56.5 53.2 50.6
75.1
45.447.9
95.9
30
40
50
6070
80
90
100
110
1 9
9 9 - 0 0
2 0
0 0 - 0 1
2 0
0 1 - 0 2
2 0
0 2 - 0 3
2 0
0 3 - 0 4
2 0
0 4 - 0 5
2 0
0 5 - 0 6
2 0
0 6 - 0 7
2 0
0 7 - 0 8
2 0
0 8 - 0 9
2 0
0 9 -1 0
Key Macroeconomic Targets for the Next Five Years
Source: Ministry of Finance
8/8/2019 Dr Shah April 2006
http://slidepdf.com/reader/full/dr-shah-april-2006 39/48
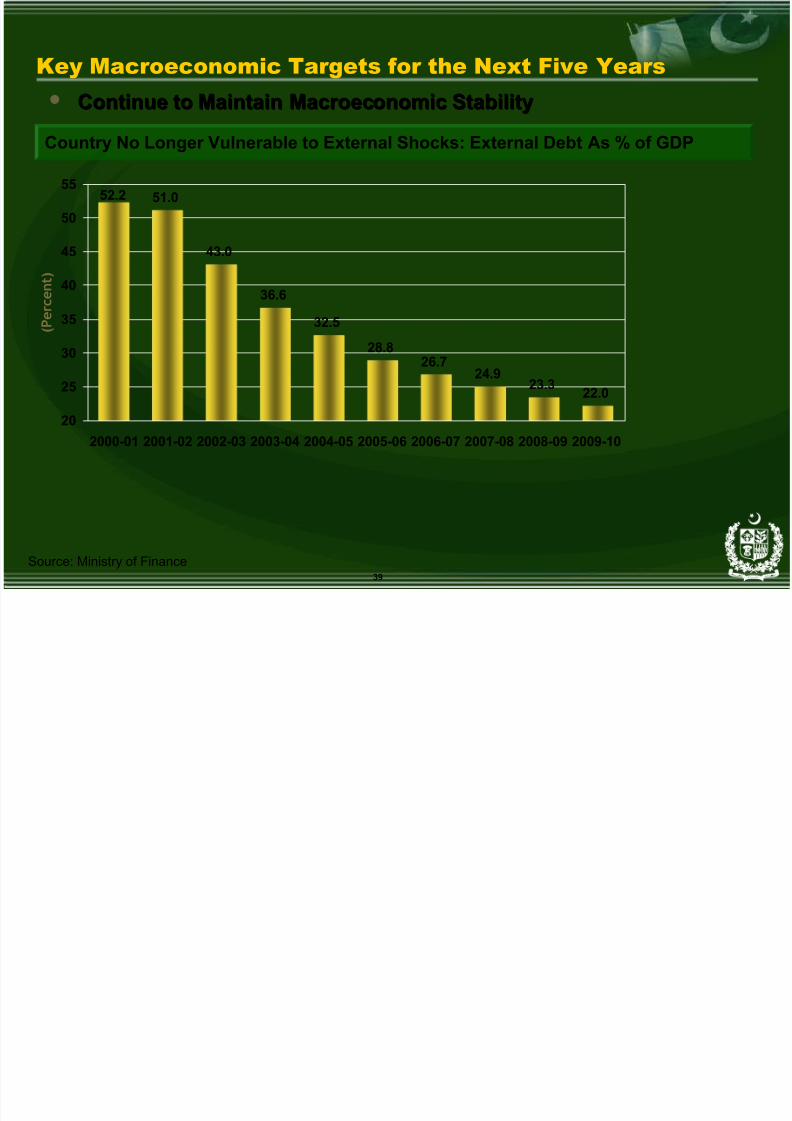
39
Country No Longer Vulnerable to External Shocks: External Debt As % of GDP
• Continue to Maintain Macroeconomic StabilityContinue to Maintain Macroeconomic Stability
51.0
43.0
36.6
32.5
28.826.7
24.923.3
22.0
52.2
20
25
30
35
40
45
50
55
2000-01 2001-02 2002-03 2003-04 2004-05 2005-06 2006-07 2007-08 2008-09 2009-10
( P e r c e n t
)
Key Macroeconomic Targets for the Next Five Years
Source: Ministry of Finance
8/8/2019 Dr Shah April 2006
http://slidepdf.com/reader/full/dr-shah-april-2006 40/48
8/8/2019 Dr Shah April 2006
http://slidepdf.com/reader/full/dr-shah-april-2006 41/48
41
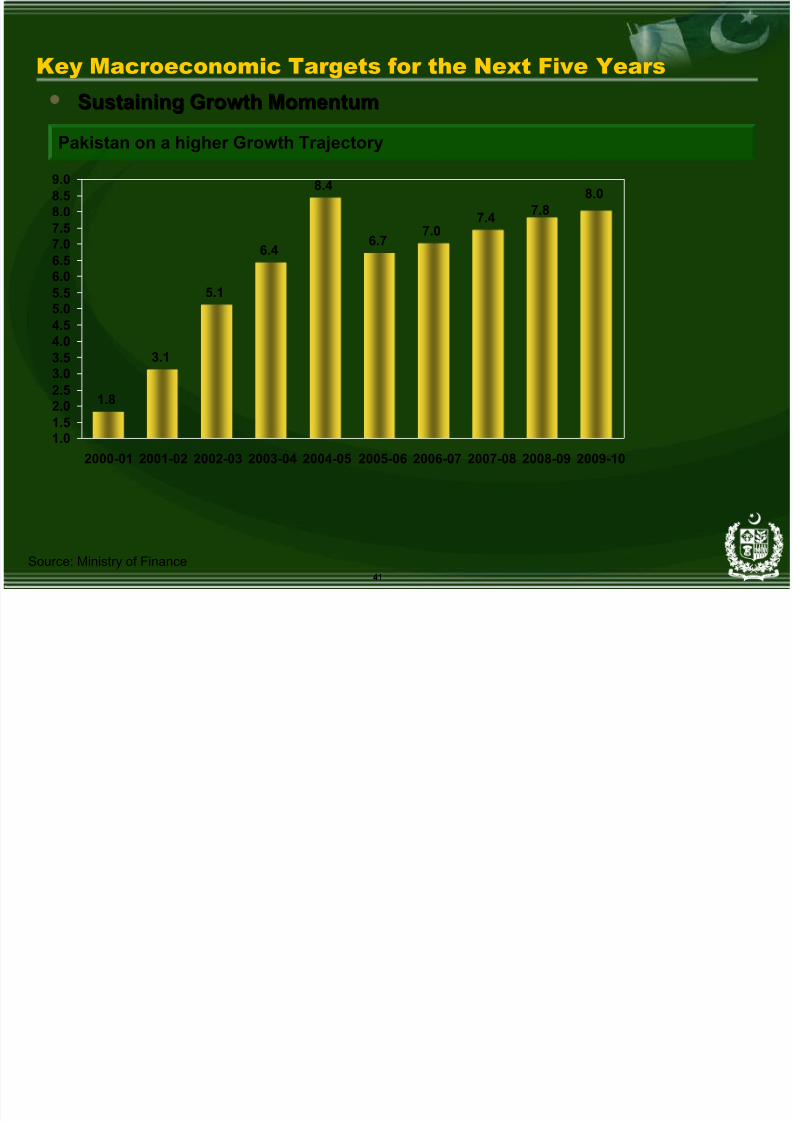
Pakistan on a higher Growth Trajectory
• Sustaining Growth MomentumSustaining Growth Momentum
1.8
3.1
5.1
6.4
8.4
6.77.0
7.4 7.88.0
1.01.52.02.53.03.54.04.55.05.56.0
6.57.07.58.08.59.0
2000-01 2001-02 2002-03 2003-04 2004-05 2005-06 2006-07 2007-08 2008-09 2009-10
Key Macroeconomic Targets for the Next Five Years
Source: Ministry of Finance
8/8/2019 Dr Shah April 2006
http://slidepdf.com/reader/full/dr-shah-april-2006 42/48
8/8/2019 Dr Shah April 2006
http://slidepdf.com/reader/full/dr-shah-april-2006 43/48
43
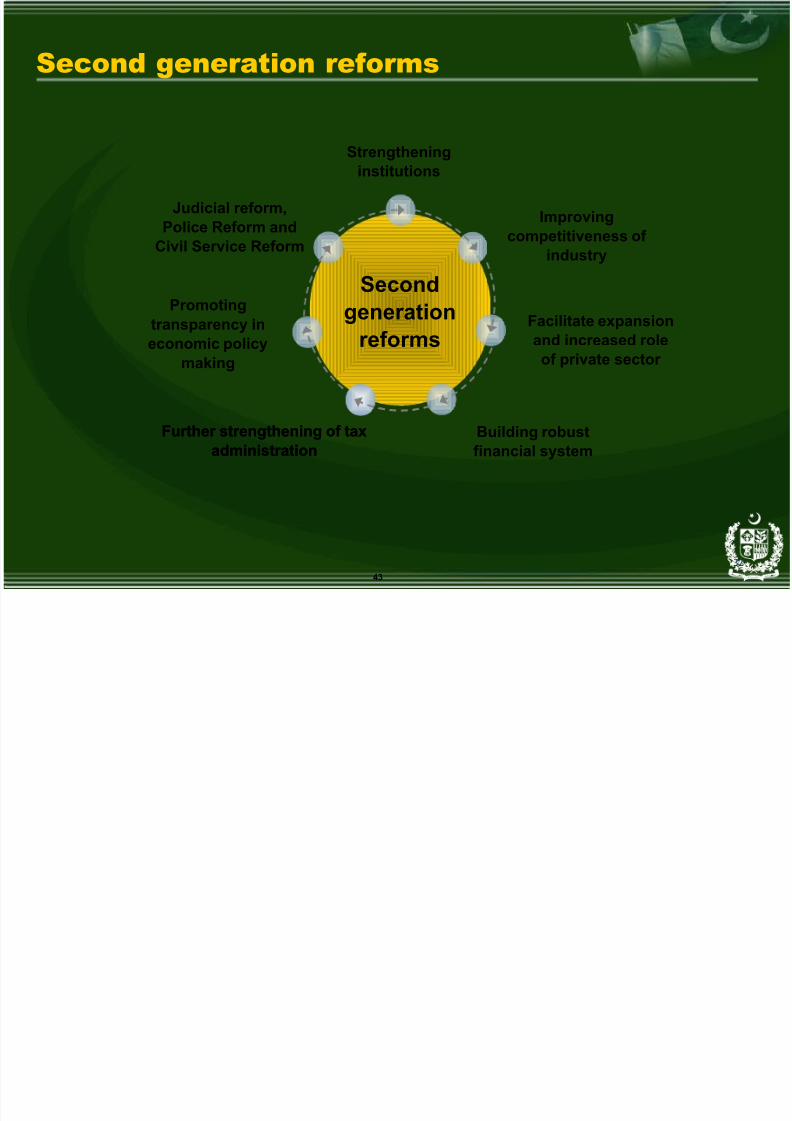
Secondgeneration
reforms
Second generation reforms
Improvingcompetitiveness of
industry
Facilitate expansionand increased role
of private sector
Further strengthening of taxadministration
Promotingtransparency ineconomic policy
making
Judicial reform,Police Reform and
Civil Service Reform
Strengtheninginstitutions
32
Building robustfinancial system
Further strengthening of taxadministration
8/8/2019 Dr Shah April 2006
http://slidepdf.com/reader/full/dr-shah-april-2006 44/48
44
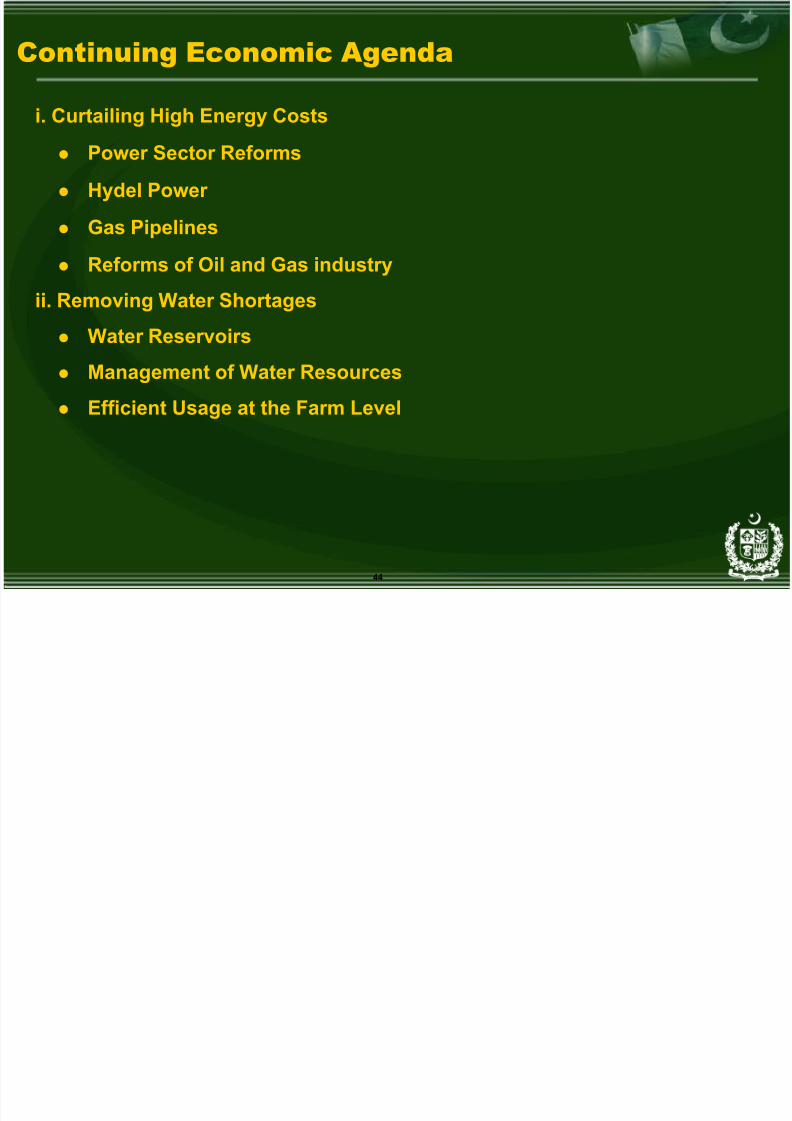
Continuing Economic Agenda
i. Curtailing High Energy Costs
• Power Sector Reforms
• Hydel Power
• Gas Pipelines
• Reforms of Oil and Gas industry
ii. Removing Water Shortages
• Water Reservoirs
• Management of Water Resources
• Efficient Usage at the Farm Level
8/8/2019 Dr Shah April 2006
http://slidepdf.com/reader/full/dr-shah-april-2006 45/48
45
Continuing Economic Agenda
iii. Improving Logistics & Removing Supply Chain Constraints
• National Trade Corridor
• Retail & Wholesale Markets Development
• Ports Modernization
• Modernizing Transport Fleet
iv. Unlocking the Land Bank
• NIPs (National Industrial Parks)
• Release of Government Land ( Defence, Railways, Provincial Governments
etc.)
• Computerization of Land Transactions
8/8/2019 Dr Shah April 2006
http://slidepdf.com/reader/full/dr-shah-april-2006 46/48
46
Continuing Economic Agenda
v. Removing Skills Gap & Enhancing Productivity
•
NTEVTA• 5 New Engineering Universities & HEC Initiatives
• Education Sector Reforms
vi. Boosting Agriculture Sector Development
• Livestock Sector
• Fisheries
• Horticulture & Value Added Agriculture
• Research & Extension Services
• Yield Enhancement
C i i E i A d
8/8/2019 Dr Shah April 2006
http://slidepdf.com/reader/full/dr-shah-april-2006 47/48
47
Continuing Economic Agenda
vii. Tourism & Hotel Industry Expansion
viii. SMEs & One Village One Product
ix. Sustaining Industrial Development Beyond Textiles
x. Developing Knowledge Based Industry &
Outsourcing
xi. Strengthening Growth Prospects of Service Sector
xii. Obtaining Preferential Access to Global Markets
8/8/2019 Dr Shah April 2006
http://slidepdf.com/reader/full/dr-shah-april-2006 48/48
Conclusions
i. Economy Continues to Grow Strongly
ii. Reduction in Unemploymentiii. Growing Profitability of Private Sector
iv. Robust Banking System
v. Strong Growth in Diversified Sectorsvi. Vibrant Telecom Sector
vii. Strong Domestic & External Demand Sustaining Economic
Growthviii. Growing opportunities in Infrastructure
ix. Growing Role of the Private sector