micmat m ksynthesis
TRANSCRIPT

Seediscussions,stats,andauthorprofilesforthispublicationat:https://www.researchgate.net/publication/257366131
Spray-driedporoussilicamicrospheresfunctionalisedbyphosphonicacidgroups
ArticleinMicroporousandMesoporousMaterials·April2012
DOI:10.1016/j.micromeso.2011.11.038
CITATIONS
9
READS
22
5authors,including:
InnaV.Melnyk
ChuikoInstituteofSurfaceChemistryofNati…
69PUBLICATIONS240CITATIONS
SEEPROFILE
YuriyZub
NationalAcademyofSciencesofUkraine
127PUBLICATIONS492CITATIONS
SEEPROFILE
AllcontentfollowingthispagewasuploadedbyInnaV.Melnykon05November2014.
Theuserhasrequestedenhancementofthedownloadedfile.Allin-textreferencesunderlinedinblueareaddedtotheoriginaldocument
andarelinkedtopublicationsonResearchGate,lettingyouaccessandreadthemimmediately.
This article appeared in a journal published by Elsevier. The attachedcopy is furnished to the author for internal non-commercial researchand education use, including for instruction at the authors institution
and sharing with colleagues.
Other uses, including reproduction and distribution, or selling orlicensing copies, or posting to personal, institutional or third party
websites are prohibited.
In most cases authors are permitted to post their version of thearticle (e.g. in Word or Tex form) to their personal website orinstitutional repository. Authors requiring further information
regarding Elsevier’s archiving and manuscript policies areencouraged to visit:
http://www.elsevier.com/copyright
Author's personal copy
Spray-dried porous silica microspheres functionalised by phosphonic acid groups
Inna V. Melnyk a,⇑, Mohamed Fatnassi b, Thomas Cacciaguerra b, Yuriy L. Zub a, Bruno Alonso b,⇑a Chuiko Institute of Surface Chemistry of National Academy of Sciences of Ukraine, 17 General Naumov Street, Kyiv 03164, Ukraineb Institut Charles Gerhardt de Montpellier – UMR 5253 (CNRS/ENSCM/UM2/UM1) 8, rue de l’Ecole Normale, 34296 Montpellier Cedex 5, France
a r t i c l e i n f o
Article history:Received 7 July 2011Received in revised form 17 October 2011Accepted 16 November 2011Available online 30 November 2011
Keywords:Spray-dryingMesoporous materialsSol–gelPhosphonic acid
a b s t r a c t
Porous silica-based microspheres with pore surfaces functionalized by phosphonic acids are obtained forthe first time from a direct co-condensation route using two alkoxide precursors (Si(OEt)4 andSi(OEt)3(CH2)2P(O)(OEt)2), surfactant self-assembly and spray-drying methods. The synthesis employsoctadecyltrimethylammonium bromide as template agent. The post-treatment of the microspheres inboiling concentrated hydrochloric acid insures the hydrolysis of the ethoxy groups initially bound tophosphorus in the organophosphonate–siloxane precursor, without destroying the morphological andtextural properties. Final porous materials have the chemical structure [SiO1.81(OZ)0.38]0.91[SiO1.35(OZ)0.29
(CH2)2P(O)(OH)2]0.09 (with Z @ H or Et), and posses interesting textural properties: SBET = 747 m2 g�1, anddp = 2.3 nm.
� 2011 Elsevier Inc. All rights reserved.
1. Introduction
Mesoporous materials obtained by surfactant’s micelle templat-ing methods and possessing pore surfaces functionalized by com-plexing groups are of wide interest [1–11]. For sorption andseparation technologies, the shape and the particle size plays a keyrole in both the internal and external diffusion of the chemical spe-cies. Spray-drying is a simple, continuous and scalable process [12]that can be used for the production of mesoporous microspheres[13,14]. The surfactant nature (ionic character, size, hydrophilic-lipophilic balance) and quantity will determine the textural proper-ties [14]. In turn, this will allow in optimizing the diffusion of thespecies to be complexed inside the materials. In addition, the selec-tivity and efficiency of the complexation is insured by the nature ofthe functional groups covering the pore surface. The two main strat-egies to functionalize silica pore surfaces consist in either a graftingstep on already formed porous samples, either a direct co-condensa-tion route allowing the formation of the final material more directly.The advantages and drawbacks of both strategies have been alreadydiscussed [2]. The co-condensation route is attractive by the morehomogeneous spatial distribution of functional groups that can beexpected. However, the control of the textural properties is more dif-ficult, in particular because of the additional interactions betweenthe functional groups and the surfactants or the organometallic pre-cursors. Also, the functional groups can be incorporated in not acces-sible areas. We have already solved these problems for theincorporation of small organic groups (Me, Ph) using a co-condensa-
tion route and spray-drying siloxane oligomers’ sols [15]. The ideawas to separate in time the hydrolysis of the tetralkoxysilane (Qunits’ precursors) allowing for the formation of the siloxane oligo-mers possessing an optimal size for the final morphological and tex-tural properties, and the co-condensation on these oligomers of theorganosiloxane units bearing the desired functional groups (T units).This idea was extended later to the mercaptopropyl organic groups[16]. And the thiol functional groups incorporated were able toquickly complex silver cations in stoichiometric amounts.
In this article, we report our first results on the direct functional-ization of silica’s surfaces with phosphonic acid groups inside spray-dried mesoporous microspheres. Compared to previous works onspray-dried functionalized mesoporous microspheres [15–18],there is a supplementary difficulty as it is necessary to hydrolyzethe phosphonate ester groups incorporated by the co-condensationroute, without destroying the texture and structure of the materials.
According to Refs. [19,20], nanoparticles made of silica withphosphonic groups using a template synthesis are used in thedevelopment of drug delivery systems [20] and as filling materialsin order to enhance proton conductivity [19]. Therefore, the devel-opment of methods for the synthesis of mesoporous silica micro-spheres with pore surfaces functionalized by phosphonic acids,and the further study of their properties, as suggested in this paper,is an important task.
2. Experimental
2.1. Syntheses
2.1.1. Sol preparationIn a typical synthesis, tetraethoxysilane 11.24 g (TEOS,
Si(OC2H5)4, 98%, Aldrich), isopropanol 36.12 g (iPrOH, 99.9%, APC)
1387-1811/$ - see front matter � 2011 Elsevier Inc. All rights reserved.doi:10.1016/j.micromeso.2011.11.038
⇑ Corresponding authors. Tel.: +38 (0)44 4229630; fax: +38 (0)44 4243567 (I.V.Melnyk), tel.: +33 (0)4 67 16 34 68; fax: +33 (0)4 67 16 34 70 (B. Alonso).
E-mail addresses: [email protected] (I.V. Melnyk), [email protected](B. Alonso).
Microporous and Mesoporous Materials 152 (2012) 172–177
Contents lists available at SciVerse ScienceDirect
Microporous and Mesoporous Materials
journal homepage: www.elsevier .com/locate /micromeso
Author's personal copy
and an acidic aqueous solution 10.81 g (HCl, 0.1 M) are mixed to-gether. The solution is stirred in a closed vessel at 297 K during46.5 h. Diethylphosphanatoethyltriethoxysilane 1.97 g (DPETES,(C2H5O)3Si(CH2)2P(O)(OC2H5)2, 95%, Aldrich) is then added. Again,the solution is stirred in a closed vessel at room temperature dur-ing a 5.5 h. Octadecyltrimethylammonium bromide 3.78 g (OTAB,[CH3(CH2)17N(CH3)3]Br, 99%, Fluka) is added and dissolved undervigorous stirring 15 min before spray-drying. The molar propor-tions TEOS:DPETES:H2O:OTAB are fixed to 0.9:0.1:10:0.16.
As described previously we use iPrOH as solvent because it givesmore ordered textures rather than other small alcohols within ourspray-drying conditions [21]. Acid catalysts are used for EISA pro-cesses and for co-condensation reactions. HCl is chosen here be-cause of its volatility.
2.1.2. Spray-dryingSpray-drying was undertaken using a Büchi Mini-Spray Dryer
B-290 apparatus fitted with a two-fluid nozzle (inner diameter of0.7 mm, sol and compressed air volume flow rates fixed to 0.34and 357 L h�1 respectively), and an inert loop containing a de-humidifier and a solvent condensation unit. The spray-drying gaswas dried nitrogen. The inlet and outlet temperatures were 373and 333 K respectively. An overpressure of 3 kPa before gas filter-ing insured small particle residence times (�1 s), and particle col-lection by a cyclone. The collected powders are dried for 72 h at333 K (final yield about 70%). They correspond to sample A.
OTAB from the as-synthesized material was removed by stirringthe sample in boiling ethanol for 3 h and four times (100 cm3 EtOHper 1 g of a sample). The hot suspension was filtered and the pre-cipitate was dried in air for 3 days (sample B). For the hydrolysis ofester groups the derived powder material was refluxed in concen-trated HCl (10 cm3 HCl per 1 g of a sample). After this a precipitatewas filtered, washed with 4 dm3 of distilled water and dried in vac-uum at 353 K for 6 h (sample C). All the procedures have beenfound to be reproducible.
2.2. Characterization
X-Ray diffraction (XRD) powder patterns were collected on aDRON 4-07 diffractometer using Cu-Ka radiation, 2h scanningwas carried out in the region of 1.0–8.0� at a speed of 0.5� min�1.Complementary small angle XRD patterns were obtained from aBruker AXS D8 diffractometer.
Transmission electron microscopy (TEM) analysis was under-taken on a JEOL 1200 EX2 microscope operating at 100 kV. Aftergrinding, the calcined samples were embedded in a resin and cutinto slices (�70 nm thick) with an ultramicrotome.
The morphology is studied by scanning electron microscopy(HITACHI 4800 S or JEOL JSM-6060LA electron microscopes) orby light scattering granulometry (Malvern Mastersizer 2000).
IR spectra in the 4000–400 cm�1 region were recorded on aspectrometer Thermo Nicolet Nexus FTIR using diffuse reflectance‘‘SMART Collector’’ at a resolution of 8 cm�1. Samples were mixedwith pre-calcined KBr in a ratio of 1:20.
1H (m0 @ 400.1 MHz), 29Si (m0 @ 79.5 MHz) and 31P (m0 @ 162.0MHz) solid-state NMR MAS spectra were recorded on a Varian400 spectrometer. 1.6 mm rotors span at 40 kHz were used for1H and 31P experiments, and 7.5 mm rotors span at 4–5 kHz for29Si. 1H single pulse sequences employed 90� pulses (2.5 ls) and5 s recycle delays. 29Si single pulse sequences employed 30� pulses(1.7 ls) and 60 s recycle delays. 31P single pulse sequences em-ployed 45� pulses (1 ls) and 10 s recycle delays. 1H, 29Si and 31Pchemical shifts were referenced using the secondary references:adamantane (d = 1.75 ppm), TMS (d = 0 ppm) and K2HPO4
(d = 4.1 ppm), respectively. Deconvolution of NMR spectra andXRD patterns were done using the least square fitting procedures
implemented in the dmfit software freely available from the web(http://www.nmr.cemhti.cnrs-orleans.fr/dmfit/).
The siloxane condensation degree c is defined as the averagefraction of siloxane Si–O–Si bonds around the Si units over allthe possible siloxane bonds. For the Q units it is calculated using:
c ¼Xði:%QÞ
h i= imax
Xð%QÞ
h i
where i is the number of siloxane bonds around the related Qi silox-ane unit, and imax the maximum of these bonds (imax = 4 for Q units).‘‘% Qi’’ are the percentages for each unit type. They are obtainedfrom 29Si NMR spectrum deconvolution using the dmfit softwareand Gaussian peaks of variable position, amplitude and width.The same procedure is used for the T units, replacing Qi by Ti andusing imax = 3.
N2 sorption isotherms measured at 77 K were recorded using aMicromeritics Tristar apparatus. Sample outgassing was achievedat 323 K until a stable static vacuum of 3mTorr (0.4 Pa) wasreached.
Elemental analyses were done at the CNRS facility ‘‘Service Cen-tral d’Analyse’’ (Vernaison, France).
3. Results and discussion
3.1. Sol preparation
Our first goal was to produce sols containing siloxane oligomerswith optimal characteristics (size, surface) [21,22] and bearing thephosphonate groups. Siloxane sols are prepared through hydrolysisand condensation reactions starting with alkoxide monomer pre-cursors. The alkoxides TEOS and DPETES form respectively Q unitsSi(OZ)4 and T units Si(OZ)3CH2CH2PO(OEt)2 (Z @ H, R). As shown inScheme 1, these alkoxides are added at two different steps in orderto produce siloxane oligomers possessing Q units at their core, andco-condensed T units at their surface [15,16]. Most of the parame-ters of the sol preparation (Scheme 1) are fixed according to the ex-pected properties or to our previous knowledge on spray-driedmicrospheres; namely: f = 0.1; h = 10; i = 10; s = 0.16; D2 � 6 h.
It is known that when the first aging time D1 varies, the extentof hydrolysis and condensation reactions varies, and hence thecharacteristics of the siloxane oligomers (size, pendent reactivegroups) [21–23]. Smaller sol aging times usually lead to delayedgelification and solidification processes. As a consequence, moreordered textures are obtained, but also more agglomerated mor-phologies. In the case of phosphonic functionalized spray-dried sil-icas, we have tested three different aging times D1: 24, 48 and 72 h.When decreasing the aging time, we observe an increase in textureordering (thinner and better resolved peaks), but also an increasein spheres’ agglomeration (higher particles’ diameter in average),
Scheme 1. Sol preparation.
I.V. Melnyk et al. / Microporous and Mesoporous Materials 152 (2012) 172–177 173
Author's personal copy
as expected [22]. The aging time D1 = 48 h is here a goodcompromise.
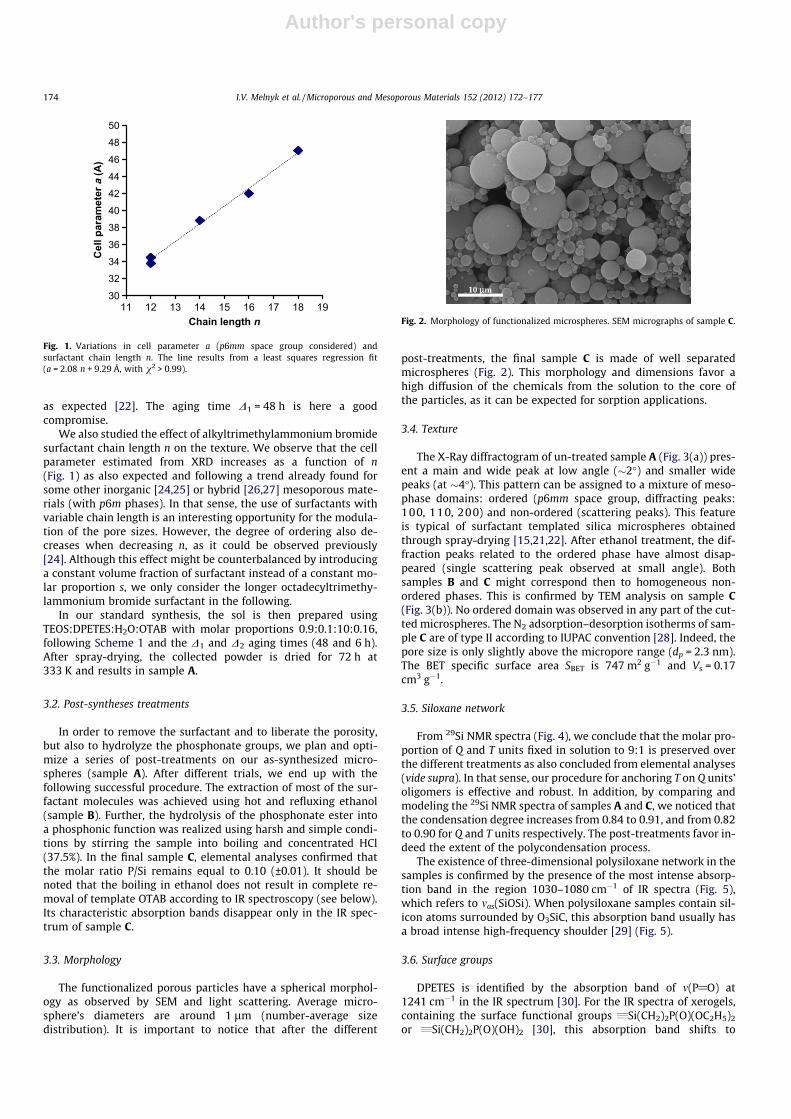
We also studied the effect of alkyltrimethylammonium bromidesurfactant chain length n on the texture. We observe that the cellparameter estimated from XRD increases as a function of n(Fig. 1) as also expected and following a trend already found forsome other inorganic [24,25] or hybrid [26,27] mesoporous mate-rials (with p6m phases). In that sense, the use of surfactants withvariable chain length is an interesting opportunity for the modula-tion of the pore sizes. However, the degree of ordering also de-creases when decreasing n, as it could be observed previously[24]. Although this effect might be counterbalanced by introducinga constant volume fraction of surfactant instead of a constant mo-lar proportion s, we only consider the longer octadecyltrimethy-lammonium bromide surfactant in the following.
In our standard synthesis, the sol is then prepared usingTEOS:DPETES:H2O:OTAB with molar proportions 0.9:0.1:10:0.16,following Scheme 1 and the D1 and D2 aging times (48 and 6 h).After spray-drying, the collected powder is dried for 72 h at333 K and results in sample A.
3.2. Post-syntheses treatments
In order to remove the surfactant and to liberate the porosity,but also to hydrolyze the phosphonate groups, we plan and opti-mize a series of post-treatments on our as-synthesized micro-spheres (sample A). After different trials, we end up with thefollowing successful procedure. The extraction of most of the sur-factant molecules was achieved using hot and refluxing ethanol(sample B). Further, the hydrolysis of the phosphonate ester intoa phosphonic function was realized using harsh and simple condi-tions by stirring the sample into boiling and concentrated HCl(37.5%). In the final sample C, elemental analyses confirmed thatthe molar ratio P/Si remains equal to 0.10 (±0.01). It should benoted that the boiling in ethanol does not result in complete re-moval of template OTAB according to IR spectroscopy (see below).Its characteristic absorption bands disappear only in the IR spec-trum of sample C.
3.3. Morphology
The functionalized porous particles have a spherical morphol-ogy as observed by SEM and light scattering. Average micro-sphere’s diameters are around 1 lm (number-average sizedistribution). It is important to notice that after the different
post-treatments, the final sample C is made of well separatedmicrospheres (Fig. 2). This morphology and dimensions favor ahigh diffusion of the chemicals from the solution to the core ofthe particles, as it can be expected for sorption applications.
3.4. Texture
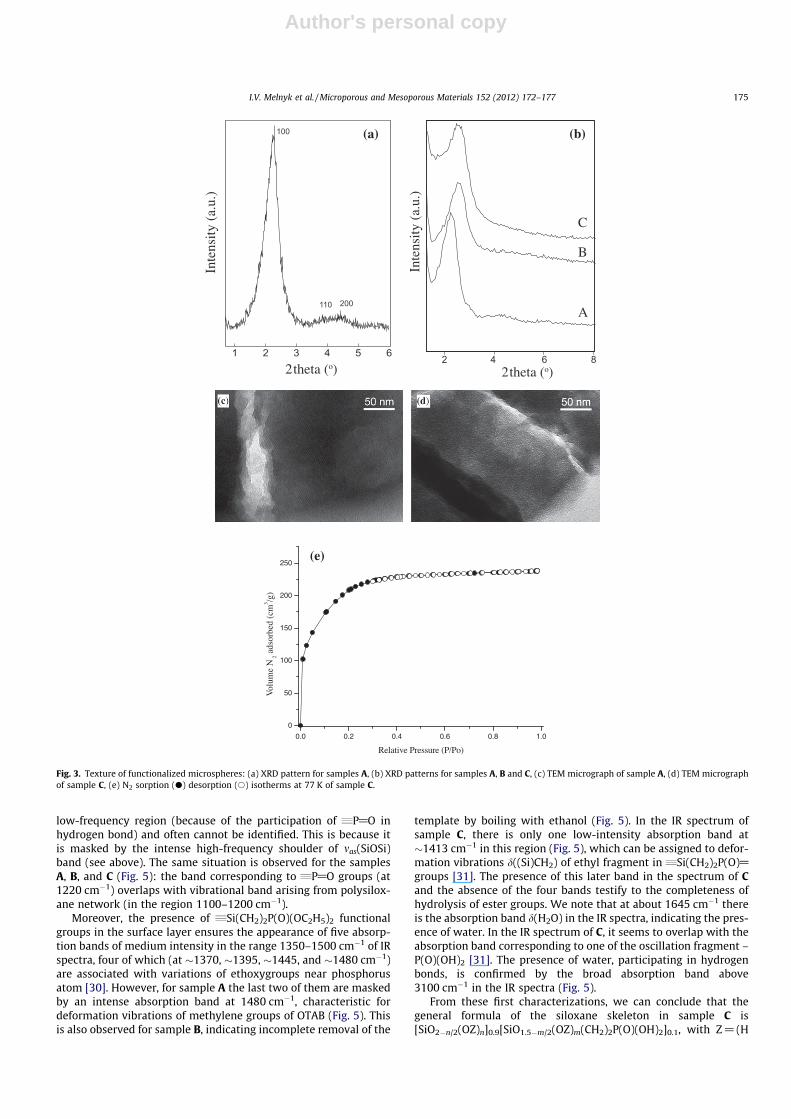
The X-Ray diffractogram of un-treated sample A (Fig. 3(a)) pres-ent a main and wide peak at low angle (�2�) and smaller widepeaks (at �4�). This pattern can be assigned to a mixture of meso-phase domains: ordered (p6mm space group, diffracting peaks:100, 110, 200) and non-ordered (scattering peaks). This featureis typical of surfactant templated silica microspheres obtainedthrough spray-drying [15,21,22]. After ethanol treatment, the dif-fraction peaks related to the ordered phase have almost disap-peared (single scattering peak observed at small angle). Bothsamples B and C might correspond then to homogeneous non-ordered phases. This is confirmed by TEM analysis on sample C(Fig. 3(b)). No ordered domain was observed in any part of the cut-ted microspheres. The N2 adsorption–desorption isotherms of sam-ple C are of type II according to IUPAC convention [28]. Indeed, thepore size is only slightly above the micropore range (dp = 2.3 nm).The BET specific surface area SBET is 747 m2 g�1 and Vs = 0.17cm3 g�1.
3.5. Siloxane network
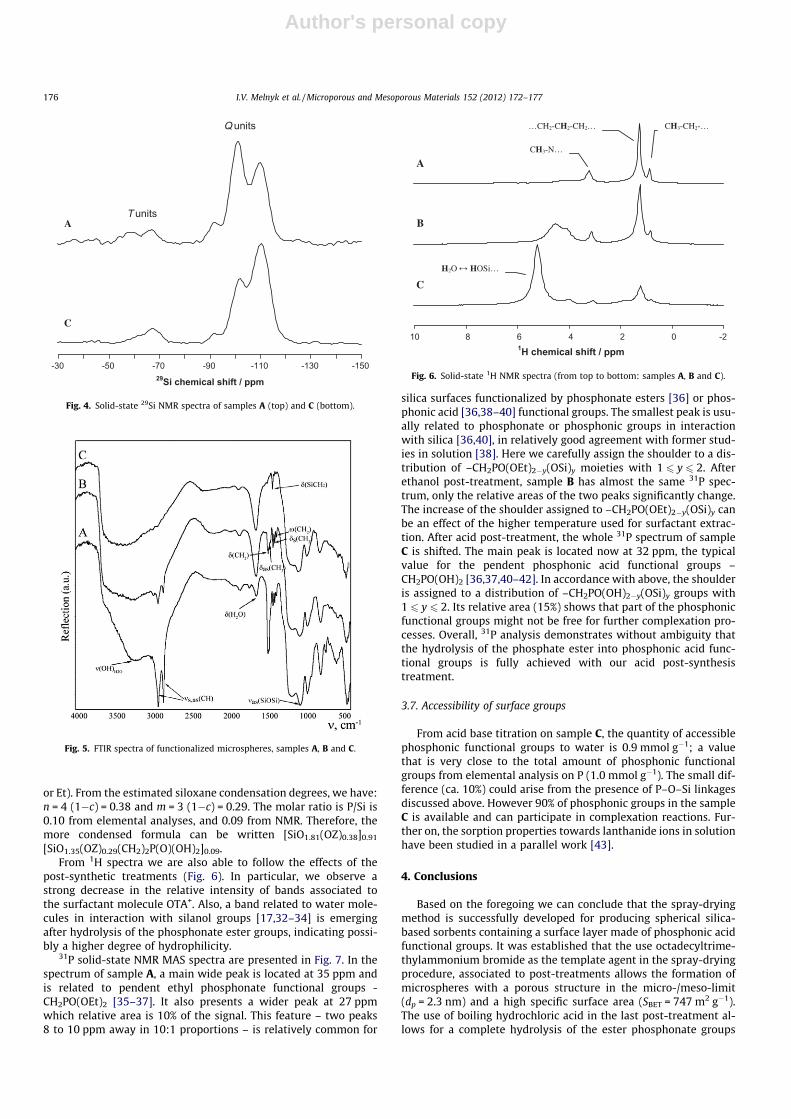
From 29Si NMR spectra (Fig. 4), we conclude that the molar pro-portion of Q and T units fixed in solution to 9:1 is preserved overthe different treatments as also concluded from elemental analyses(vide supra). In that sense, our procedure for anchoring T on Q units’oligomers is effective and robust. In addition, by comparing andmodeling the 29Si NMR spectra of samples A and C, we noticed thatthe condensation degree increases from 0.84 to 0.91, and from 0.82to 0.90 for Q and T units respectively. The post-treatments favor in-deed the extent of the polycondensation process.
The existence of three-dimensional polysiloxane network in thesamples is confirmed by the presence of the most intense absorp-tion band in the region 1030–1080 cm�1 of IR spectra (Fig. 5),which refers to mas(SiOSi). When polysiloxane samples contain sil-icon atoms surrounded by O3SiC, this absorption band usually hasa broad intense high-frequency shoulder [29] (Fig. 5).
3.6. Surface groups
DPETES is identified by the absorption band of m(P@O) at1241 cm�1 in the IR spectrum [30]. For the IR spectra of xerogels,containing the surface functional groups „Si(CH2)2P(O)(OC2H5)2
or „Si(CH2)2P(O)(OH)2 [30], this absorption band shifts to
30
3234
36
3840
4244
46
4850
11 12 13 14 15 16 17 18 19Chain length n
Cel
l par
amet
er a
(A)
Fig. 1. Variations in cell parameter a (p6mm space group considered) andsurfactant chain length n. The line results from a least squares regression fit(a = 2.08 n + 9.29 Å, with v2 > 0.99).
Fig. 2. Morphology of functionalized microspheres. SEM micrographs of sample C.
174 I.V. Melnyk et al. / Microporous and Mesoporous Materials 152 (2012) 172–177
Author's personal copy
low-frequency region (because of the participation of „P@O inhydrogen bond) and often cannot be identified. This is because itis masked by the intense high-frequency shoulder of mas(SiOSi)band (see above). The same situation is observed for the samplesA, B, and C (Fig. 5): the band corresponding to „P@O groups (at1220 cm�1) overlaps with vibrational band arising from polysilox-ane network (in the region 1100–1200 cm�1).
Moreover, the presence of „Si(CH2)2P(O)(OC2H5)2 functionalgroups in the surface layer ensures the appearance of five absorp-tion bands of medium intensity in the range 1350–1500 cm�1 of IRspectra, four of which (at �1370, �1395, �1445, and �1480 cm�1)are associated with variations of ethoxygroups near phosphorusatom [30]. However, for sample A the last two of them are maskedby an intense absorption band at 1480 cm�1, characteristic fordeformation vibrations of methylene groups of OTAB (Fig. 5). Thisis also observed for sample B, indicating incomplete removal of the
template by boiling with ethanol (Fig. 5). In the IR spectrum ofsample C, there is only one low-intensity absorption band at�1413 cm�1 in this region (Fig. 5), which can be assigned to defor-mation vibrations d((Si)CH2) of ethyl fragment in „Si(CH2)2P(O)@groups [31]. The presence of this later band in the spectrum of Cand the absence of the four bands testify to the completeness ofhydrolysis of ester groups. We note that at about 1645 cm�1 thereis the absorption band d(H2O) in the IR spectra, indicating the pres-ence of water. In the IR spectrum of C, it seems to overlap with theabsorption band corresponding to one of the oscillation fragment –P(O)(OH)2 [31]. The presence of water, participating in hydrogenbonds, is confirmed by the broad absorption band above3100 cm�1 in the IR spectra (Fig. 5).
From these first characterizations, we can conclude that thegeneral formula of the siloxane skeleton in sample C is[SiO2�n/2(OZ)n]0.9[SiO1.5�m/2(OZ)m(CH2)2P(O)(OH)2]0.1, with Z @ (H
1 2 3 4 5 6
100
110 200
Inte
nsity
(a.
u.)
2 theta (o)2 4 6 8
2 theta (o)
Inte
nsity
(a.
u.)
А
B
C
0.0 0.2 0.4 0.6 0.8 1.0
0
50
100
150
200
250
Vol
ume
N2 a
dsor
bed
(cm
3 /g)
Relative Pressure (P/Po)
(e)
(a) (b)
Fig. 3. Texture of functionalized microspheres: (a) XRD pattern for samples A, (b) XRD patterns for samples A, B and C, (c) TEM micrograph of sample A, (d) TEM micrographof sample C, (e) N2 sorption (d) desorption (s) isotherms at 77 K of sample C.
I.V. Melnyk et al. / Microporous and Mesoporous Materials 152 (2012) 172–177 175
Author's personal copy
or Et). From the estimated siloxane condensation degrees, we have:n = 4 (1�c) = 0.38 and m = 3 (1�c) = 0.29. The molar ratio is P/Si is0.10 from elemental analyses, and 0.09 from NMR. Therefore, themore condensed formula can be written [SiO1.81(OZ)0.38]0.91
[SiO1.35(OZ)0.29(CH2)2P(O)(OH)2]0.09.From 1H spectra we are also able to follow the effects of the
post-synthetic treatments (Fig. 6). In particular, we observe astrong decrease in the relative intensity of bands associated tothe surfactant molecule OTA+. Also, a band related to water mole-cules in interaction with silanol groups [17,32–34] is emergingafter hydrolysis of the phosphonate ester groups, indicating possi-bly a higher degree of hydrophilicity.
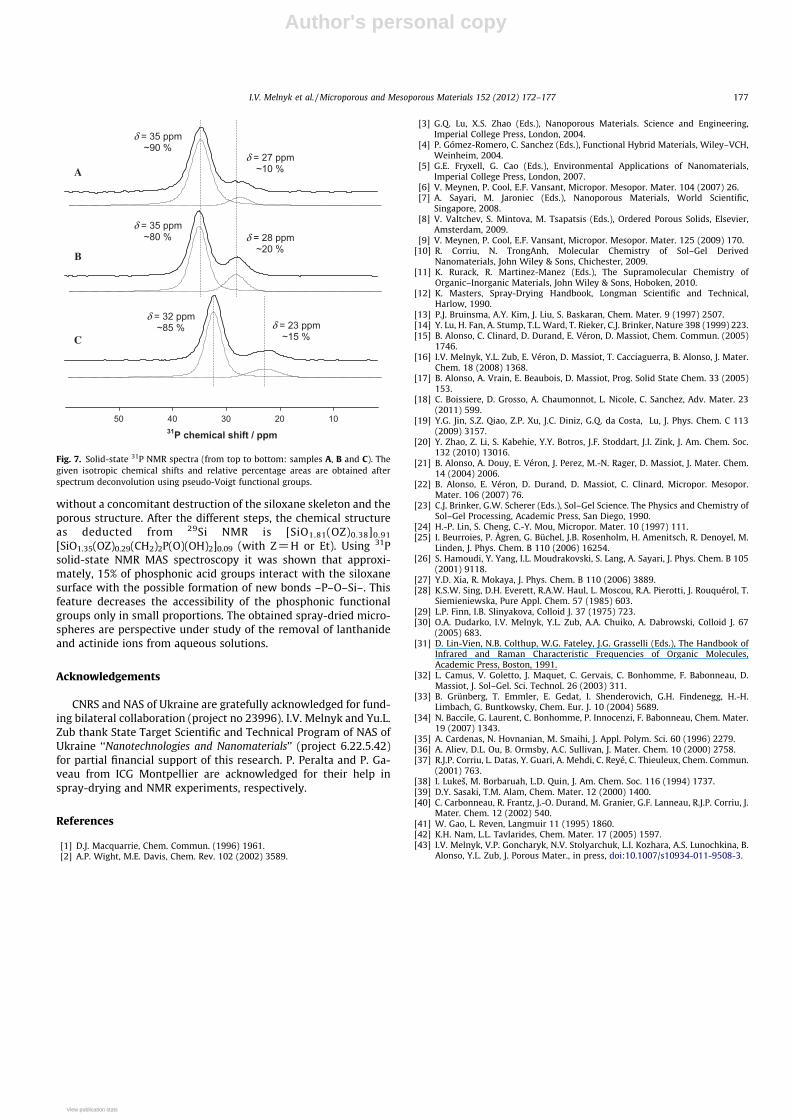
31P solid-state NMR MAS spectra are presented in Fig. 7. In thespectrum of sample A, a main wide peak is located at 35 ppm andis related to pendent ethyl phosphonate functional groups -CH2PO(OEt)2 [35–37]. It also presents a wider peak at 27 ppmwhich relative area is 10% of the signal. This feature – two peaks8 to 10 ppm away in 10:1 proportions – is relatively common for
silica surfaces functionalized by phosphonate esters [36] or phos-phonic acid [36,38–40] functional groups. The smallest peak is usu-ally related to phosphonate or phosphonic groups in interactionwith silica [36,40], in relatively good agreement with former stud-ies in solution [38]. Here we carefully assign the shoulder to a dis-tribution of –CH2PO(OEt)2�y(OSi)y moieties with 1 6 y 6 2. Afterethanol post-treatment, sample B has almost the same 31P spec-trum, only the relative areas of the two peaks significantly change.The increase of the shoulder assigned to –CH2PO(OEt)2�y(OSi)y canbe an effect of the higher temperature used for surfactant extrac-tion. After acid post-treatment, the whole 31P spectrum of sampleC is shifted. The main peak is located now at 32 ppm, the typicalvalue for the pendent phosphonic acid functional groups –CH2PO(OH)2 [36,37,40–42]. In accordance with above, the shoulderis assigned to a distribution of –CH2PO(OH)2�y(OSi)y groups with1 6 y 6 2. Its relative area (15%) shows that part of the phosphonicfunctional groups might not be free for further complexation pro-cesses. Overall, 31P analysis demonstrates without ambiguity thatthe hydrolysis of the phosphate ester into phosphonic acid func-tional groups is fully achieved with our acid post-synthesistreatment.
3.7. Accessibility of surface groups
From acid base titration on sample C, the quantity of accessiblephosphonic functional groups to water is 0.9 mmol g�1; a valuethat is very close to the total amount of phosphonic functionalgroups from elemental analysis on P (1.0 mmol g�1). The small dif-ference (ca. 10%) could arise from the presence of P–O–Si linkagesdiscussed above. However 90% of phosphonic groups in the sampleC is available and can participate in complexation reactions. Fur-ther on, the sorption properties towards lanthanide ions in solutionhave been studied in a parallel work [43].
4. Conclusions
Based on the foregoing we can conclude that the spray-dryingmethod is successfully developed for producing spherical silica-based sorbents containing a surface layer made of phosphonic acidfunctional groups. It was established that the use octadecyltrime-thylammonium bromide as the template agent in the spray-dryingprocedure, associated to post-treatments allows the formation ofmicrospheres with a porous structure in the micro-/meso-limit(dp = 2.3 nm) and a high specific surface area (SBET = 747 m2 g�1).The use of boiling hydrochloric acid in the last post-treatment al-lows for a complete hydrolysis of the ester phosphonate groups
29Si chemical shift / ppm
A
C
-150-130-110-90-70-50-30
T units
Q units
Fig. 4. Solid-state 29Si NMR spectra of samples A (top) and C (bottom).
Fig. 5. FTIR spectra of functionalized microspheres, samples A, B and C.
1H chemical shift / ppm
A
B
C
-20246810
CH3-CH2-… …CH2-CH2-CH2…
CH3-N…
H2O HOSi…
Fig. 6. Solid-state 1H NMR spectra (from top to bottom: samples A, B and C).
176 I.V. Melnyk et al. / Microporous and Mesoporous Materials 152 (2012) 172–177
Author's personal copy
without a concomitant destruction of the siloxane skeleton and theporous structure. After the different steps, the chemical structureas deducted from 29Si NMR is [SiO1.81(OZ)0.38]0.91
[SiO1.35(OZ)0.29(CH2)2P(O)(OH)2]0.09 (with Z @ H or Et). Using 31Psolid-state NMR MAS spectroscopy it was shown that approxi-mately, 15% of phosphonic acid groups interact with the siloxanesurface with the possible formation of new bonds –P–O–Si–. Thisfeature decreases the accessibility of the phosphonic functionalgroups only in small proportions. The obtained spray-dried micro-spheres are perspective under study of the removal of lanthanideand actinide ions from aqueous solutions.
Acknowledgements
CNRS and NAS of Ukraine are gratefully acknowledged for fund-ing bilateral collaboration (project no 23996). I.V. Melnyk and Yu.L.Zub thank State Target Scientific and Technical Program of NAS ofUkraine ‘‘Nanotechnologies and Nanomaterials’’ (project 6.22.5.42)for partial financial support of this research. P. Peralta and P. Ga-veau from ICG Montpellier are acknowledged for their help inspray-drying and NMR experiments, respectively.
References
[1] D.J. Macquarrie, Chem. Commun. (1996) 1961.[2] A.P. Wight, M.E. Davis, Chem. Rev. 102 (2002) 3589.
[3] G.Q. Lu, X.S. Zhao (Eds.), Nanoporous Materials. Science and Engineering,Imperial College Press, London, 2004.
[4] P. Gómez-Romero, C. Sanchez (Eds.), Functional Hybrid Materials, Wiley–VCH,Weinheim, 2004.
[5] G.E. Fryxell, G. Cao (Eds.), Environmental Applications of Nanomaterials,Imperial College Press, London, 2007.
[6] V. Meynen, P. Cool, E.F. Vansant, Micropor. Mesopor. Mater. 104 (2007) 26.[7] A. Sayari, M. Jaroniec (Eds.), Nanoporous Materials, World Scientific,
Singapore, 2008.[8] V. Valtchev, S. Mintova, M. Tsapatsis (Eds.), Ordered Porous Solids, Elsevier,
Amsterdam, 2009.[9] V. Meynen, P. Cool, E.F. Vansant, Micropor. Mesopor. Mater. 125 (2009) 170.
[10] R. Corriu, N. TrongAnh, Molecular Chemistry of Sol–Gel DerivedNanomaterials, John Wiley & Sons, Chichester, 2009.
[11] K. Rurack, R. Martinez-Manez (Eds.), The Supramolecular Chemistry ofOrganic–Inorganic Materials, John Wiley & Sons, Hoboken, 2010.
[12] K. Masters, Spray-Drying Handbook, Longman Scientific and Technical,Harlow, 1990.
[13] P.J. Bruinsma, A.Y. Kim, J. Liu, S. Baskaran, Chem. Mater. 9 (1997) 2507.[14] Y. Lu, H. Fan, A. Stump, T.L. Ward, T. Rieker, C.J. Brinker, Nature 398 (1999) 223.[15] B. Alonso, C. Clinard, D. Durand, E. Véron, D. Massiot, Chem. Commun. (2005)
1746.[16] I.V. Melnyk, Y.L. Zub, E. Véron, D. Massiot, T. Cacciaguerra, B. Alonso, J. Mater.
Chem. 18 (2008) 1368.[17] B. Alonso, A. Vrain, E. Beaubois, D. Massiot, Prog. Solid State Chem. 33 (2005)
153.[18] C. Boissiere, D. Grosso, A. Chaumonnot, L. Nicole, C. Sanchez, Adv. Mater. 23
(2011) 599.[19] Y.G. Jin, S.Z. Qiao, Z.P. Xu, J.C. Diniz, G.Q. da Costa, Lu, J. Phys. Chem. C 113
(2009) 3157.[20] Y. Zhao, Z. Li, S. Kabehie, Y.Y. Botros, J.F. Stoddart, J.I. Zink, J. Am. Chem. Soc.
132 (2010) 13016.[21] B. Alonso, A. Douy, E. Véron, J. Perez, M.-N. Rager, D. Massiot, J. Mater. Chem.
14 (2004) 2006.[22] B. Alonso, E. Véron, D. Durand, D. Massiot, C. Clinard, Micropor. Mesopor.
Mater. 106 (2007) 76.[23] C.J. Brinker, G.W. Scherer (Eds.), Sol–Gel Science. The Physics and Chemistry of
Sol–Gel Processing, Academic Press, San Diego, 1990.[24] H.-P. Lin, S. Cheng, C.-Y. Mou, Micropor. Mater. 10 (1997) 111.[25] I. Beurroies, P. Ågren, G. Büchel, J.B. Rosenholm, H. Amenitsch, R. Denoyel, M.
Linden, J. Phys. Chem. B 110 (2006) 16254.[26] S. Hamoudi, Y. Yang, I.L. Moudrakovski, S. Lang, A. Sayari, J. Phys. Chem. B 105
(2001) 9118.[27] Y.D. Xia, R. Mokaya, J. Phys. Chem. B 110 (2006) 3889.[28] K.S.W. Sing, D.H. Everett, R.A.W. Haul, L. Moscou, R.A. Pierotti, J. Rouquérol, T.
Siemieniewska, Pure Appl. Chem. 57 (1985) 603.[29] L.P. Finn, I.B. Slinyakova, Colloid J. 37 (1975) 723.[30] O.A. Dudarko, I.V. Melnyk, Y.L. Zub, A.A. Chuiko, A. Dabrowski, Colloid J. 67
(2005) 683.[31] D. Lin-Vien, N.B. Colthup, W.G. Fateley, J.G. Grasselli (Eds.), The Handbook of
Infrared and Raman Characteristic Frequencies of Organic Molecules,Academic Press, Boston, 1991.
[32] L. Camus, V. Goletto, J. Maquet, C. Gervais, C. Bonhomme, F. Babonneau, D.Massiot, J. Sol–Gel. Sci. Technol. 26 (2003) 311.
[33] B. Grünberg, T. Emmler, E. Gedat, I. Shenderovich, G.H. Findenegg, H.-H.Limbach, G. Buntkowsky, Chem. Eur. J. 10 (2004) 5689.
[34] N. Baccile, G. Laurent, C. Bonhomme, P. Innocenzi, F. Babonneau, Chem. Mater.19 (2007) 1343.
[35] A. Cardenas, N. Hovnanian, M. Smaihi, J. Appl. Polym. Sci. 60 (1996) 2279.[36] A. Aliev, D.L. Ou, B. Ormsby, A.C. Sullivan, J. Mater. Chem. 10 (2000) 2758.[37] R.J.P. Corriu, L. Datas, Y. Guari, A. Mehdi, C. Reyé, C. Thieuleux, Chem. Commun.
(2001) 763.[38] I. Lukeš, M. Borbaruah, L.D. Quin, J. Am. Chem. Soc. 116 (1994) 1737.[39] D.Y. Sasaki, T.M. Alam, Chem. Mater. 12 (2000) 1400.[40] C. Carbonneau, R. Frantz, J.-O. Durand, M. Granier, G.F. Lanneau, R.J.P. Corriu, J.
Mater. Chem. 12 (2002) 540.[41] W. Gao, L. Reven, Langmuir 11 (1995) 1860.[42] K.H. Nam, L.L. Tavlarides, Chem. Mater. 17 (2005) 1597.[43] I.V. Melnyk, V.P. Goncharyk, N.V. Stolyarchuk, L.I. Kozhara, A.S. Lunochkina, B.
Alonso, Y.L. Zub, J. Porous Mater., in press, doi:10.1007/s10934-011-9508-3.
31P chemical shift / ppm1020304050
δ = 35 ppm ~90 %
δ = 35 ppm ~80 %
δ = 32 ppm ~85 %
δ = 27 ppm~10 %
δ = 28 ppm~20 %
δ = 23 ppm~15 %
A
B
C
Fig. 7. Solid-state 31P NMR spectra (from top to bottom: samples A, B and C). Thegiven isotropic chemical shifts and relative percentage areas are obtained afterspectrum deconvolution using pseudo-Voigt functional groups.
I.V. Melnyk et al. / Microporous and Mesoporous Materials 152 (2012) 172–177 177
View publication statsView publication stats