ong salary
TRANSCRIPT
8/3/2019 Ong Salary
http://slidepdf.com/reader/full/ong-salary 1/32
THE OIL & GAS
GLOBAL SALARYGUIDE 2011Global salaries and recruiting trends.
8/3/2019 Ong Salary
http://slidepdf.com/reader/full/ong-salary 2/32
2 | Oil & Gas Salary Guide 2011
Contents
4 Managing Director Reports
6 A Global Perspective
Section One - Salary Information9 Salary Trends
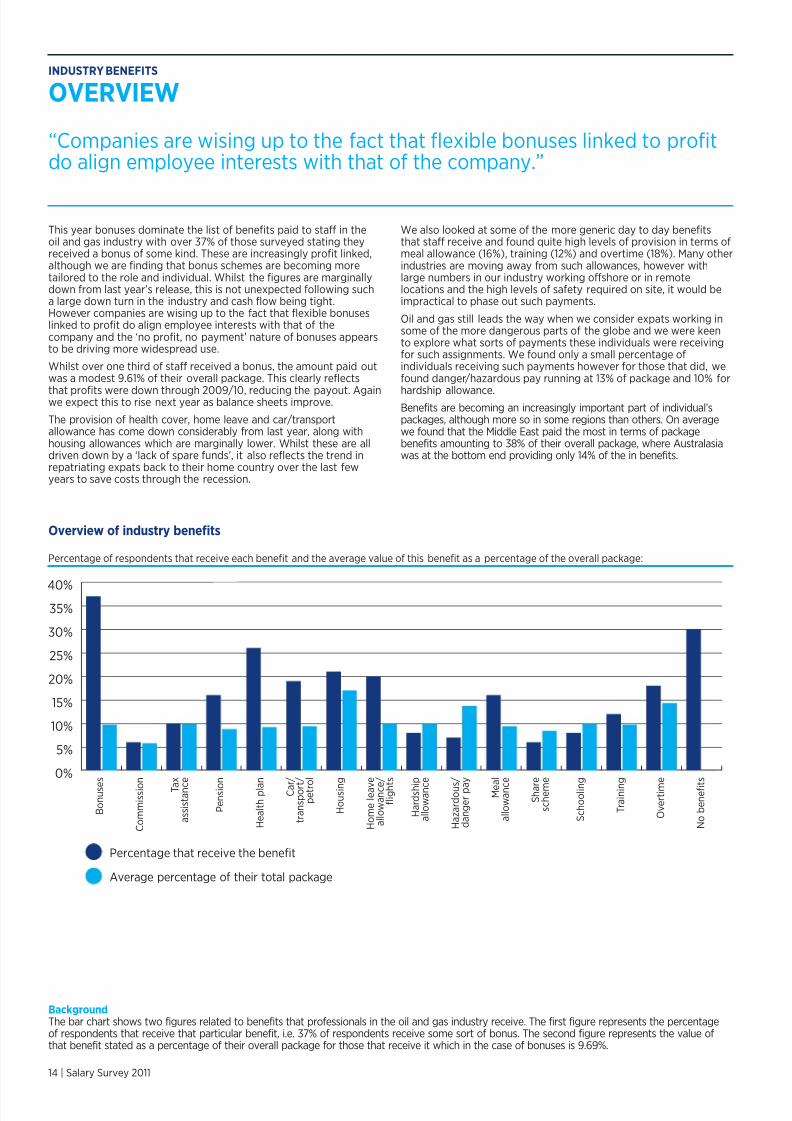
10 Overview
11 Salaries
Section Two - Industry Benefits14 Overview
15 Top Beneits by Company Type
16 Top Beneits by Region
Section Three - Industry Employment19 Overview
20 Diversity
21 Movement o Workorce
22 Experience and Tenure24 Employment Mix
26 Staing Levels
Section Four - Economic Outlook28 Overview
29 Salaries
THANK YOUWe would like to express our gratitude to all those organisations and individuals who participatedin the collection o data or this year’s survey. More than 10,000 people responded which wascertainly overwhelming. This has ensured that we can produce an inormative document to help
support your business decisions.
Disclaimer: The Oil & Gas Global Salary Guide 2011 is representative o a value added service to our clients and candidates. Whilst every care is taken in the collection andcompilation o data, the survey is interpretive and indicative, not conclusive. Thereore inormation should be used as a guideline only and should not be reproduced intotal or by section without written permission rom Hays.
8/3/2019 Ong Salary
http://slidepdf.com/reader/full/ong-salary 3/32
8/3/2019 Ong Salary
http://slidepdf.com/reader/full/ong-salary 4/32
MATT UNDERHILL
MANAGING DIRECTOR REPORT
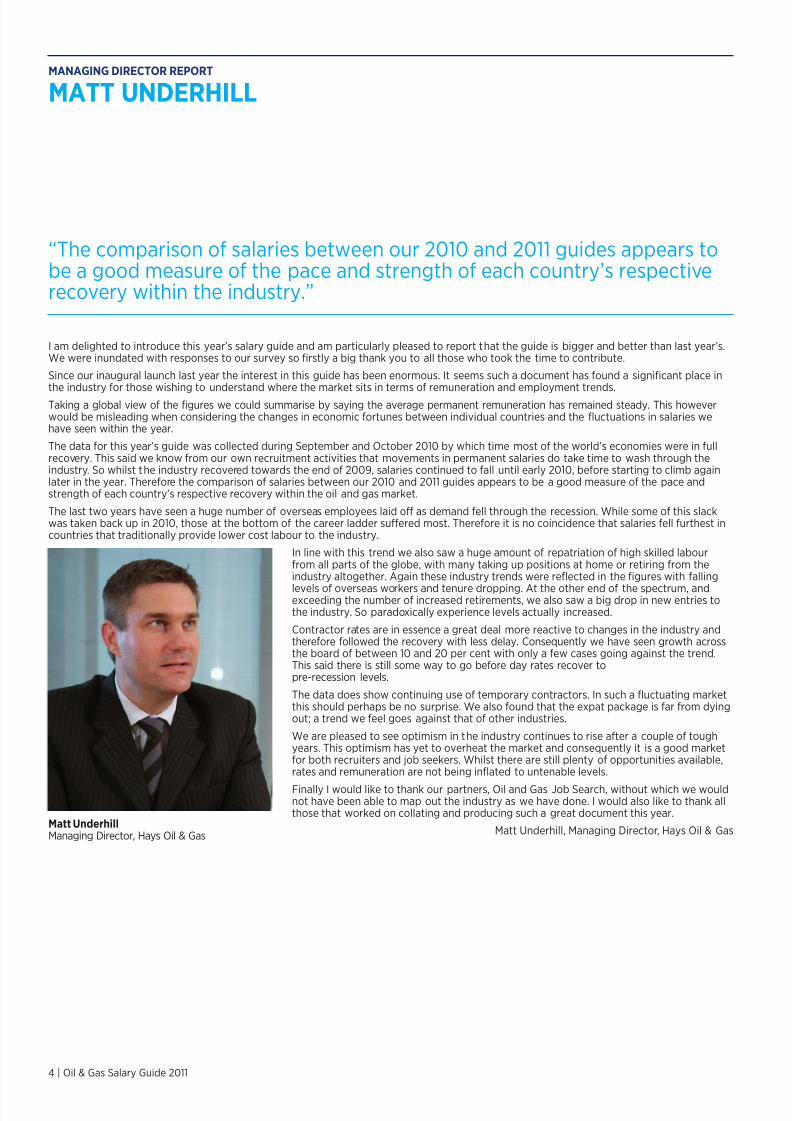
“The comparison o salaries between our 2010 and 2011 guides appears tobe a good measure o the pace and strength o each country’s respectiverecovery within the industry.”
I am delighted to introduce this year’s salary guide and am particularly pleased to report that the guide is bigger and better than last year’s.We were inundated with responses to our survey so irstly a big thank you to all those who took the time to contribute.
Since our inaugural launch last year the interest in this guide has been enormous. It seems such a document has ound a signiicant place inthe industry or those wishing to understand where the market sits in terms o remuneration and employment trends.
Taking a global view o the igures we could summarise by saying the average permanent remuneration has remained steady. This howeverwould be misleading when considering the changes in economic ortunes between individual countries and the luctuations in salaries wehave seen within the year.
The data or this year’s guide was collected during September and October 2010 by which time most o the world’s economies were in ullrecovery. This said we know rom our own recruitment activities that movements in permanent salaries do take time to wash through theindustry. So whilst the industry recovered towards the end o 2009, salaries continued to all until early 2010, beore starting to climb againlater in the year. Thereore the comparison o salaries between our 2010 and 2011 guides appears to be a good measure o the pace andstrength o each country’s respective recovery within the oil and gas market.
The last two years have seen a huge number o overseas employees laid o as demand ell through the recession. While some o this slackwas taken back up in 2010, those at the bottom o the career ladder suered most. Thereore it is no coincidence that salaries ell urthest incountries that traditionally provide lower cost labour to the industry.
In line with this trend we also saw a huge amount o repatriation o high skilled labourrom all parts o the globe, with many taking up positions at home or retiring rom theindustry altogether. Again these industry trends were relected in the igures with alling
levels o overseas workers and tenure dropping. At the other end o the spectrum, andexceeding the number o increased retirements, we also saw a big drop in new entries tothe industry. So paradoxically experience levels actually increased.
Contractor rates are in essence a great deal more reactive to changes in the industry andthereore ollowed the recovery with less delay. Consequently we have seen growth acrossthe board o between 10 and 20 per cent with only a ew cases going against the trend.This said there is still some way to go beore day rates recover topre-recession levels.
The data does show continuing use o temporary contractors. In such a luctuating marketthis should perhaps be no surprise. We also ound that the expat package is ar rom dyingout; a trend we eel goes against that o other industries.
We are pleased to see optimism in the industry continues to rise ater a couple o toughyears. This optimism has yet to overheat the market and consequently it is a good marketor both recruiters and job seekers. Whilst there are still plenty o opportunities available,rates and remuneration are not being inlated to untenable levels.
Finally I would like to thank our partners, Oil and Gas Job Search, without which we wouldnot have been able to map out the industry as we have done. I would also like to thank allthose that worked on collating and producing such a great document this year.
Matt Underhill, Managing Director, Hays Oil & Gas
4 | Oil & Gas Salary Guide 2011
Matt Underhill
Managing Director, Hays Oil & Gas
8/3/2019 Ong Salary
http://slidepdf.com/reader/full/ong-salary 5/32
DUNCAN FREER
MANAGING DIRECTOR REPORT
“I was extremely pleased that almost 11,000 industry proessionals rommore than 20 diferent disciplines completed the survey. This equates to avery impressive increase on the previous year.”
We are again delighted to partner with Hays to deliver to the industry the second issue othe Global Oil and Gas Salary Guide.
Our objective is to provide both recruiters and job seekers with a better understanding othe approximate levels o pay, beneits and conidence that currently exist in the market. Inso doing, employers and employees can ensure they are getting value or money in theiremployment dealings. Clearly, undertaking a global survey within such a large industry isno small task, and equally to drill down into speciic roles or geographic regions wouldstart to render the data inaccurate. We have thereore concentrated on the averages orgroups o employees in the industry deined by: which country they are working in andwhere they are rom; the discipline area in which they work; how much experience theyhave; and how they are employed (i.e. permanent sta or temporary contract).
Last year’s inaugural guide was completed by over 7,000 participants with the resultsbeing published in February 2010. Following publication, we oered ree access via theOilandgasjobsearch and Hays websites. This led to over 35,000 downloads within the irstmonth o launch. The eedback rom our candidates and clients was very encouraging andit quickly became apparent that we had created a document without compare in theindustry, and its insights and level o detail was attracting huge levels o interest. Thisencouraged us to repeat the undertaking and once again we approached our customersand users to complete a detailed survey that would orm the basis o the 2011 guide. Initiallevels o participation were astounding and I was extremely pleased that almost 11,000industry proessionals rom more than 20 dierent disciplines completed the survey. Thisequates to a very impressive increase on the previous year.
The 2011 guide diers rom last year’s in that we have been able to provide details on thesalary trends o dierent types o jobs in a range o locations by using last year as abenchmark. We have also included more data in the beneits and packages section: alwaysan emotive subject. In addition, we have expanded the number o countries in this year’sguide to over 50 which means that we have now covered the majority o the ‘signiicant’oil and gas locations.
As is demonstrated in our igures a level o conidence has been restored to many o the global energy markets evidenced by there-emergence o the oil sands activity in Canada and the Australian market leading the way with several huge projects passing inalinvestment decision (with more to come in 2011). The South East Asian markets have also seen strong expansion in exploration andproduction to satisy growing demand. One o the other main points rom the guide is that a greater number o proessionals are moreoptimistic about the uture even in light o the diicult market conditions elsewhere. With greater stability in the oil price and moreconidence in inancial markets, I am equally as optimistic about the industry or 2011 and beyond.
Oilandgasjobsearch has mirrored the industry as a whole over the last 12 months with an increase in jobs posted, applications to jobs and amassive leap in the number o site users. We have ar more clients than we did last year and this again is a sign o the increased conidencein the sector. We have recently opened a new oice in Australia to help ulill the needs o our Australian and Paciic based clients andcandidates. We are also looking to expand in the Middle East during 2011.
I am sure that the detailed content o the guide will prove to be an invaluable source o data or many in the industry rom recruiters to jobseekers alike.
I would like to take this opportunity to thank our partners, Hays Oil & Gas, and all the participants who took the time to complete the survey.
Duncan Freer, Managing Director, Oil and Gas Job Search
Oil & Gas Salary Guide 2011 | 5
Duncan FreerManaging Director, Oil and Gas Job Search
8/3/2019 Ong Salary
http://slidepdf.com/reader/full/ong-salary 6/32
6 | Oil & Gas Salary Guide 2011
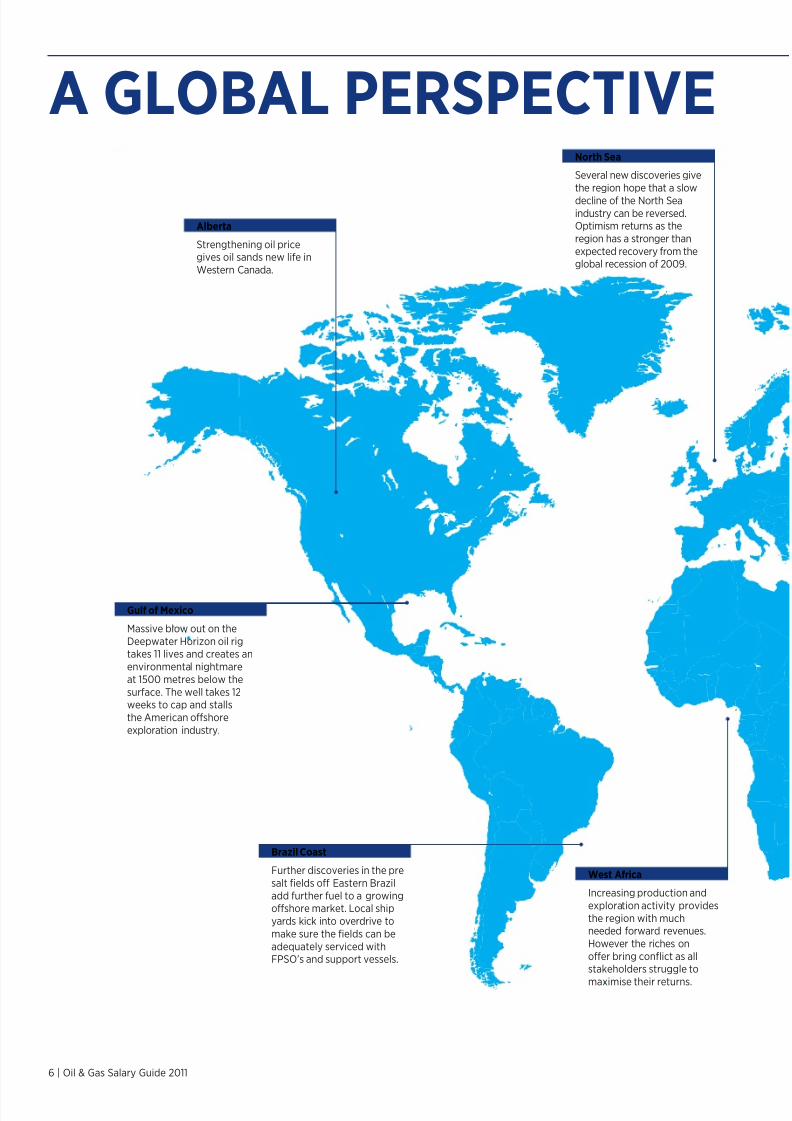
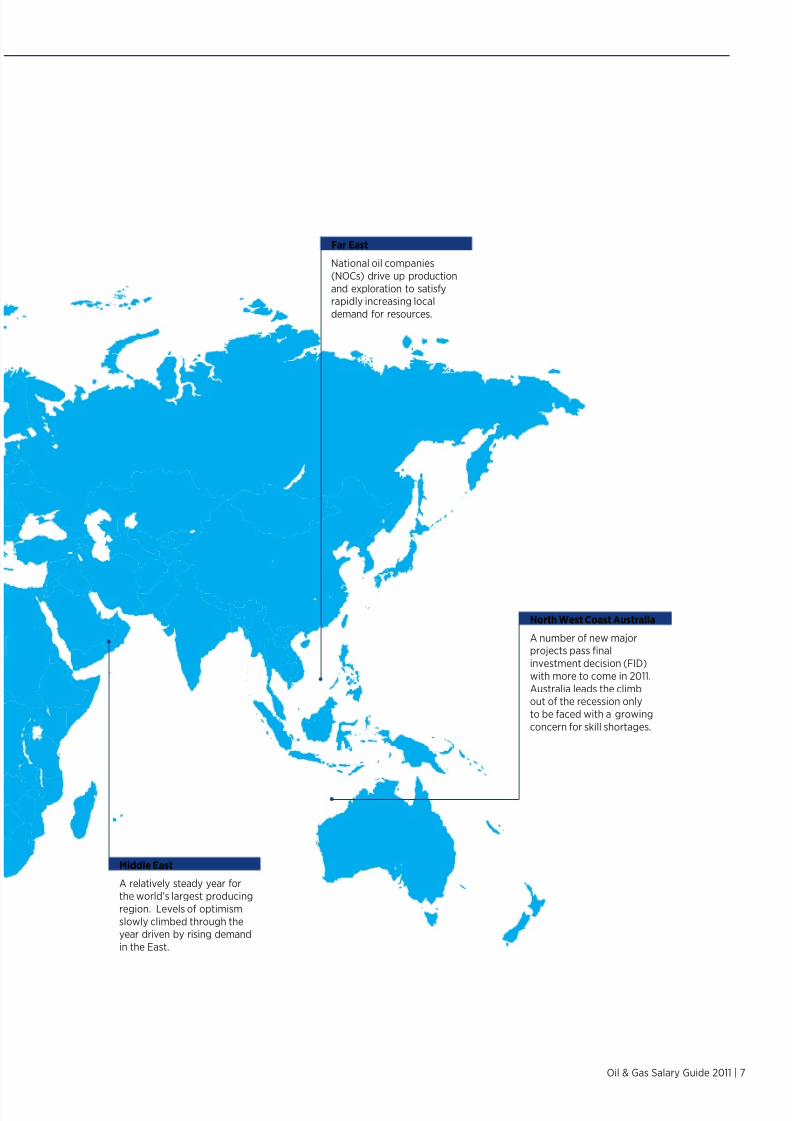
A GLOBAL PERSPECTIVE
Alberta
Strengthening oil pricegives oil sands new lie in
Western Canada.
North Sea
Several new discoveries give
the region hope that a slow
decline o the North Seaindustry can be reversed.Optimism returns as the
region has a stronger than
expected recovery rom theglobal recession o 2009.
West Africa
Increasing production and
exploration activity provides
the region with muchneeded orward revenues.
However the riches on
ofer bring conflict as allstakeholders struggle to
maximise their returns.
Gulf of Mexico
Massive blow out on the
Deepwater Horizon oil rigtakes 11 lives and creates an
environmental nightmare
at 1500 metres below the
surace. The well takes 12weeks to cap and stalls
the American ofshore
exploration industry.
Brazil Coast
Further discoveries in the pre
salt fields of Eastern Brazil
add urther uel to a growingofshore market. Local ship
yards kick into overdrive to
make sure the fields can be
adequately serviced withFPSO’s and support vessels.
8/3/2019 Ong Salary
http://slidepdf.com/reader/full/ong-salary 7/32
8/3/2019 Ong Salary
http://slidepdf.com/reader/full/ong-salary 8/32
8 | Oil & Gas Salary Guide 2011
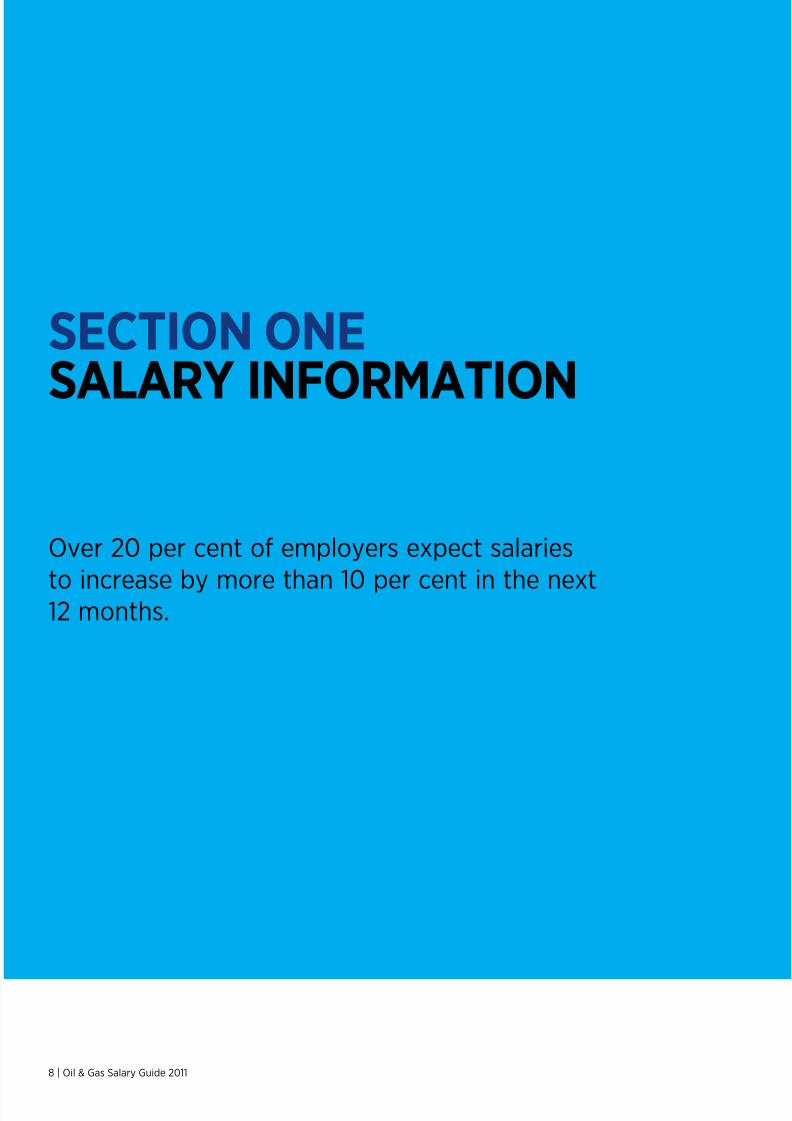
SECTION ONE
SALARY INFORMATION
Over 20 per cent o employers expect salaries
to increase by more than 10 per cent in the next12 months.
8/3/2019 Ong Salary
http://slidepdf.com/reader/full/ong-salary 9/32
Salary Survey 2011 | 9
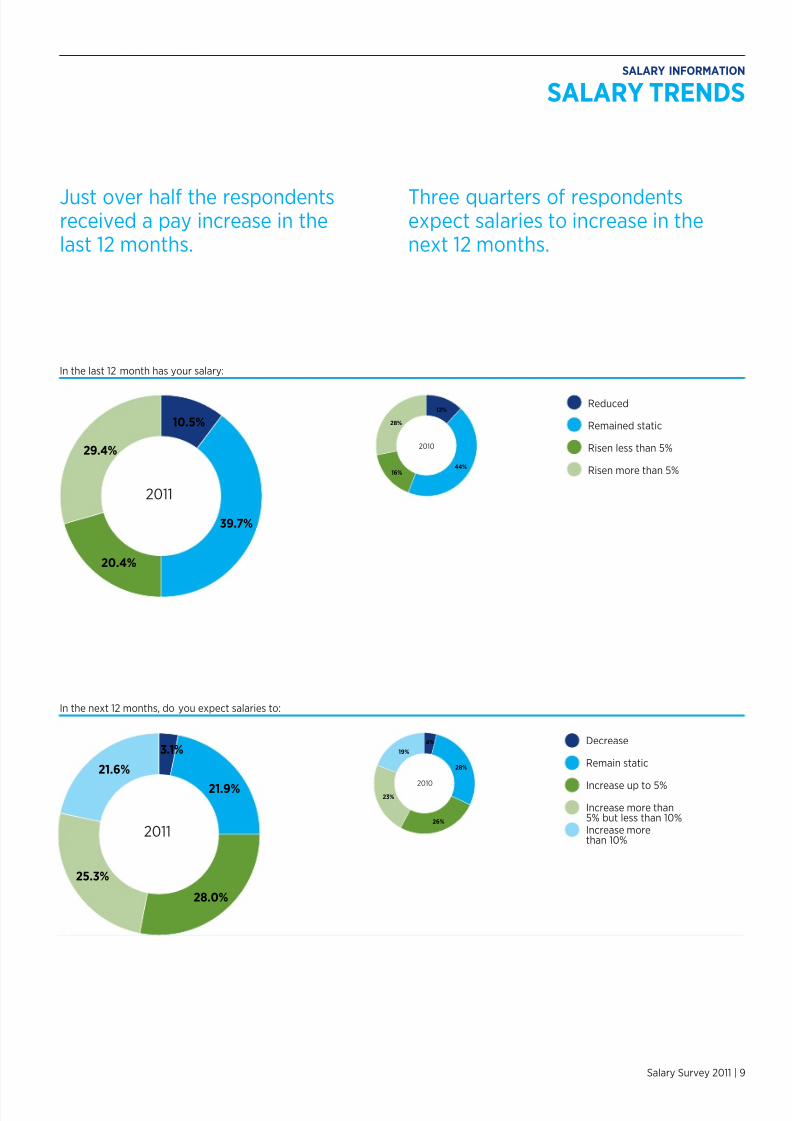
Three quarters o respondentsexpect salaries to increase in thenext 12 months.
Just over hal the respondentsreceived a pay increase in thelast 12 months.
SALARY TRENDSSALARY INFORMATION
Reduced
Remained static
Risen less than 5%
Risen more than 5%
10.5%
39.7%
20.4%
29.4%
12%
44%16%
28%
2010
2011
Decrease
Remain static
Increase up to 5%
Increase more than5% but less than 10%Increase morethan 10%
3.1%
21.9%
28.0%
25.3%
21.6%
4%
28%
26%
23%
19%
2010
2011
In the last 12 month has your salary:
In the next 12 months, do you expect salaries to:
8/3/2019 Ong Salary
http://slidepdf.com/reader/full/ong-salary 10/32
8/3/2019 Ong Salary
http://slidepdf.com/reader/full/ong-salary 11/32
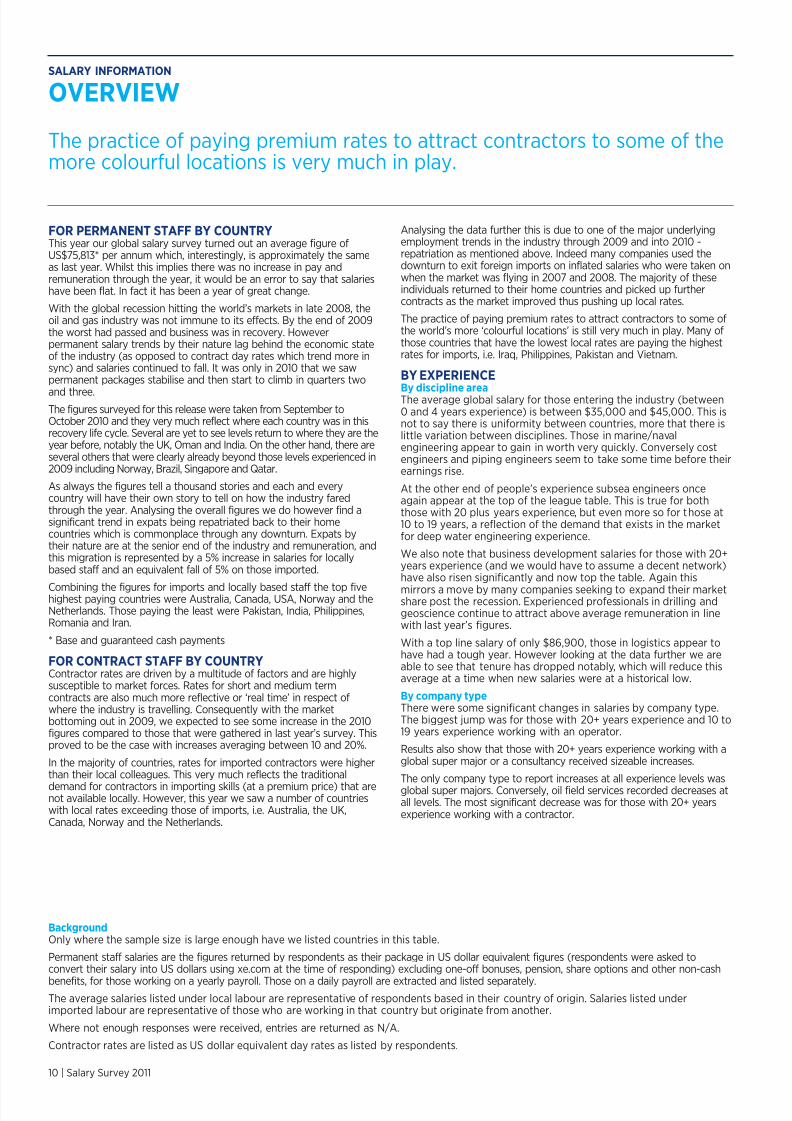
Algeria
Angola
Argentina
Australia
Azerbaijan
Bahrain
Brazil
Canada
China
Colombia
Egypt
France
IndiaIndonesia
Iran
Iraq
Italy
Japan
Kazakhstan
Korea
Kuwait
Libya
Malaysia
Mexico
Netherlands
New Zealand
Nigeria
Norway
Oman
Pakistan
Papua New Guinea
Philippines
Poland
Portugal
Qatar
Romania
Russia
Saudi ArabiaSingapore
South Africa
Spain
Sudan
Trinidad & Tobago
Turkey
Turkmenistan
United Arab Emirates
United Kingdom
USA
Venezuela
Vietnam
Yemen
42,900 430 93,400 770
33,500 410 108,500 1,040
66,000 N/A 119,000 660
143,700 1,080 144,600 1,020
37,900 490 141,600 960
56,000 N/A 75,000 570
99,500 570 99,500 780
129,900 970 111,400 910
49,400 540 109,900 910
49,700 440 177,500 1,590
44,000 440 121,300 990
106,000 830 111,300 930
35,600 400 104,400 69041,800 430 125,000 930
40,900 390 83,400 470
21,700 280 94,800 1,060
73,900 730 88,600 740
N/A 580 128,300 1,050
32,400 390 129,400 1,060
120,800 560 130,400 1,010
N/A 550 72,900 640
42,300 440 87,400 820
50,200 490 109,900 740
57,900 530 95,700 780
124,300 1,280 107,500 880
107,200 860 101,400 1,190
39,600 460 126,200 940
130,300 1,290 119,800 1,020
40,400 580 72,200 610
25,500 360 60,300 1,300
31,200 300 197,200 1,000
37,600 390 135,000 1,270
54,100 460 77,500 1,010
N/A 340 N/A 920
69,000 550 77,300 610
38,900 450 120,000 570
63,000 550 127,800 1,020
61,200 480 65,200 54066,300 500 98,500 720
76,200 630 92,500 540
77,000 570 93,800 900
36,800 450 62,000 720
49,700 440 184,700 1,290
68,200 500 82,600 470
N/A N/A N/A 1,060
61,200 610 69,200 550
86,700 820 76,300 670
117,000 840 110,700 870
59,700 520 111,200 890
29,600 240 140,400 1,080
23,300 290 97,800 870
Imported LabourLocal Labour
CountryAverage
annual salary
Average
daily rate
Average
annual salary
Average
daily rate
Oil & Gas Salary Guide 2011 | 11
SALARIESSALARY INFORMATION
Notes: All igures are base salaries, quoted in US dollars. Annual salaries to the nearest one hundred, daily rates to the nearest ten.
8/3/2019 Ong Salary
http://slidepdf.com/reader/full/ong-salary 12/32
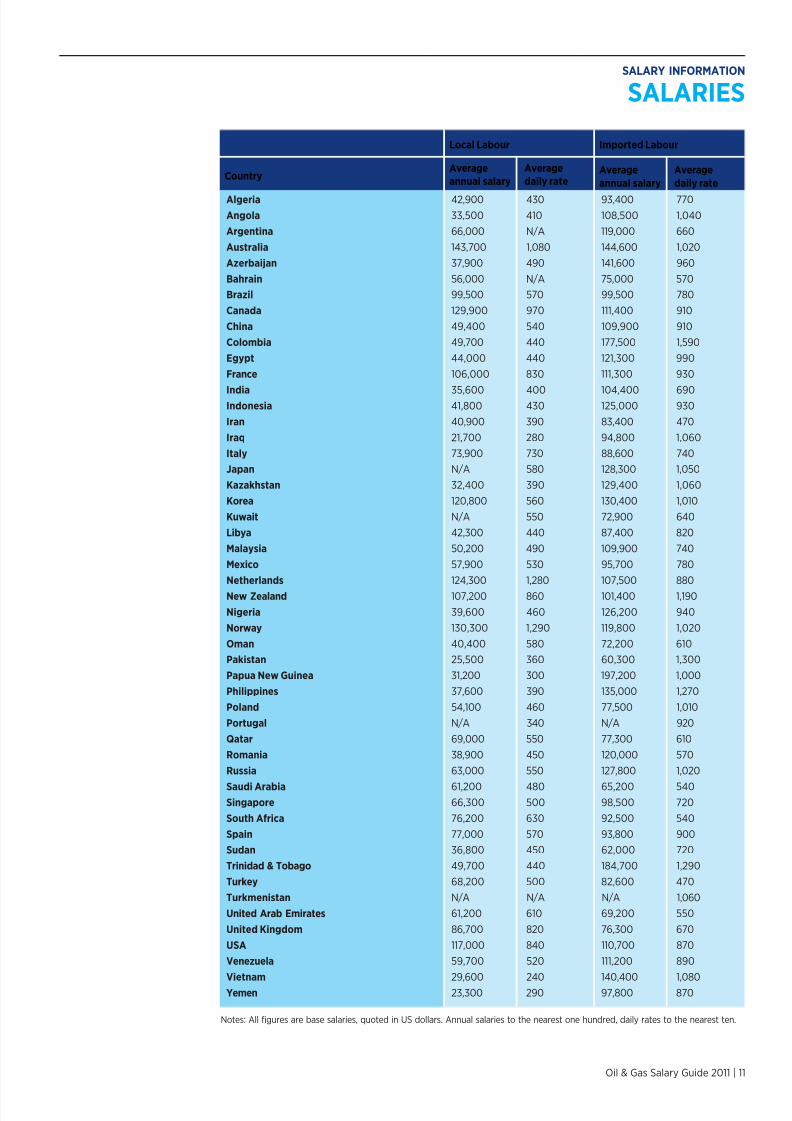
Notes: All igures are base salaries, quoted in US dollars. Annual salaries to the nearest one hundred, daily rates to the nearest ten.
EPCM - Engineering, procurement and construction management;
HSE - Health, saety and environment; QA/QC - Quality assurance/quality control.
Business Development/ CommercialConstruction/ Installation
Downstream Operations Management
Drilling
Electrical
Estimator/ Cost Engineer
Geoscience
Health, Safety and Environment (HSE)
Logistics
Marine/Naval
Mechanical
Piping
Process (chemical)
Production Management
Project Controls
Quality Assurance/Quality Control (QA/QC)
Reservoir/ Petroleum Engineering
Structural
Subsea/ Pipelines
Supply Chain/ Procurement
Technical Safety
Instrumentation, Controls & Automation
Maintenance
ConsultancyContractor
EPCM
Equipment Manufacture and Supply
Global Super Major
Oil Field Services
Operator
42,000 60,600 93,900 146,40034,700 46,600 81,000 125,900
45,200 56,900 83,900 115,900
46,700 59,100 94,600 131,800
35,900 49,100 77,900 109,400
30,700 50,800 80,500 106,300
41,500 64,900 93,700 138,000
36,300 52,300 86,500 115,100
34,700 45,400 72,300 86,900
54,900 64,500 92,200 115,900
34,800 47,400 70,500 107,300
30,500 42,300 66,500 101,200
34,400 50,400 77,600 126,400
43,400 75,800 95,900 124,700
44,600 59,900 94,600 124,100
38,500 49,800 83,000 110,700
45,000 58,100 86,500 109,600
42,600 47,100 84,100 111,100
46,600 89,100 122,600 137,400
39,300 51,500 79,900 115,500
34,400 48,500 87,700 108,900
42,600 50,600 70,800 112,000
23,300 33,200 57,900 112,900
44,800 57,400 92,600 129,70039,600 53,900 82,000 114,600
43,900 54,900 84,300 139,600
36,400 55,400 75,200 100,000
53,400 71,000 107,500 136,400
39,200 50,900 77,300 97,400
45,300 70,700 103,600 141,300
Years of experience
Discipline area
Company type
10 to 19
10 to 19
20 +
20 +
0 to 4
0 to 4
5 to 9
5 to 9
SALARIESSALARY INFORMATION
12 | Salary Survey 2011
8/3/2019 Ong Salary
http://slidepdf.com/reader/full/ong-salary 13/32
8/3/2019 Ong Salary
http://slidepdf.com/reader/full/ong-salary 14/32
8/3/2019 Ong Salary
http://slidepdf.com/reader/full/ong-salary 15/32
Salary Survey 2011 | 15
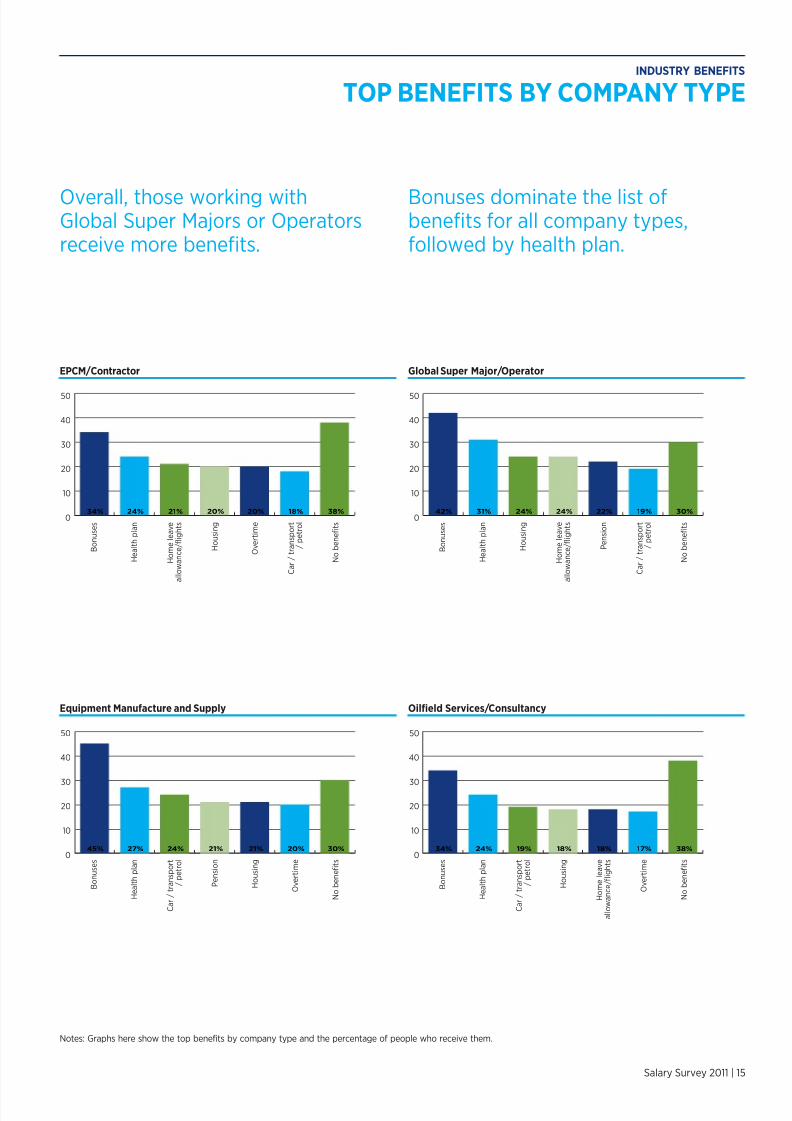
TOP BENEFITS BY COMPANY TYPEINDUSTRY BENEFITS
Bonuses dominate the list obenefits or all company types,ollowed by health plan.
Overall, those working withGlobal Super Majors or Operatorsreceive more benefits.
Global Super Major/Operator
Oilfield Services/Consultancy
0
10
20
30
40
50
B o n u s e s
H e a l t h p l a n
H o m e l e a v e
a l l o w a n c e / fl i g h t s
H o u s i n g
O v e r t i m e
C a r / t r a n s p o r t
/ p e t r o l
N o b e n e fi t s
34% 24% 21% 20% 20% 18% 38%
0
10
20
30
40
50
B o n u s e s
H e a l t h p l a n
C a r / t r a n s p o r t
/ p e t r o l
P e n s i o n
H o u s i n g
O v e r t i m e
N o b e n e fi t s
45% 27% 24% 21% 21% 20% 30%
0
10
20
30
40
50
B o n u s e s
H e a l t h p l a n
H o u s i n g
H o m e l e a v e
a l l o w a n c e / fl i g h t s
P e n s i o n
C a r / t r a n s p o r t
/ p e t r o l
N o b e n e fi t s
42% 31% 24% 24% 22% 19% 30%
0
10
20
30
40
50
B o n u s e s
H e a l t h p l a n
C a r / t r a n s p o r t
/ p e t r o l
H o u s i n g
H o m e l e a v e
a l l o w a n c e / fl i g h t s
O v e r t i m e
N o b e n e fi t s
34% 24% 19% 18% 18% 17% 38%
EPCM/Contractor
Equipment Manufacture and Supply
Notes: Graphs here show the top beneits by company type and the percentage o people who receive them.
8/3/2019 Ong Salary
http://slidepdf.com/reader/full/ong-salary 16/32
8/3/2019 Ong Salary
http://slidepdf.com/reader/full/ong-salary 17/32
Salary Survey 2011 | 17
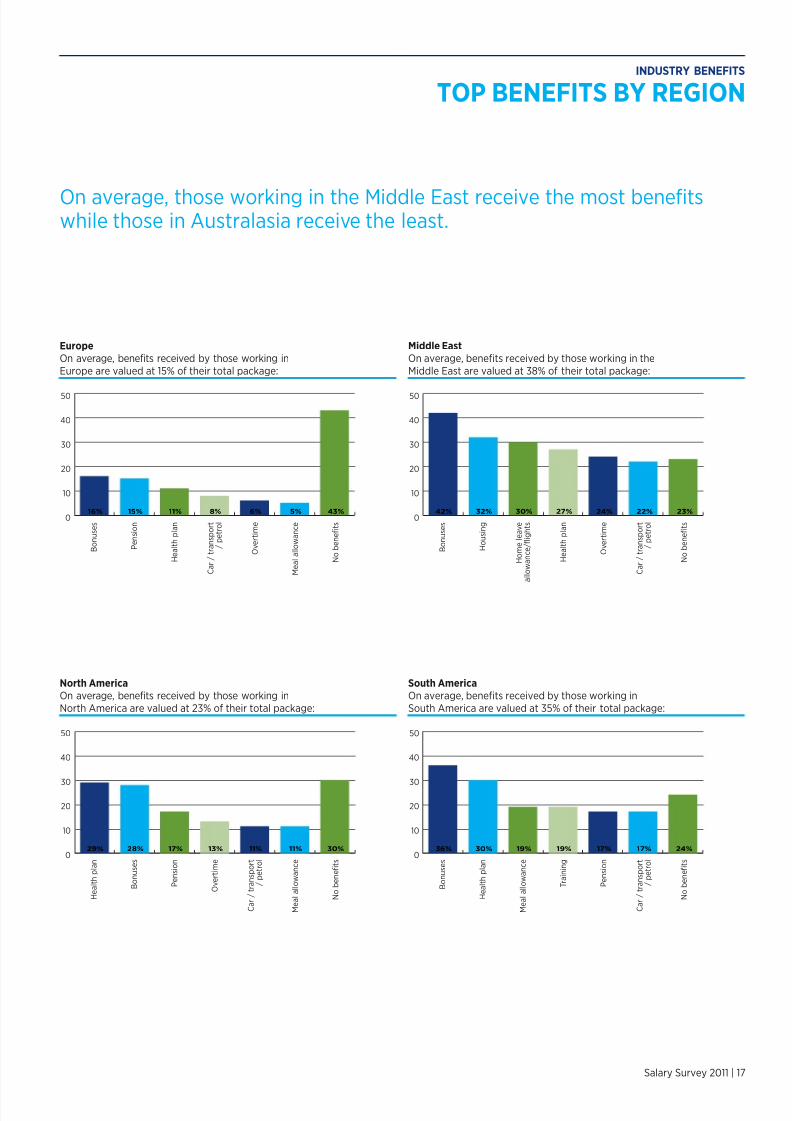
On average, those working in the Middle East receive the most benefitswhile those in Australasia receive the least.
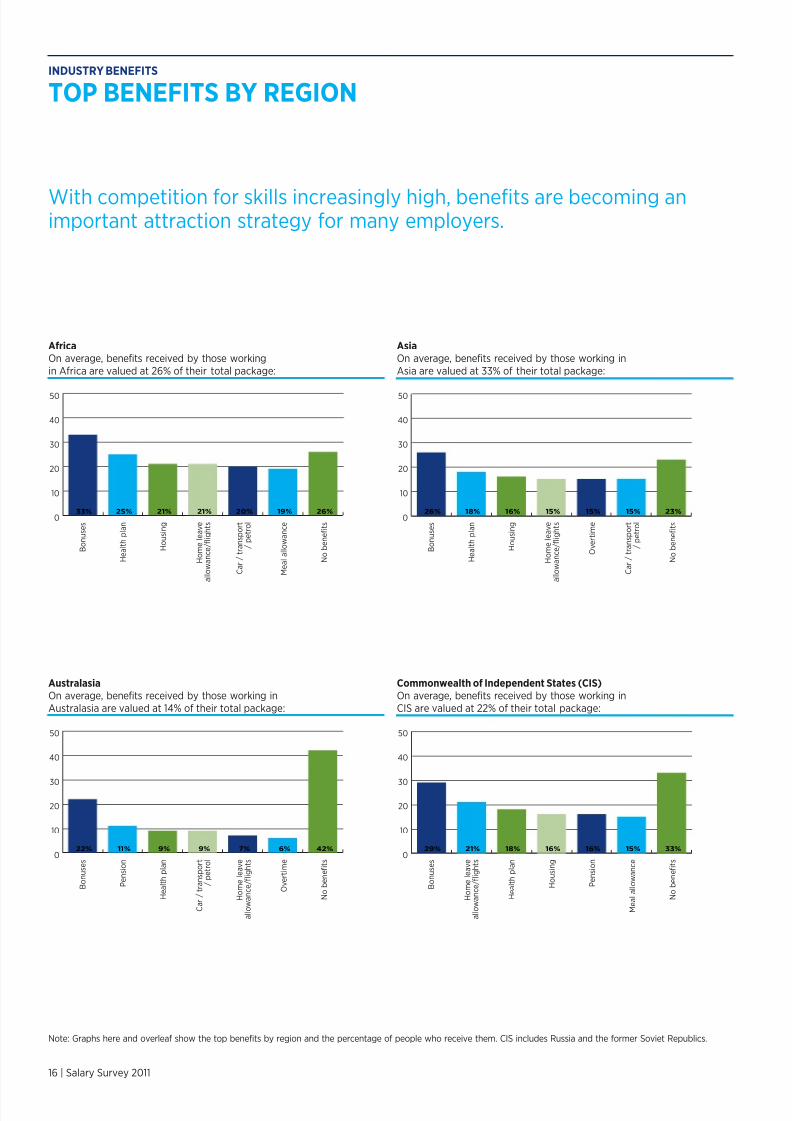
INDUSTRY BENEFITS
TOP BENEFITS BY REGION
Middle EastOn average, beneits received by those working in theMiddle East are valued at 38% o their total package:
South AmericaOn average, beneits received by those working inSouth America are valued at 35% o their total package:
0
10
20
30
40
50
B o n u s e s
P e n s i o n
H e a l t h p l a n
C a r / t r a n s p o r t
/ p e t r o l
O v e r t i m e
M e a l a l l o w a n c e
N o b e n e fi t s
16% 15% 11% 8% 6% 5% 43%
0
10
20
30
40
50
H e a l t h p l a n
B o n u s e s
P e n s i o n
O v e r t i m e
C a r / t r a n s p o r t
/ p e t r o l
M e a l a l l o w a n c e
N o b e n e fi t s
29% 28% 17% 13% 11% 11% 30%
0
10
20
30
40
50
B o n u s e s
H o u s i n g
H o m e l e a v e
a l l o w a n c e / fl i g h t s
H e a l t h p l a n
O v e r t i m e
C a r / t r a n s p o r t
/ p e t r o l
N o b e n e fi t s
42% 32% 30% 27% 24% 22% 23%
0
10
20
30
40
50
B o n u s e s
H e a l t h p l a n
M e a l a l l o w a n c e
T r a i n i n g
P e n s i o n
C a r / t r a n s p o r t
/ p e t r o l
N o b e n e fi t s
36% 30% 19% 19% 17% 17% 24%
EuropeOn average, beneits received by those working inEurope are valued at 15% o their total package:
North AmericaOn average, beneits received by those working inNorth America are valued at 23% o their total package:
8/3/2019 Ong Salary
http://slidepdf.com/reader/full/ong-salary 18/32
SECTION THREE
INDUSTRY EMPLOYMENT
There was a tide o repatriation over the
past 12 months as experienced sta returnedhome to seek work.
8/3/2019 Ong Salary
http://slidepdf.com/reader/full/ong-salary 19/32
Salary Survey 2011 | 19
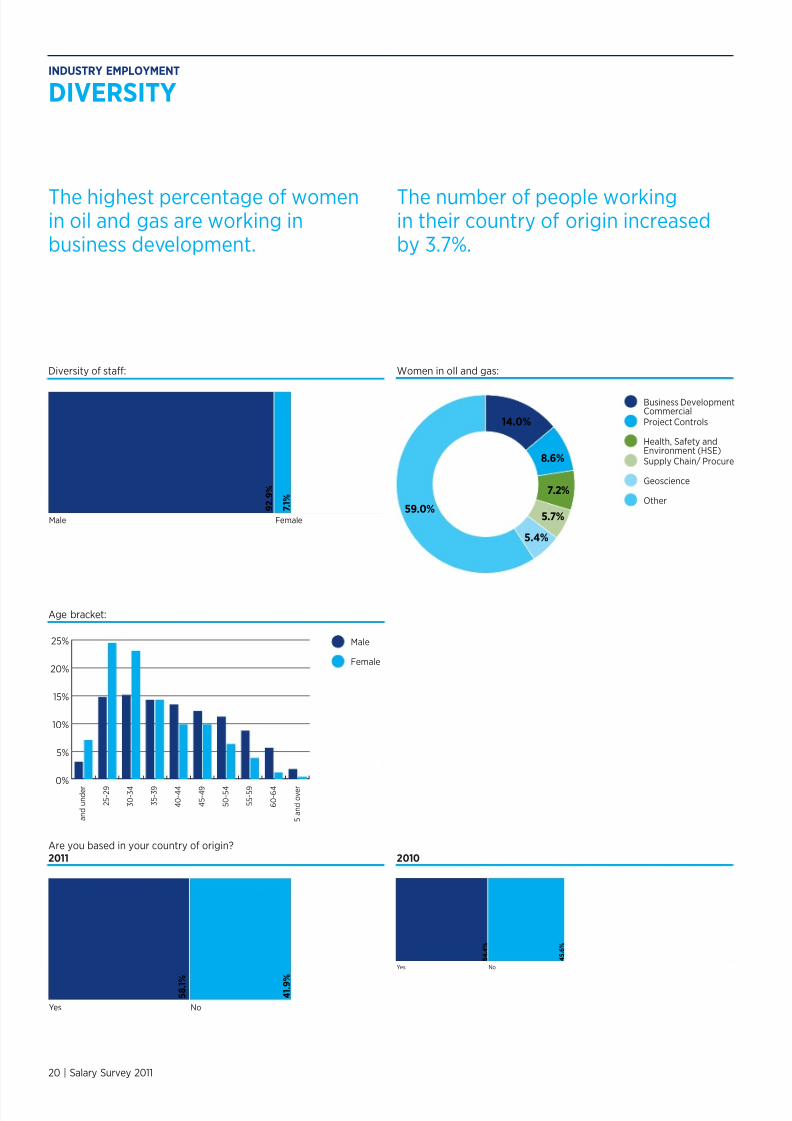
DIVERSITYGenderThe industry is still heavily dominated by male employees, and theseigures are consistent with our own experience o emaleparticipation within the industry. Clearly the trend line on thispercentage will make or interesting reading in uture years withmore women encouraged to enter the industry.
Age bracketWhilst most o the demographics provided by the survey are whatyou would expect, we know rom other industries that the numbero under 25’s in the industry is comparatively low. Whether thismerely relects a higher need or tertiary qualiications in theindustry or actually reveals an underinvestment in people being
brought into the industry is open or debate. Again we will monitorthis igure closely in coming years.
Based in country of originThere is an increase in locally based employees with 58.1% workingin their country o origin versus 54.4% or last year. These iguresreinorce the trend through 2009 and early 2010 that saw many inthe industry return to their home country. This tide o repatriationwas driven by a great number o experienced sta and contractorsbeing laid o through the downturn. Many o these returned hometo seek work, and did so successully as the market reboundedthrough 2010.
Analysing the igures urther we also ound some evidence o anabove average level o early retirements particularly within thosecontractors on higher day rates rom high paying countries.
MOVEMENT OF WORKFORCEThe trend or repatriation through 2009/10 aected all o theigures. This is highlighted with the sharp decreases in oreignimports in Asia, Arica and Europe. Only Australasia and the MiddleEast showed an increase in oreign imports, relecting the tworegions’ quick recovery rom the downturn.
YEARS OF EXPERIENCEConsistent with the previous year’s downturn there is a sharp all innew comers to the industry reducing those with less than our yearsexperience to just under 20% o the workorce.
Whilst demand or those with less experience was weak we did seeemployers take advantage o an experience rich market and a waveo job moves lowed through the industry as the market improved.This was relected in the numbers in their current role or one yearor less, with the total climbing sharply rom last year’s 16.8% to thisyear’s igure o 24.7%. In general there was an equally sharp drop
or those in their current role or more than 10 years, againindicating the layo o experienced highly paid individuals thatoccurred whilst the recession was at its depth, and the act thatmany o them never returned to the workorce.
Clearly worldwide demand or oil and gas is not on the wane, and inthe longer term such periods o neglect in bringing new talent intothe industry will surely hamper growth. With the availability o skillsdropping, those already in the industry will undoubtedly be the onesto beneit with rising salaries and day rates.
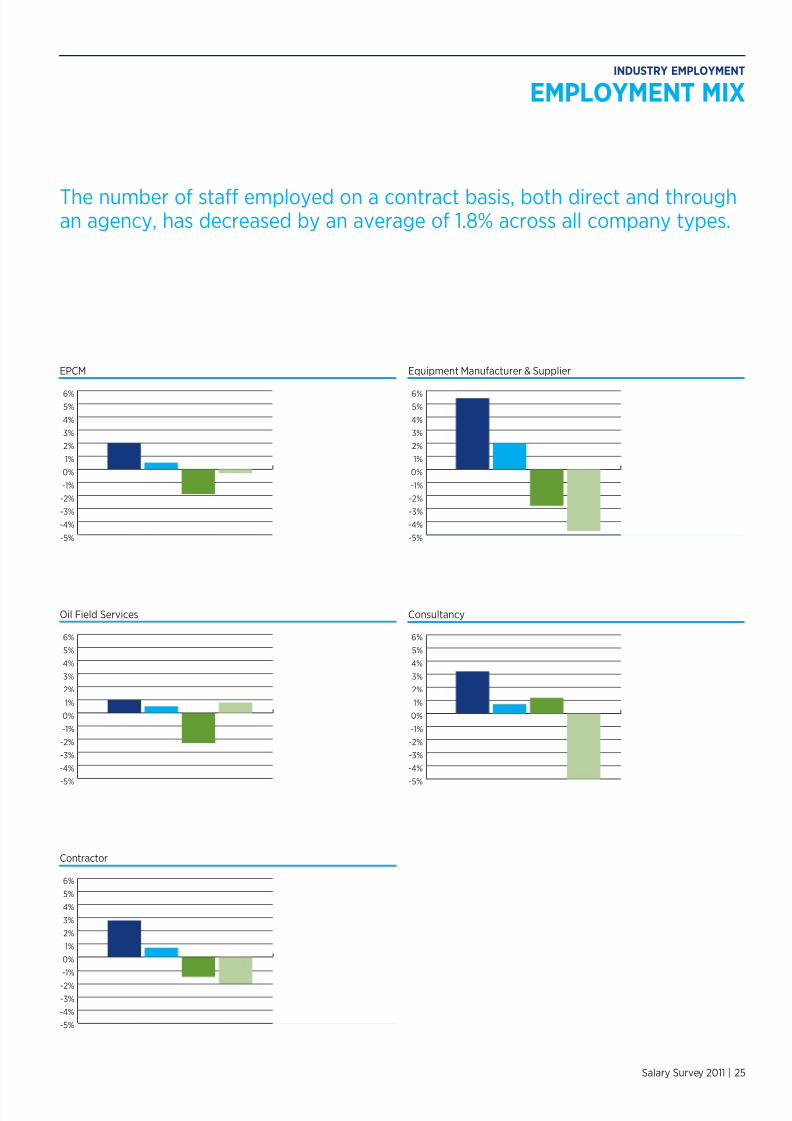
EMPLOYMENT MIX BY COMPANY TYPEThere are some consistent trends in employment through the industrywhen reviewing employment mix. These are namely an increase in thepercentage o those employed on a permanent basis, and acorresponding decrease in the use o contractors. With contractor dayrates running at nearly double that o permanent sta salaries (on a‘cash or cash’ basis and assuming a ull 240 days a year worked) it isnot diicult to understand why employers sought to take advantage osuch a candidate rich market through 2009 and 2010. The drop inusing contractors covers all company types. Interestingly most o thisdrop is or those contracted through agencies however Oil FieldServices companies buck this trend with an increase in agency use butsharp decreases in direct contractors.
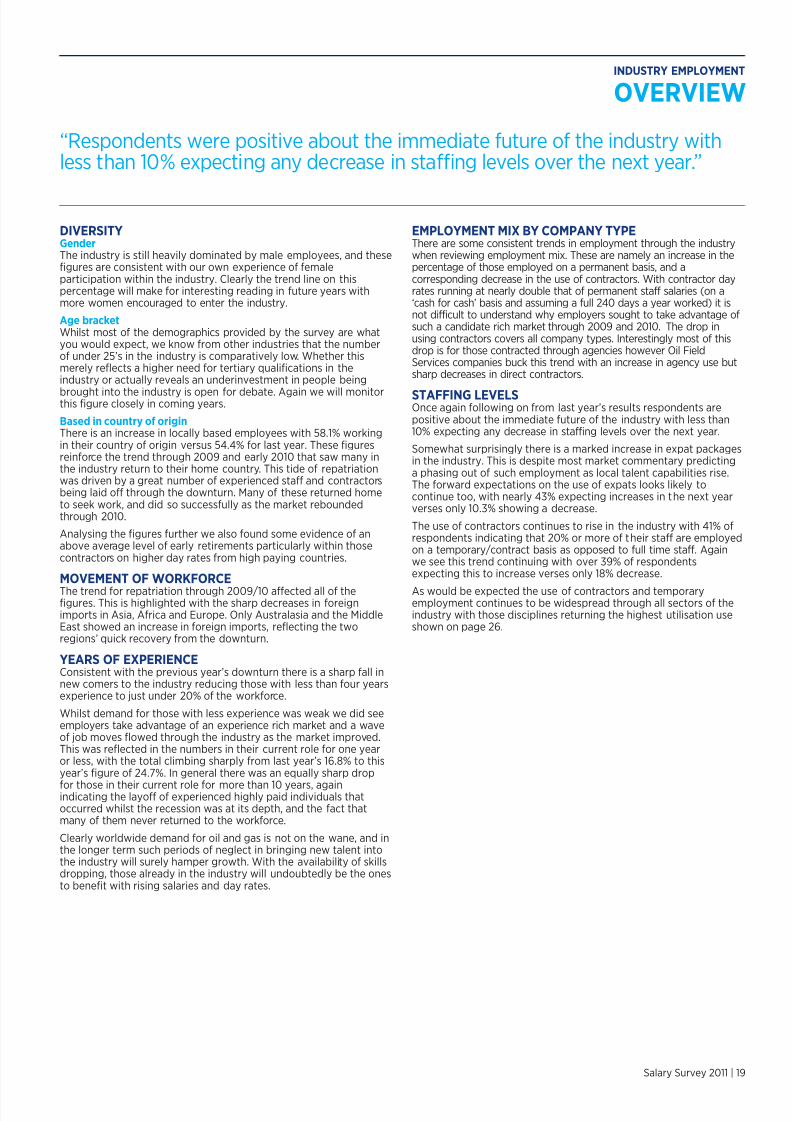
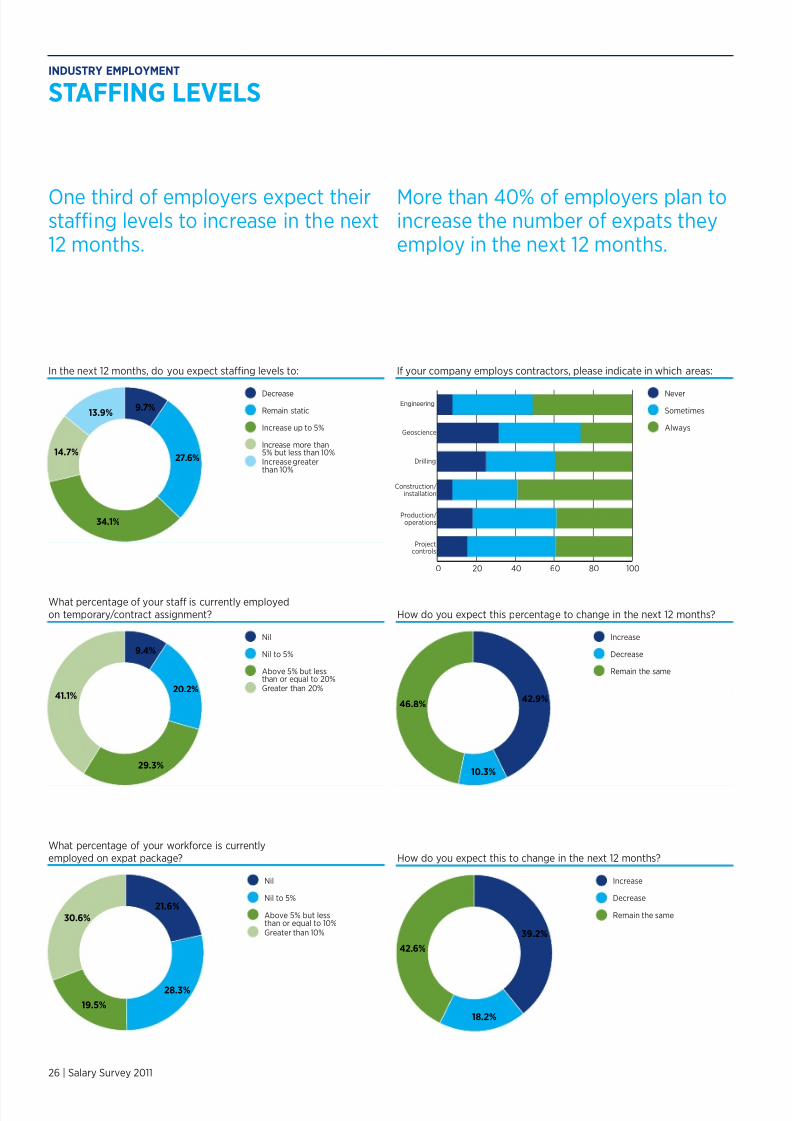
STAFFING LEVELSOnce again ollowing on rom last year’s results respondents arepositive about the immediate uture o the industry with less than10% expecting any decrease in staing levels over the next year.
Somewhat surprisingly there is a marked increase in expat packagesin the industry. This is despite most market commentary predictinga phasing out o such employment as local talent capabilities rise.The orward expectations on the use o expats looks likely tocontinue too, with nearly 43% expecting increases in the next yearverses only 10.3% showing a decrease.
The use o contractors continues to rise in the industry with 41% orespondents indicating that 20% or more o their sta are employedon a temporary/contract basis as opposed to ull time sta. Againwe see this trend continuing with over 39% o respondentsexpecting this to increase verses only 18% decrease.
As would be expected the use o contractors and temporaryemployment continues to be widespread through all sectors o theindustry with those disciplines returning the highest utilisation useshown on page 26.
OVERVIEW
“Respondents were positive about the immediate uture o the industry withless than 10% expecting any decrease in sta ng levels over the next year.”
INDUSTRY EMPLOYMENT
8/3/2019 Ong Salary
http://slidepdf.com/reader/full/ong-salary 20/32
20 | Salary Survey 2011
The highest percentage o womenin oil and gas are working inbusiness development.
The number o people workingin their country o origin increasedby 3.7%.
DIVERSITYINDUSTRY EMPLOYMENT
9 2 . 9 %
7 . 1 %
Male Female
5 8 . 1 %
4 1 . 9 %
Yes No
5 4 . 4 %
4 5 . 6 %
Yes No
Business DevelopmentCommercialProject Controls
Health, Saety andEnvironment (HSE)Supply Chain/ Procure
Geoscience
Other
14.0%
8.6%
7.2%
5.7%
5.4%
59.0%
Diversity o sta:
Are you based in your country o origin?2011 2010
Women in oIl and gas:
Age bracket:
0%
5%
10%
15%
20%
25% Male
Female
a n d u n d e r
2 5 - 2 9
3 0 - 3 4
3 5 - 3 9
4 0 - 4 4
4 5 - 4 9
5 5 - 5 9
5 0 - 5 4
5 a n d o v e r
6 0 - 6 4
8/3/2019 Ong Salary
http://slidepdf.com/reader/full/ong-salary 21/32
Salary Survey 2011 | 21
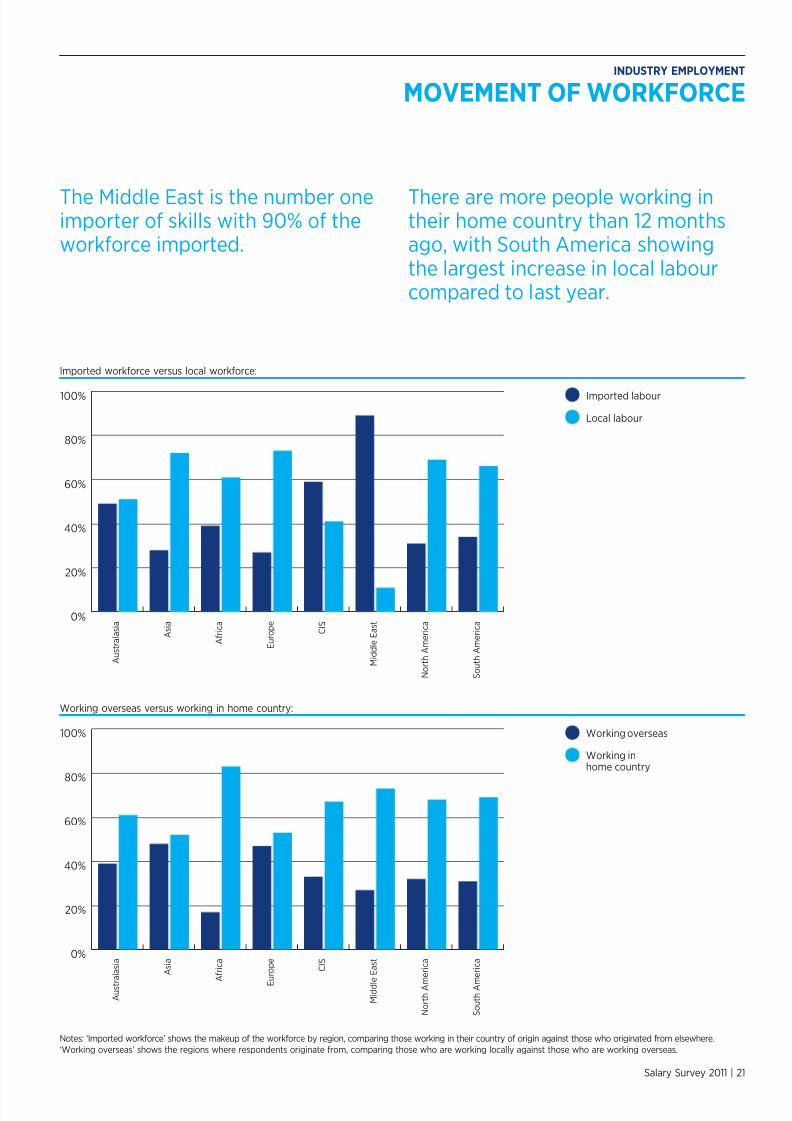
The Middle East is the number oneimporter o skills with 90% o theworkorce imported.
There are more people working intheir home country than 12 monthsago, with South America showingthe largest increase in local labourcompared to last year.
MOVEMENT OF WORKFORCEINDUSTRY EMPLOYMENT
Imported workorce versus local workorce:
Working overseas versus working in home country:
A u s t r a l a s i a
A s i a
A f r i c a
E u r o p e
M i d d l e E a s t
N o r t h A m e r i c a
S o u t h A m e r i c a C
I S
Imported labour
Local labour
0%
20%
40%
60%
80%
100%
A u s t r a l a s i a
A s i a
A f r i c a
E u r o p e
M i d d l e E a s t
N o r t h A m
e r i c a
S o u t h A m
e r i c a C
I S0%
20%
40%
60%
80%
100% Working overseas
Working inhome country
Notes: ‘Imported workorce’ shows the makeup o the workorce by region, comparing those working in their country o origin against those who originated rom elsewhere.
‘Working overseas’ shows the regions where respondents originate rom, comparing those who are working locally against those who are working overseas.
8/3/2019 Ong Salary
http://slidepdf.com/reader/full/ong-salary 22/32
22 | Salary Survey 2011
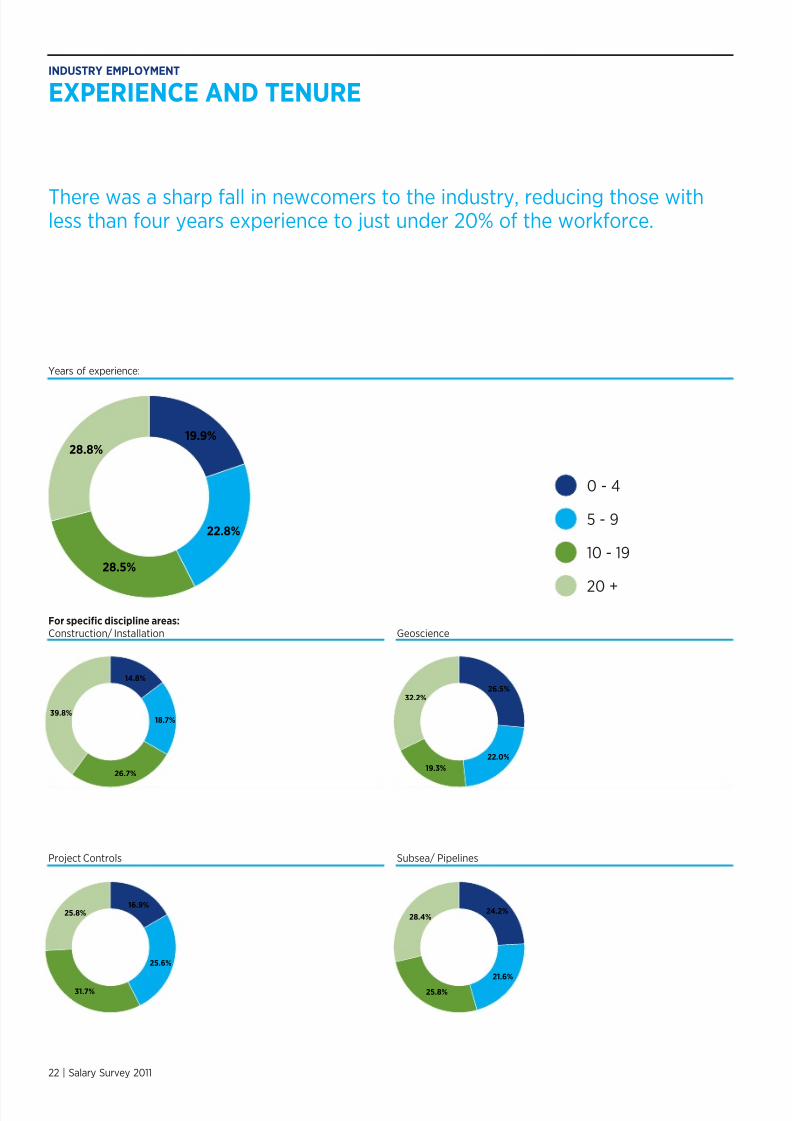
There was a sharp all in newcomers to the industry, reducing those withless than our years experience to just under 20% o the workorce.
EXPERIENCE AND TENUREINDUSTRY EMPLOYMENT
0 - 4
5 - 9
10 - 19
20 +
19.9%
28.5%
22.8%
28.8%
14.8%
18.7%
26.7%
39.8%
16.9%
25.6%
31.7%
25.8%
26.5%
22.0%
19.3%
32.2%
24.2%
21.6%
25.8%
28.4%
Years o experience:
For specific discipline areas:Construction/ Installation
Project Controls
Geoscience
Subsea/ Pipelines
8/3/2019 Ong Salary
http://slidepdf.com/reader/full/ong-salary 23/32
Salary Survey 2011 | 23
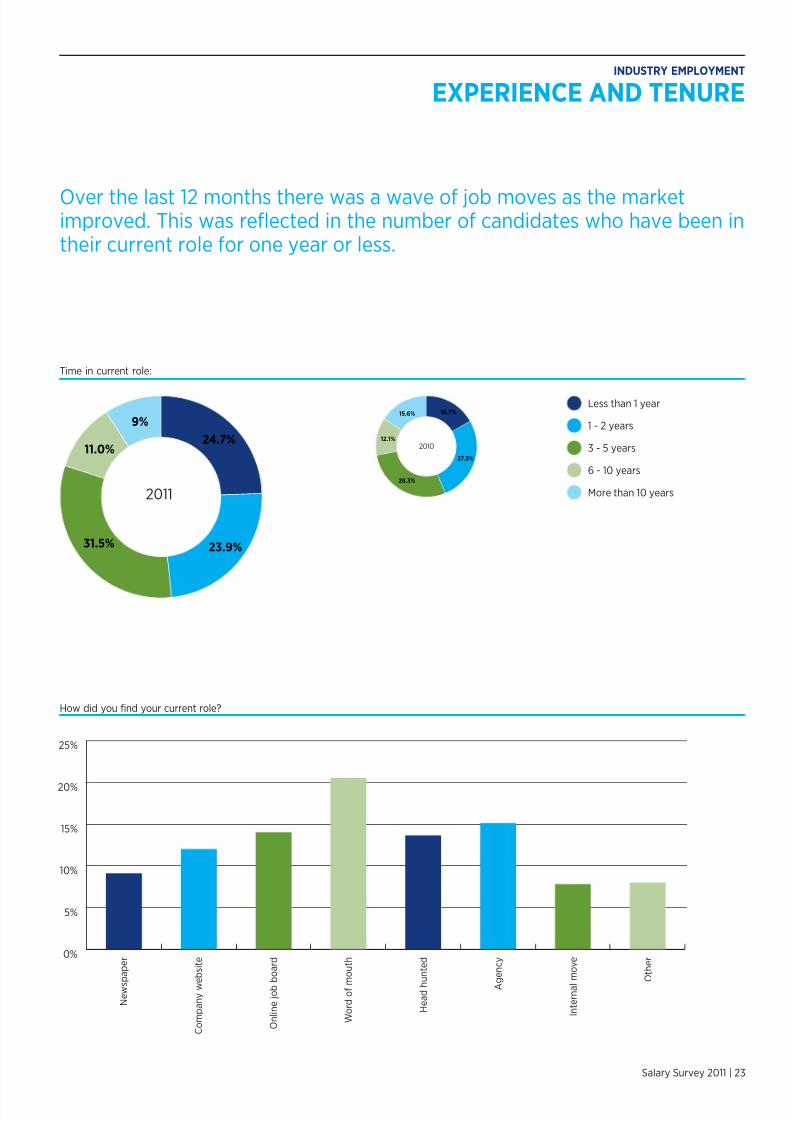
Over the last 12 months there was a wave o job moves as the marketimproved. This was reflected in the number o candidates who have been intheir current role or one year or less.
INDUSTRY EMPLOYMENT
EXPERIENCE AND TENURE
How did you ind your current role?
Less than 1 year
1 - 2 years
3 - 5 years
6 - 10 years
More than 10 years
23.9%
24.7%11.0%
31.5%
9%
27.3%
16.7%
12.1%
28.3%
15.6%
2010
2011
N e w s p
a p e r
C o m p a n y w e
b s i t e
O n l i n e j o b b
o a r d
W o r d o f m
o u t h
A g
e n c y
I n t e r n a l m o v e
O t h e r
H e a d h u n t e d
0%
5%
10%
15%
20%
25%
Time in current role:
8/3/2019 Ong Salary
http://slidepdf.com/reader/full/ong-salary 24/32
24 | Salary Survey 2011
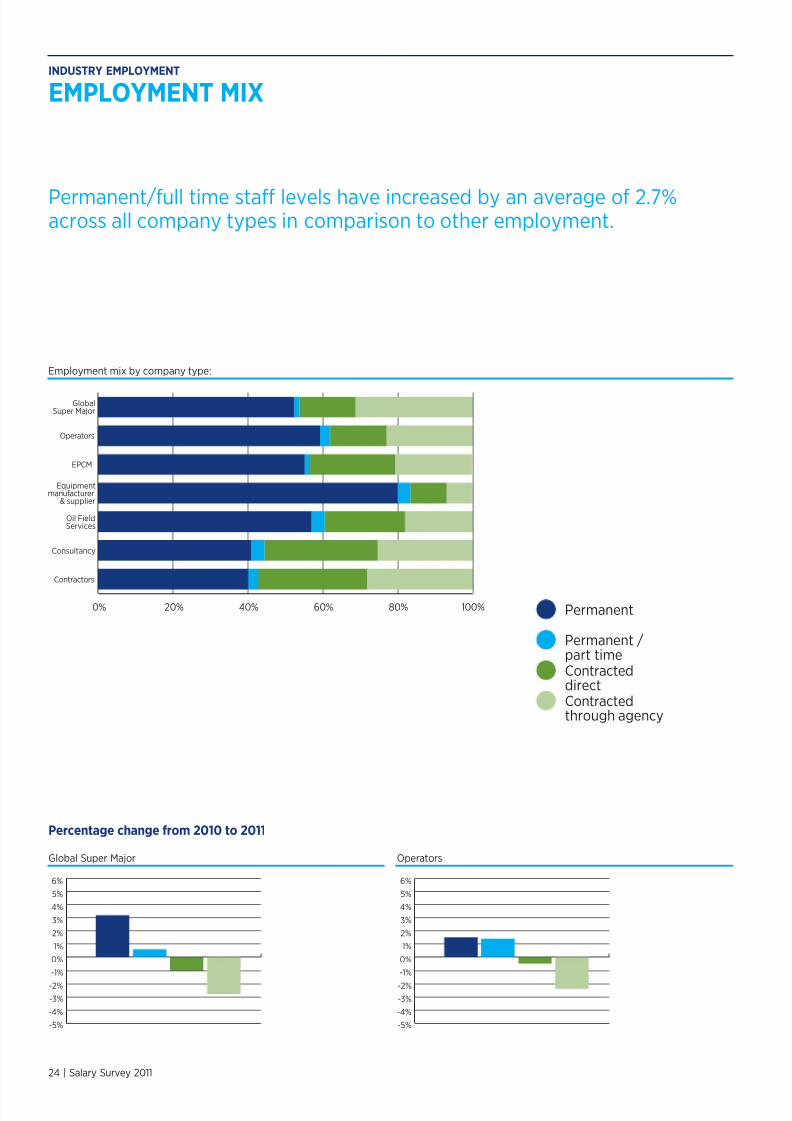
Permanent/ull time staf levels have increased by an average o 2.7%across all company types in comparison to other employment.
EMPLOYMENT MIXINDUSTRY EMPLOYMENT
Global Super Major Operators
-5%
-4%
-3%
-2%
-1%
0%
1%
2%
3%
4%
5%
6%
-5%
-4%
-3%
-2%
-1%
0%
1%
2%
3%
4%
5%
6%
GlobalSuper Major
Operators
EPCM
Equipmentmanuacturer
& supplier
Oil FieldServices
Consultancy
Contractors
Permanent
Permanent /part timeContracteddirectContractedthrough agency
0% 20% 40% 60% 80% 100%
Employment mix by company type:
Percentage change from 2010 to 2011
8/3/2019 Ong Salary
http://slidepdf.com/reader/full/ong-salary 25/32
8/3/2019 Ong Salary
http://slidepdf.com/reader/full/ong-salary 26/32
26 | Salary Survey 2011
More than 40% o employers plan toincrease the number o expats theyemploy in the next 12 months.
One third o employers expect theirsta ng levels to increase in the next12 months.
STAFFING LEVELSINDUSTRY EMPLOYMENT
I your company employs contractors, please indicate in which areas:
What percentage o your workorce is currentlyemployed on expat package? How do you expect this to change in the next 12 months?
Decrease
Remain static
Increase up to 5%
Increase more than5% but less than 10%Increase greaterthan 10%
9.7%
27.6%
34.1%
14.7%
13.9%
Nil
Nil to 5%
Above 5% but lessthan or equal to 20%Greater than 20%
9.4%
20.2%
29.3%
41.1%
Increase
Decrease
Remain the same
42.9%
10.3%
46.8%
Nil
Nil to 5%
Above 5% but lessthan or equal to 10%Greater than 10%
21.6%
28.3%
19.5%
30.6%
Increase
Decrease
Remain the same
39.2%
18.2%
42.6%
0 20 40 60 80 100
Never
Sometimes
Always
Engineering
Geoscience
Drilling
Construction/installation
Production/operations
Projectcontrols
In the next 12 months, do you expect staing levels to:
What percentage o your sta is currently employedon temporary/contract assignment? How do you expect this percentage to change in the next 12 months?
8/3/2019 Ong Salary
http://slidepdf.com/reader/full/ong-salary 27/32
Oil & Gas Salary Guide 2011 | 27
SECTION FOUR
ECONOMIC OUTLOOK
More than hal o respondents describe
their outlook in the current employmentmarket as positive.
8/3/2019 Ong Salary
http://slidepdf.com/reader/full/ong-salary 28/32
28 | Salary Survey 2011
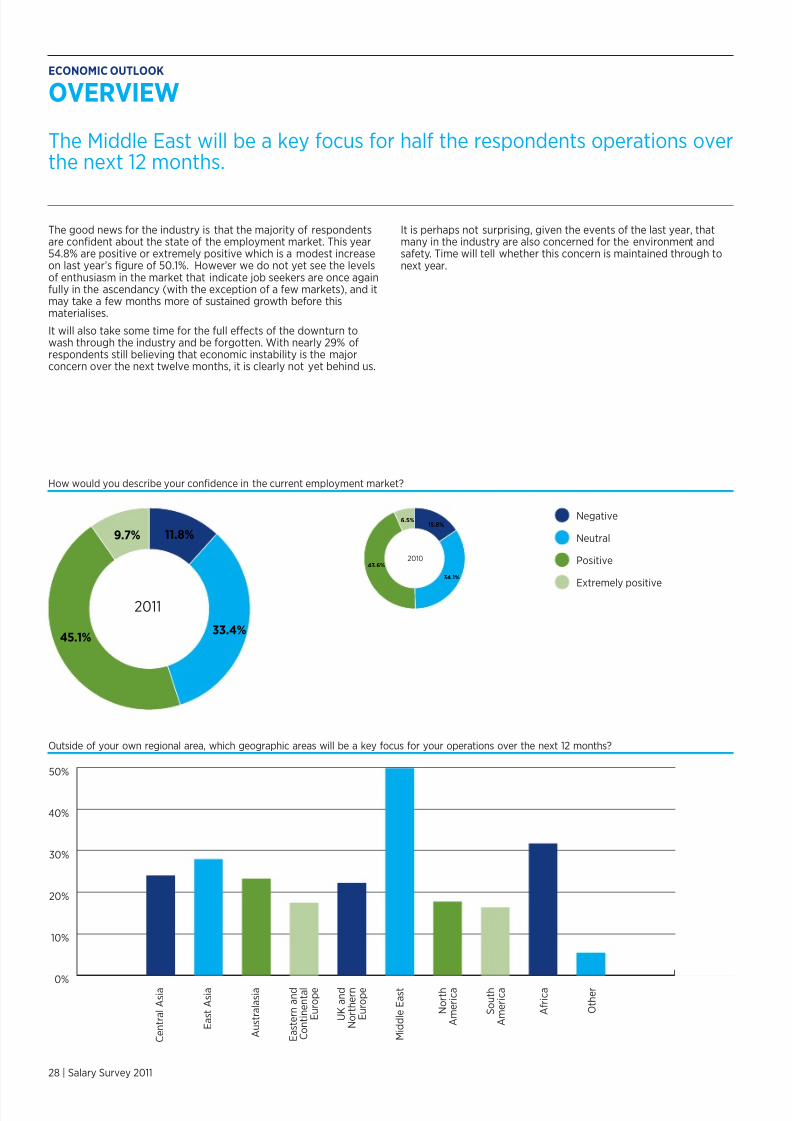
The Middle East will be a key ocus or hal the respondents operations overthe next 12 months.
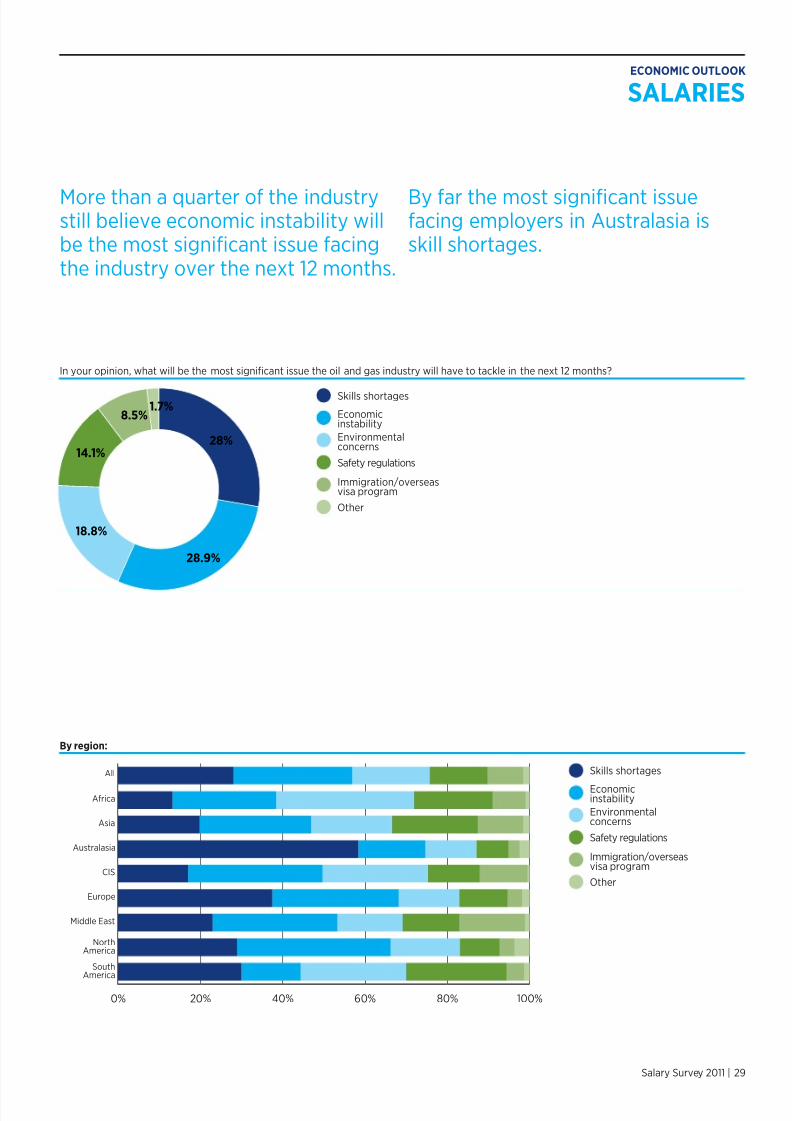
OVERVIEW
The good news or the industry is that the majority o respondentsare conident about the state o the employment market. This year54.8% are positive or extremely positive which is a modest increaseon last year’s igure o 50.1%. However we do not yet see the levelso enthusiasm in the market that indicate job seekers are once againully in the ascendancy (with the exception o a ew markets), and itmay take a ew months more o sustained growth beore thismaterialises.
It will also take some time or the ull eects o the downturn towash through the industry and be orgotten. With nearly 29% orespondents still believing that economic instability is the majorconcern over the next twelve months, it is clearly not yet behind us.
It is perhaps not surprising, given the events o the last year, thatmany in the industry are also concerned or the environment andsaety. Time will tell whether this concern is maintained through tonext year.
ECONOMIC OUTLOOK
Outside o your own regional area, which geographic areas will be a key ocus or your operations over the next 12 months?
C e n t r a l A s i a
E a s t A s i a
A u s t r a l a s i a
E a s t e r n a n d
C o n t i n e n t a l
E u r o p e
U K a n d
N o r t h e r n
E u r o p e
M i d d l e E a s t
S o u t h
A m e r i c a
N o r t h
A m e r i c a
O t h e r
A f r i c a0%
10%
20%
30%
40%
50%
Negative
Neutral
Positive
Extremely positive
11.8%
33.4%45.1%
9.7%15.8%
34.1%
43.6%
6.5%
2010
2011
How would you describe your conidence in the current employment market?
8/3/2019 Ong Salary
http://slidepdf.com/reader/full/ong-salary 29/32
8/3/2019 Ong Salary
http://slidepdf.com/reader/full/ong-salary 30/32
30 | Oil & Gas Salary Guide 2011
ABOUT OIL AND GAS JOB SEARCH
Oil and Gas Job Search is the premier global oil and gas industry job site.We are a one stop solution or your job search and recruitment needs.
When it comes to locating the best oil and gas jobs and the bestcandidates in the worldwide oil and gas industry, Oil and Gas Job Search isthe most efective online solution available.
Oil and Gas Job Search launched in 2000 and is now firmly established asthe world’s leading online resource or the oil and gas industry.
The site currently logs over 300,000 visitors every month. Our candidatedatabase eatures more than 320,000 resumes and is growing at the rateo over 10,000 per month.
320,000+ resumes o proessional candidates on our database
10,000+ additional candidates every month
9,000+ jobs posted on the website every month
1,000+ clients located in all major oil and gas locations
10+ years in business
www. oilandgasjobsearch.com
8/3/2019 Ong Salary
http://slidepdf.com/reader/full/ong-salary 31/32
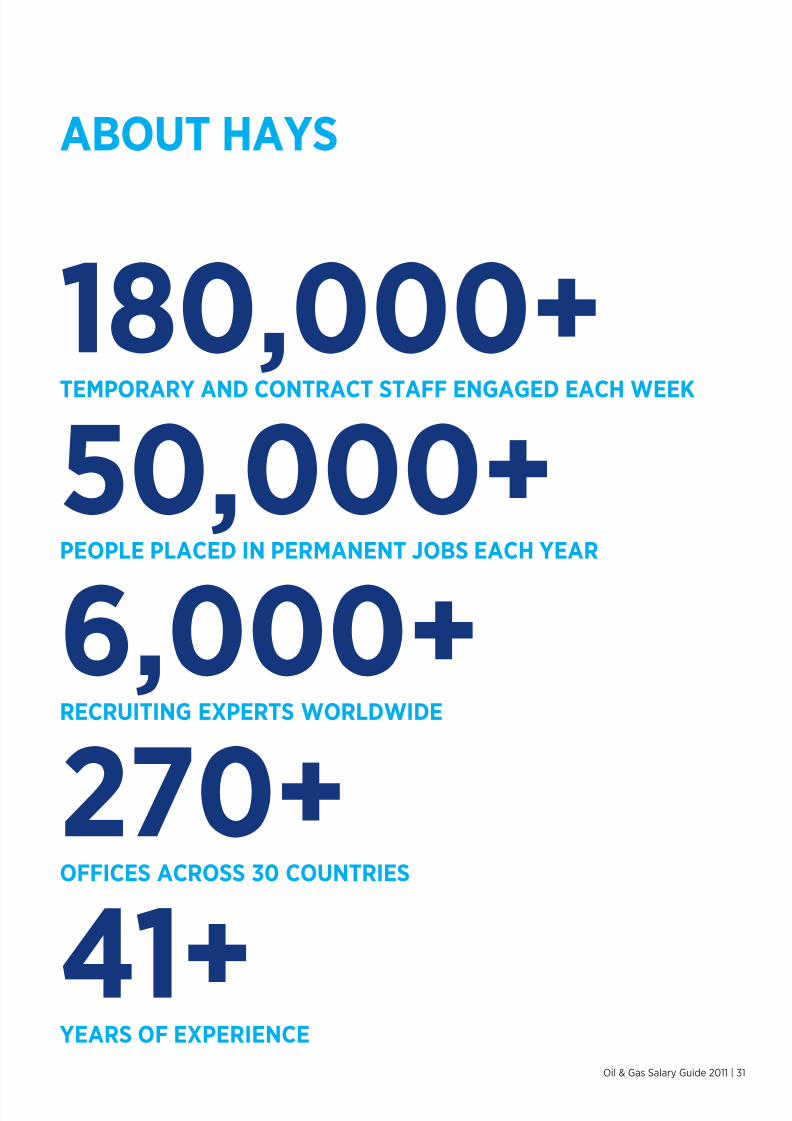
180,000+TEMPORARY AND CONTRACT STAFF ENGAGED EACH WEEK
50,000+PEOPLE PLACED IN PERMANENT JOBS EACH YEAR
6,000+RECRUITING EXPERTS WORLDWIDE
270+OFFICES ACROSS 30 COUNTRIES
41+YEARS OF EXPERIENCE
Oil & Gas Salary Guide 2011 | 31
ABOUT HAYS
8/3/2019 Ong Salary
http://slidepdf.com/reader/full/ong-salary 32/32