snam 2015 3q results
TRANSCRIPT
snam.it
Milan, October 28th , 20152015 3Q Results
2
Highlights and Operational Performance
2015 3Q Consolidated Results
Outline
3
Highlights and operational performance
Carlo MalacarneChief Executive Officer
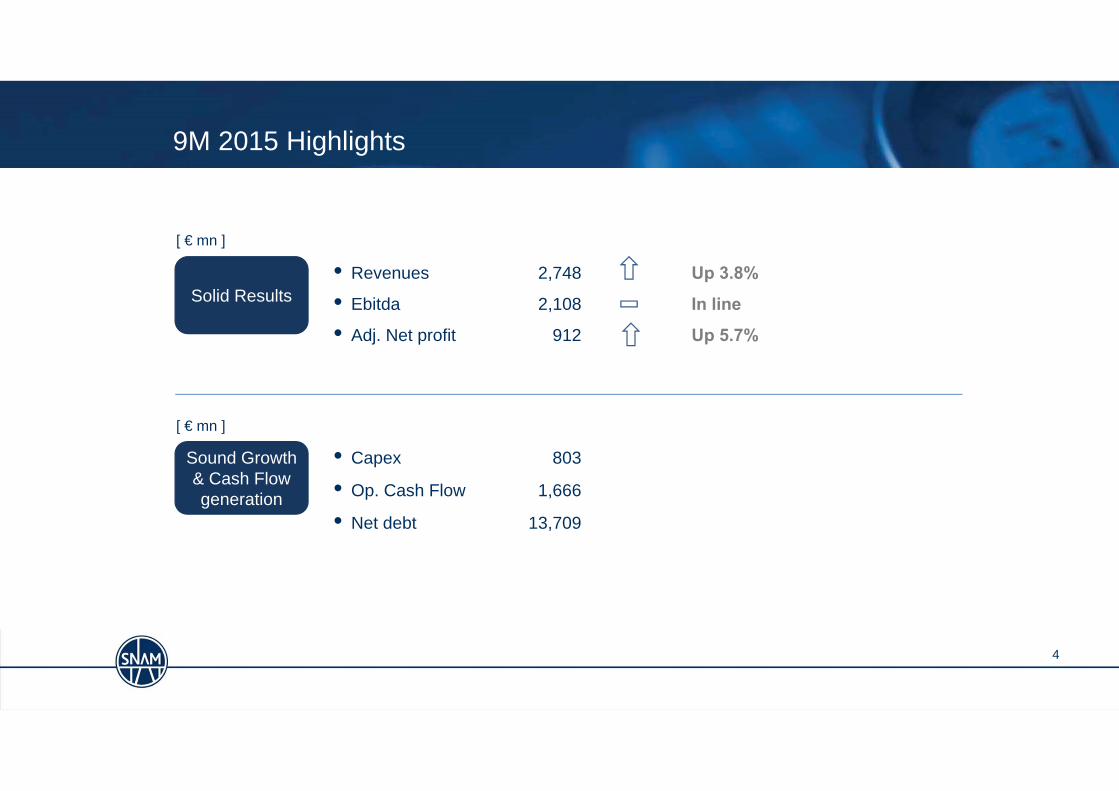
• Revenues 2,748 Up 3.8%
• Ebitda 2,108 In line
• Adj. Net profit 912 Up 5.7%
[ € mn ]
Solid Results
Sound Growth& Cash Flow generation
• Capex 803
• Op. Cash Flow 1,666
• Net debt 13,709
9M 2015 Highlights
[ € mn ]
4
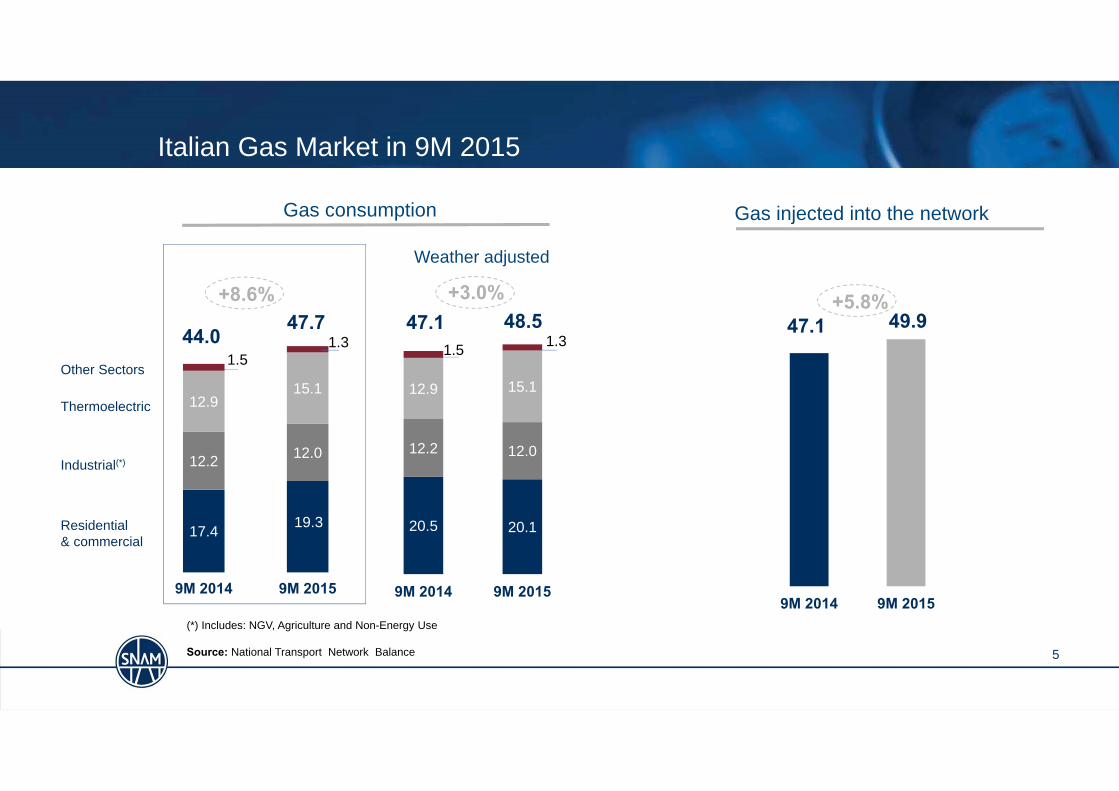
20.5 20.1
12.2 12.0
12.9 15.1
1.5 1.3
9M 2014 9M 2015
17.4 19.3
12.2 12.0
12.915.1
1.51.3
9M 2014 9M 2015
5
Residential& commercial
Industrial(*)
Thermoelectric
Other Sectors
Gas consumption
+3.0%48.547.1
Gas injected into the network
(*) Includes: NGV, Agriculture and Non-Energy Use
Source: National Transport Network Balance
Italian Gas Market in 9M 2015
Weather adjusted
+8.6%47.7
44.0
9M 2014 9M 2015
+5.8%49.947.1
6
Antonio PacciorettiChief Financial Officer
2015 3Q Consolidated Results
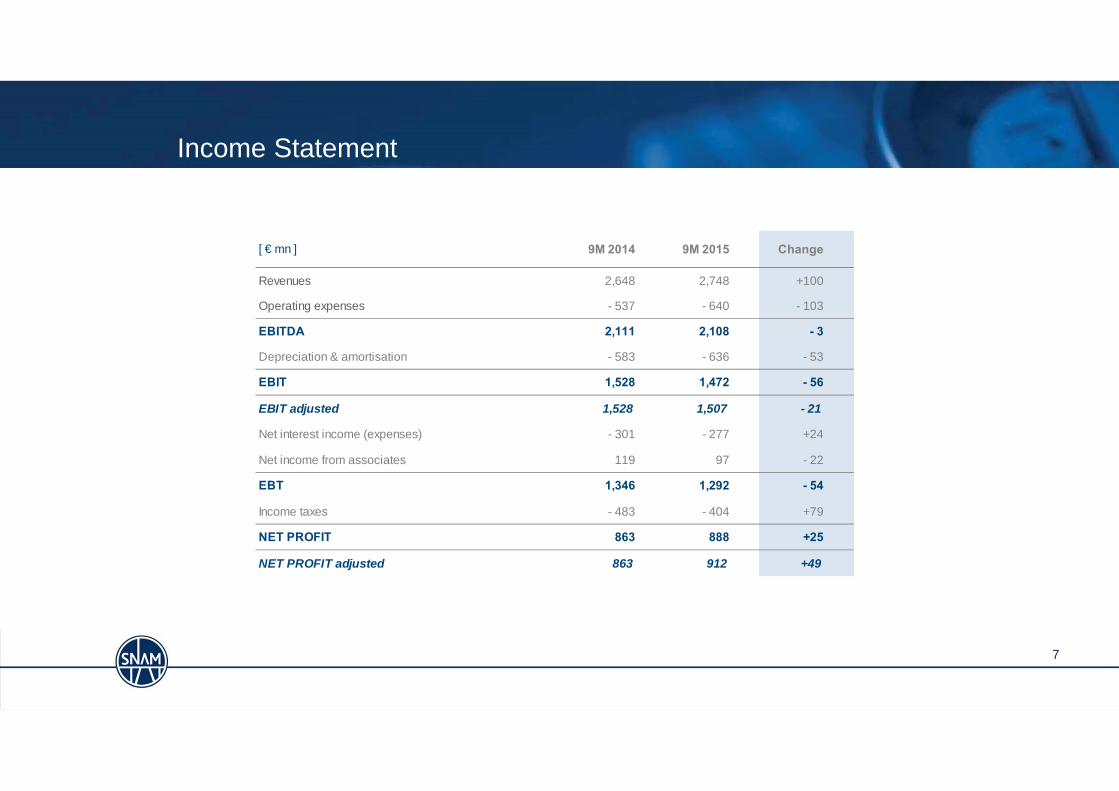
Income Statement
7
[ € mn ] 9M 2014 9M 2015 Change
Revenues 2,648 2,748 +100
Operating expenses - 537 - 640 - 103
EBITDA 2,111 2,108 - 3
Depreciation & amortisation - 583 - 636 - 53
EBIT 1,528 1,472 - 56
EBIT adjusted 1,528 1,507 - 21
Net interest income (expenses) - 301 - 277 +24
Net income from associates 119 97 - 22
EBT 1,346 1,292 - 54
Income taxes - 483 - 404 +79
NET PROFIT 863 888 +25
NET PROFIT adjusted 863 912 +49
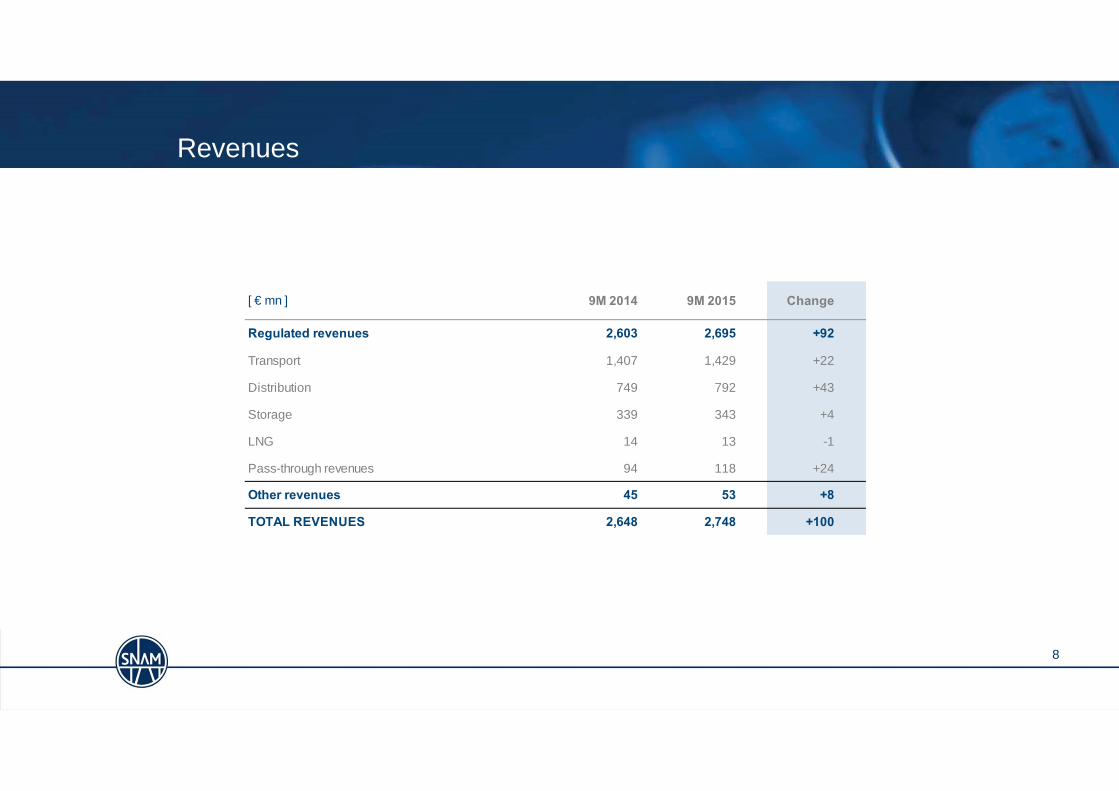
Revenues
8
[ € mn ] 9M 2014 9M 2015 Change
Regulated revenues 2,603 2,695 +92
Transport 1,407 1,429 +22
Distribution 749 792 +43
Storage 339 343 +4
LNG 14 13 -1
Pass-through revenues 94 118 +24
Other revenues 45 53 +8
TOTAL REVENUES 2,648 2,748 +100
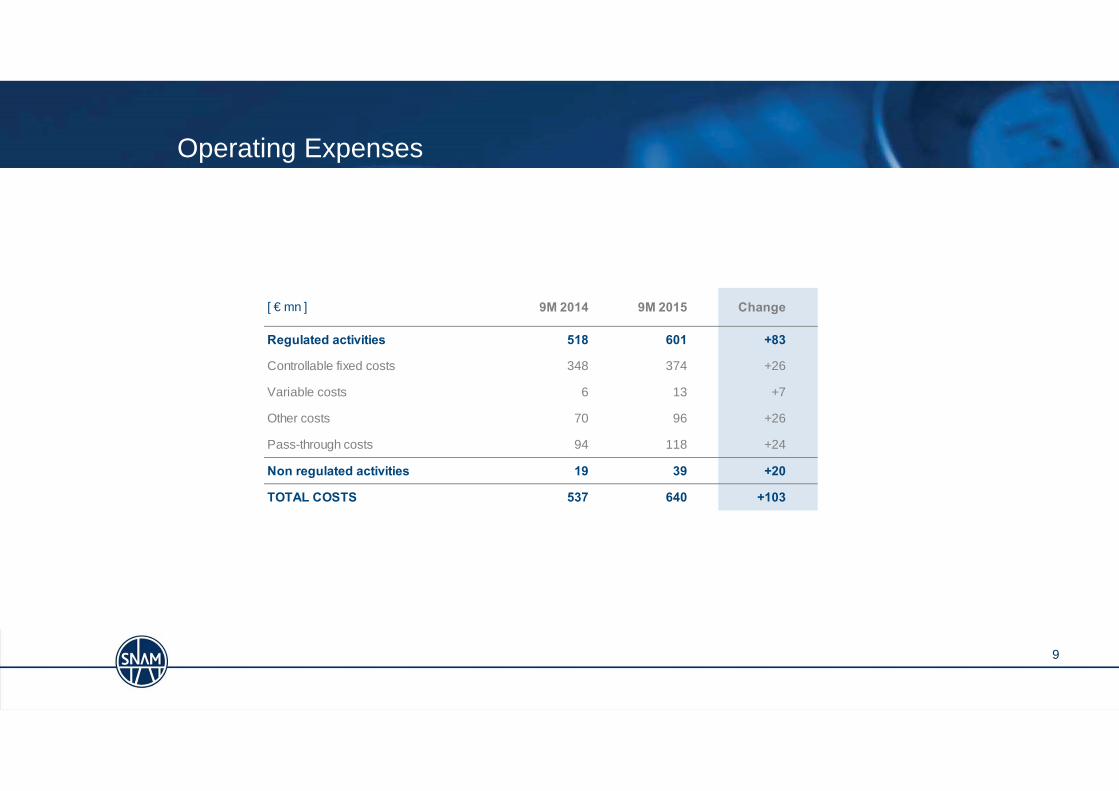
Operating Expenses
9
[ € mn ] 9M 2014 9M 2015 Change
Regulated activities 518 601 +83
Controllable fixed costs 348 374 +26
Variable costs 6 13 +7
Other costs 70 96 +26
Pass-through costs 94 118 +24
Non regulated activities 19 39 +20
TOTAL COSTS 537 640 +103
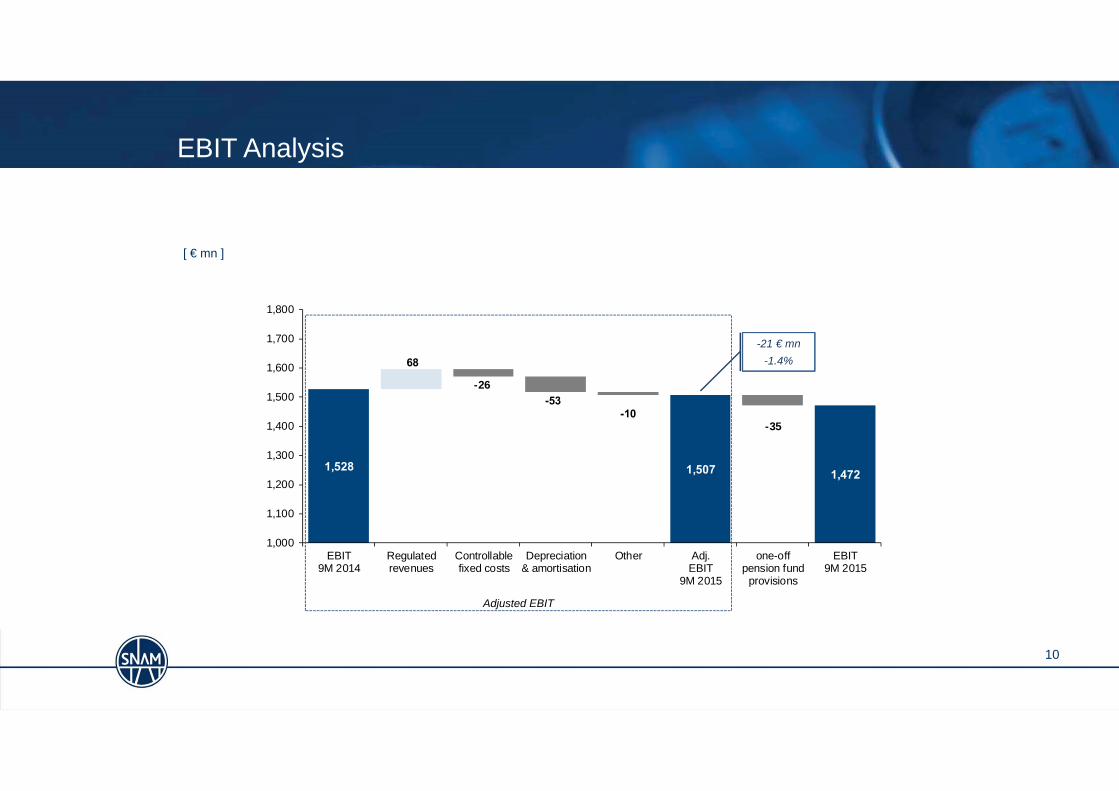
1,528 1,507 1,472
68
-26-53
-10-35
1,000
1,100
1,200
1,300
1,400
1,500
1,600
1,700
1,800
EBIT9M 2014
Regulatedrevenues
Controllablefixed costs
Depreciation& amortisation
Other Adj.EBIT
9M 2015
one-offpension fund
provisions
EBIT9M 2015
10
EBIT Analysis
[ € mn ]
-21 € mn-1.4%
Adjusted EBIT
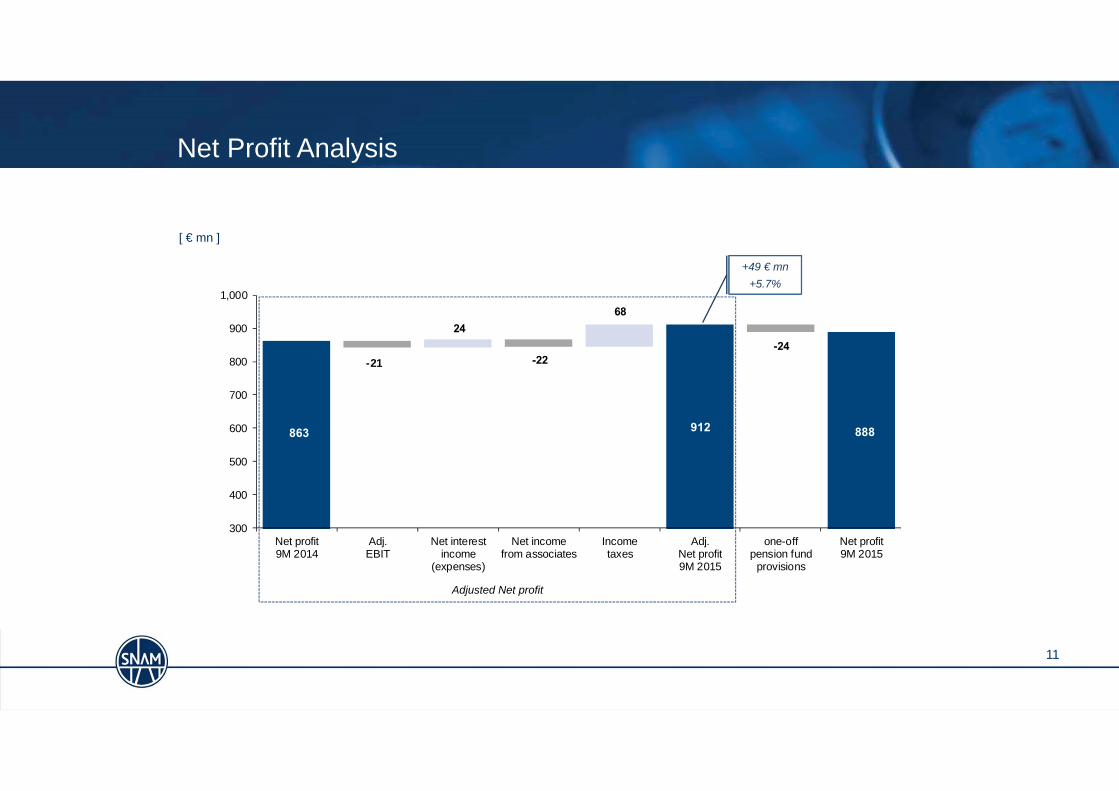
863 912 888
2468
-21 -22-24
300
400
500
600
700
800
900
1,000
Net profit9M 2014
Adj.EBIT
Net interestincome
(expenses)
Net incomefrom associates
Incometaxes
Adj.Net profit9M 2015
one-offpension fund
provisions
Net profit9M 2015
11
Net Profit Analysis
+49 € mn+5.7%
[ € mn ]
Adjusted Net profit
888
.0 .0
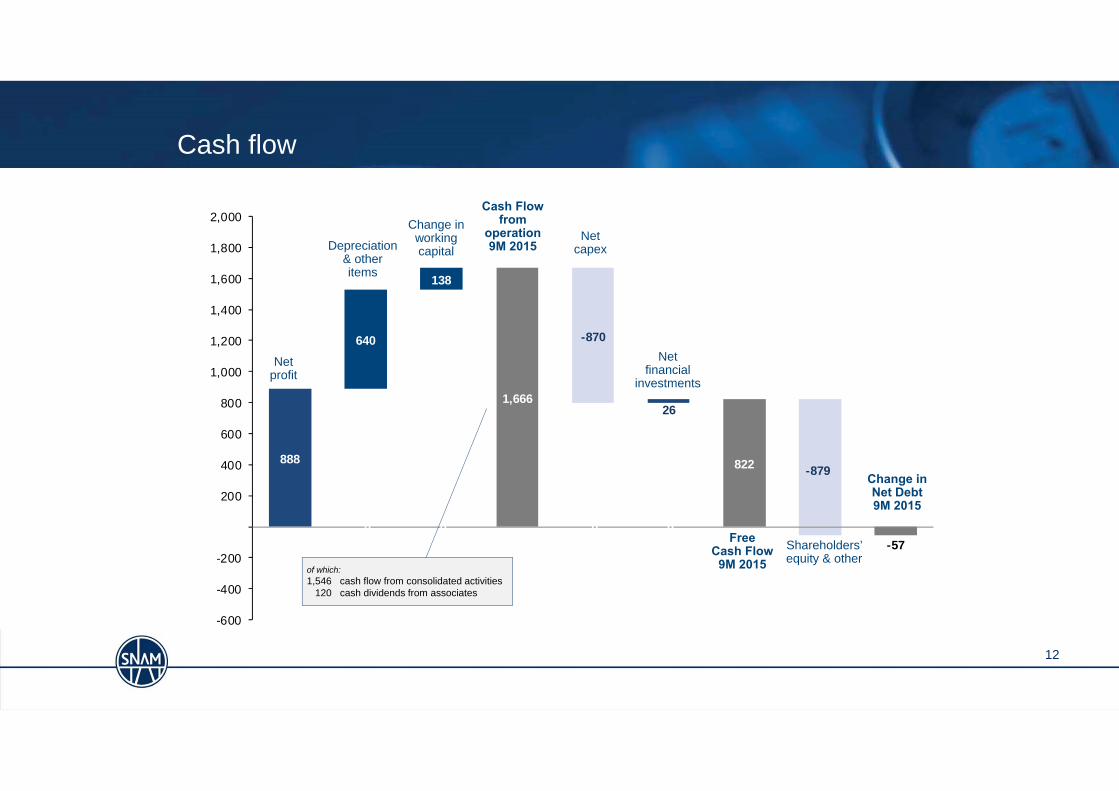
1,666
.0 .0
822
-57
640
138
26
-870
-879
-600
-400
-200
200
400
600
800
1,000
1,200
1,400
1,600
1,800
2,000
12
Cash flow
FreeCash Flow
9M 2015
Netprofit
Depreciation& otheritems
Change inworkingcapital
Cash Flowfrom
operation9M 2015
Netcapex
Shareholders’ equity & other
Change inNet Debt9M 2015
of which: 1,546 cash flow from consolidated activities
120 cash dividends from associates
Netfinancial
investments
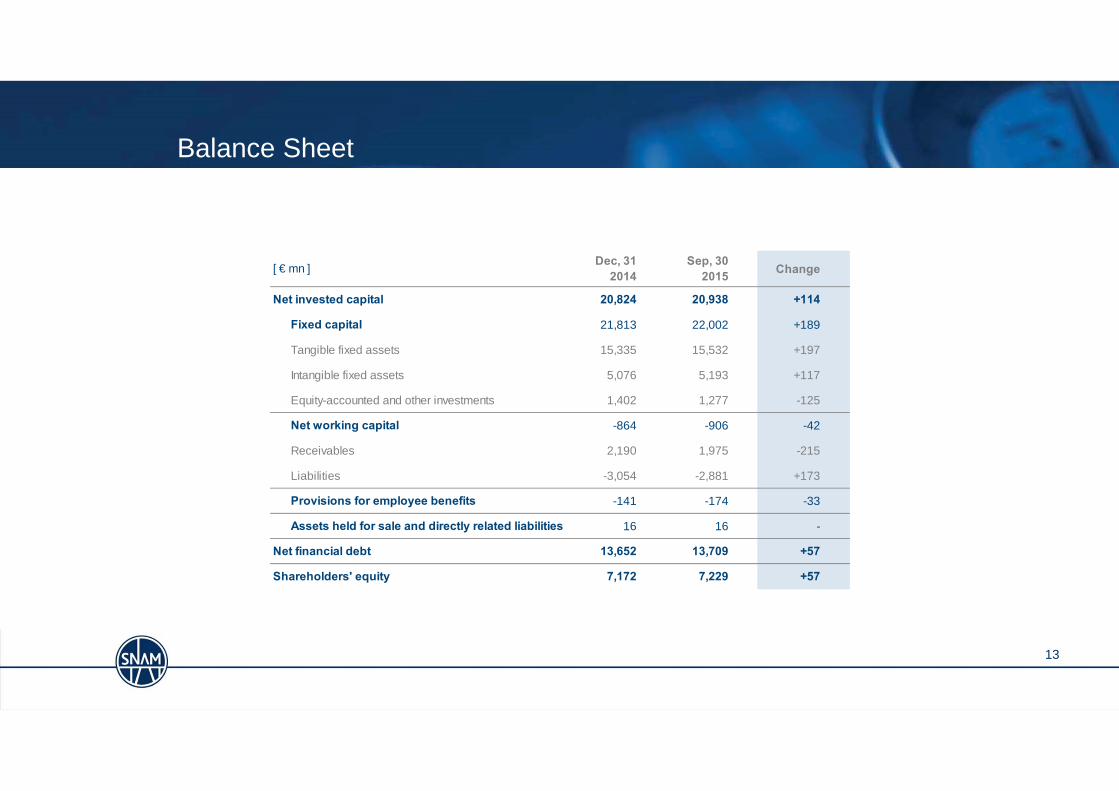
Balance Sheet
13
[ € mn ] Dec, 31 2014
Sep, 30 2015 Change
Net invested capital 20,824 20,938 +114
Fixed capital 21,813 22,002 +189
Tangible fixed assets 15,335 15,532 +197
Intangible fixed assets 5,076 5,193 +117
Equity-accounted and other investments 1,402 1,277 -125
Net working capital -864 -906 -42
Receivables 2,190 1,975 -215
Liabilities -3,054 -2,881 +173
Provisions for employee benefits -141 -174 -33
Assets held for sale and directly related liabilities 16 16 -
Net financial debt 13,652 13,709 +57
Shareholders' equity 7,172 7,229 +57

14
Q & A S e s s i o n

15
A n n e x e s
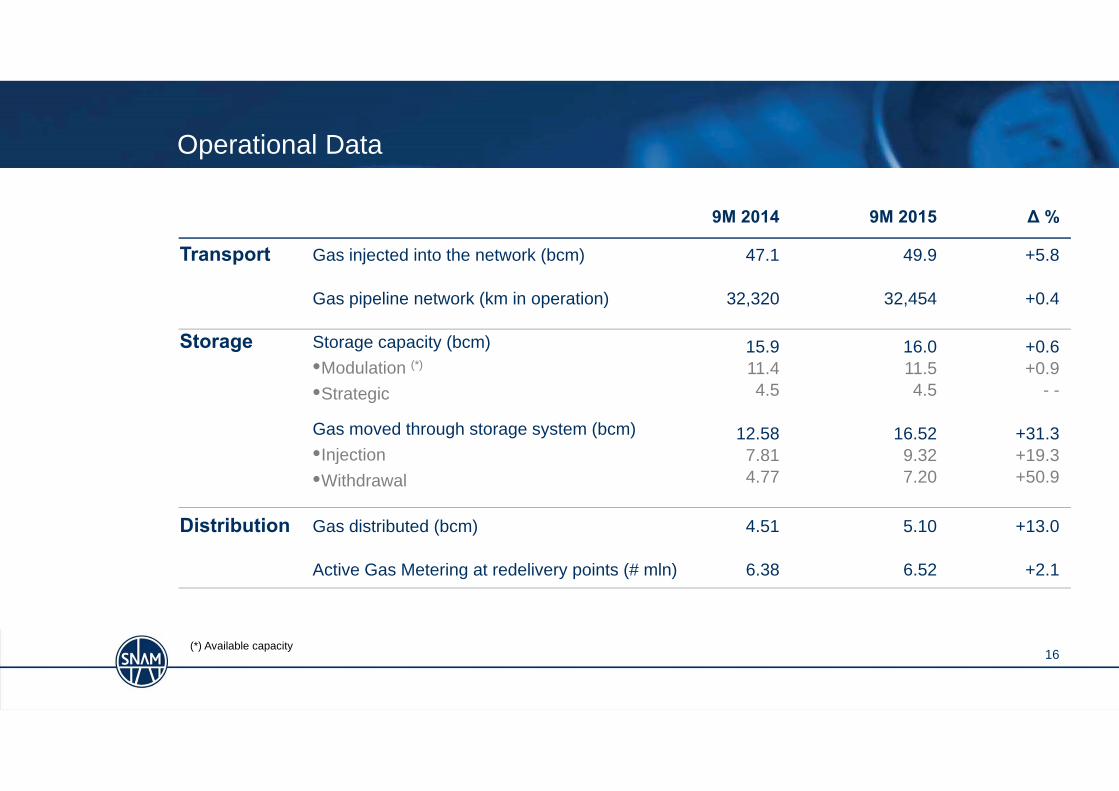
Operational Data
9M 2014 9M 2015 ∆ %
Transport Gas injected into the network (bcm) 47.1 49.9 +5.8
Gas pipeline network (km in operation) 32,320 32,454 +0.4
Storage Storage capacity (bcm)•Modulation (*)
•Strategic
15.911.44.5
16.011.54.5
+0.6+0.9
- -
Gas moved through storage system (bcm)•Injection•Withdrawal
12.587.814.77
16.529.327.20
+31.3+19.3+50.9
Distribution Gas distributed (bcm) 4.51 5.10 +13.0
Active Gas Metering at redelivery points (# mln) 6.38 6.52 +2.1
16(*) Available capacity
17
Disclaimer
Snam’s Chief Financial Officer, Antonio Paccioretti, in his position as manager responsible for the preparation of financial reports, certifiespursuant to paragraph 2, article 154-bis of the Legislative Decree n. 58/1998, that data and information disclosures herewith set forthcorrespond to the company’s evidence and accounting books and entries.
This presentation contains forward-looking statements regarding future events and the future results of Snam that are based on currentexpectations, estimates, forecasts, and projections about the industries in which Snam operates and the beliefs and assumptions of themanagement of Snam.In particular, among other statements, certain statements with regard to management objectives, trends in results of operations, margins, costs,return on equity, risk management are forward-looking in nature.Words such as ‘expects’, ‘anticipates’, ‘targets’, ‘goals’, ‘projects’, ‘intends’, ‘plans’, ‘believes’, ‘seeks’, ‘estimates’, variations of such words, andsimilar expressions are intended to identify such forward-looking statements.These forward-looking statements are only predictions and are subject to risks, uncertainties, and assumptions that are difficult to predictbecause they relate to events and depend on circumstances that will occur in the future.Therefore, Snam’s actual results may differ materially and adversely from those expressed or implied in any forward-looking statements.Factors that might cause or contribute to such differences include, but are not limited to, economic conditions globally, political, economic andregulatory developments in Italy and internationally.Any forward-looking statements made by or on behalf of Snam speak only as of the date they are made. Snam does not undertake to updateforward-looking statements to reflect any changes in Snam’s expectations with regard thereto or any changes in events, conditions orcircumstances on which any such statement is based.The reader should, however, consult any further disclosures Snam may make in documents it files with the Italian Securities and ExchangeCommission and with the Italian Stock Exchange.

snam.it
Milan, October 28th , 20152015 3Q Results