d4 pervin datastatistikhidrologidhaka
DESCRIPTION
rsxdytfguyTRANSCRIPT
100 Year Flood Simulation forDhaka City Using Multiple Models
Ismat Pervin, Md. Feroz Islam, Imtiaz Taher, David Khan
Institute of Water Modelling (IWM)
Outline• System Introduction
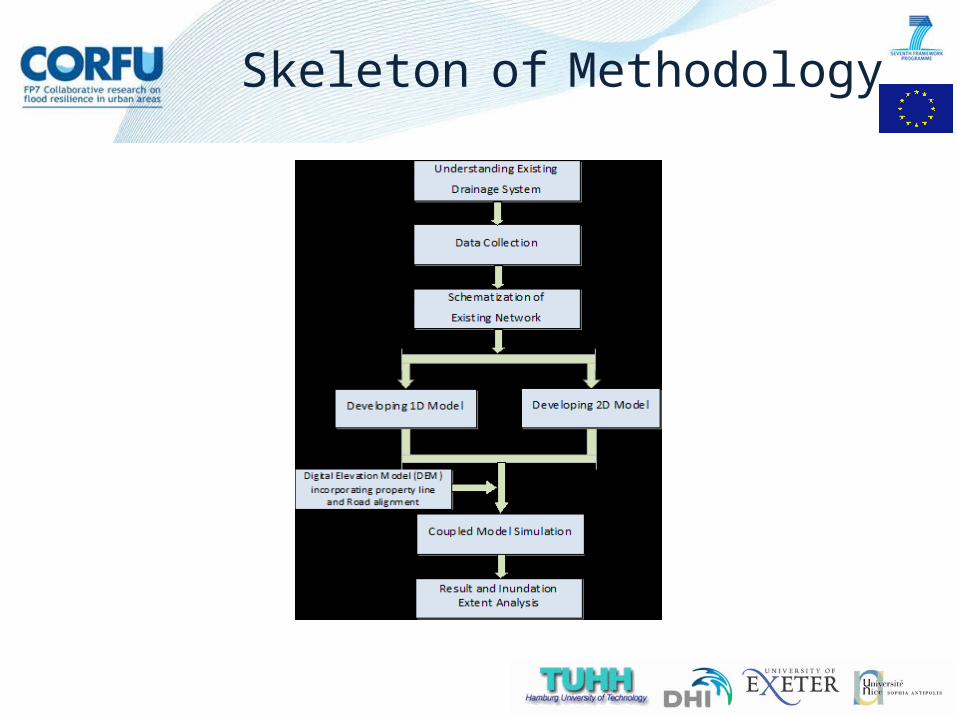
• Model Development Process
• Result Interpretation
• Conclusions
(SWMC)
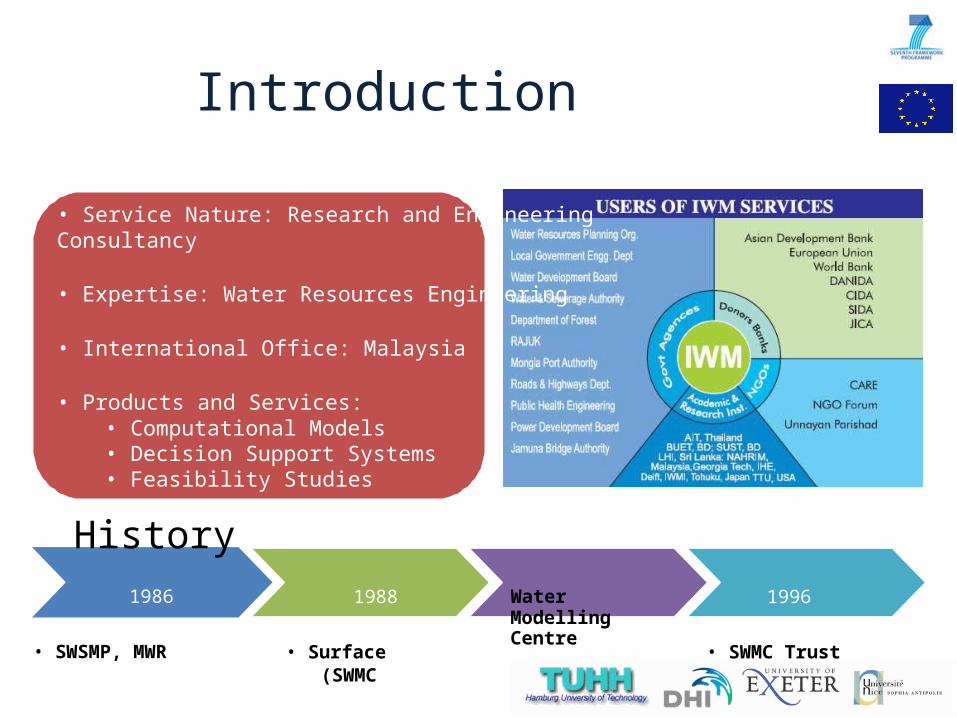
Introduction• Service Nature: Research and EngineeringConsultancy
• Expertise: Water Resources Engineering
• International Office: Malaysia
• Products and Services:• Computational Models• Decision Support Systems• Feasibility Studies
History1986
• SWSMP, MWR
1988
• Surface WaterModelling Centre
1996
• SWMC Trust
2002
• Institute of WaterModelling (IWM)

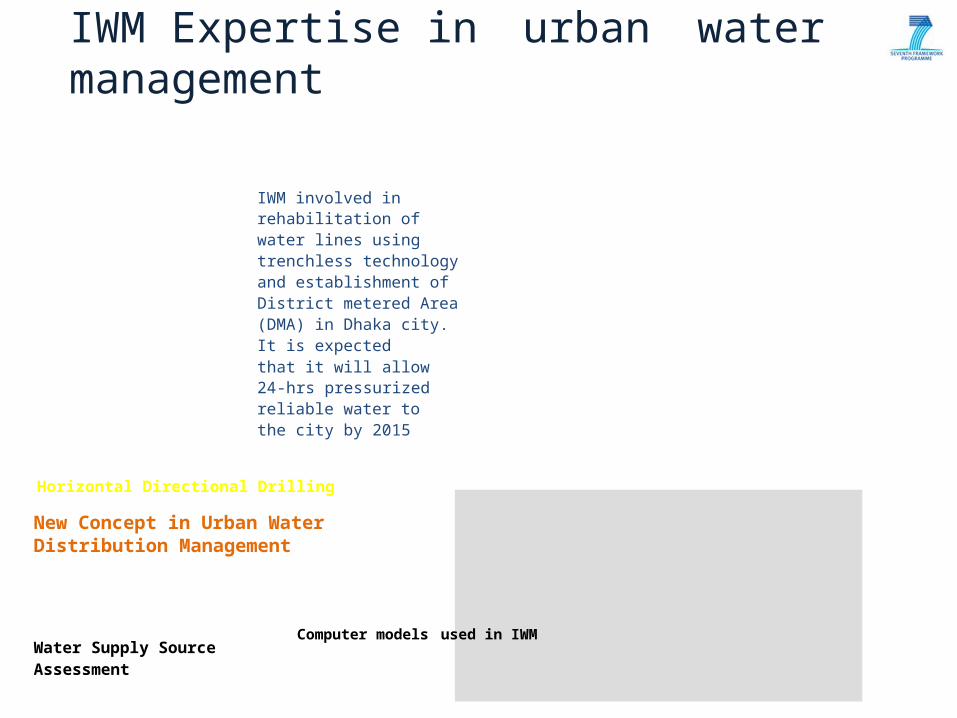
IWM Expertise in urbanwater management
Sewer Master Plan
IWM involved in rehabilitation of water lines using trenchless technology and establishment of District metered Area (DMA) in Dhaka city. It is expectedthat it will allow 24-hrs pressurized reliable water to the city by 2015
Horizontal Directional Drilling
New Concept in Urban WaterDistribution Management
Water Supply Source AssessmentComputer models used in IWM
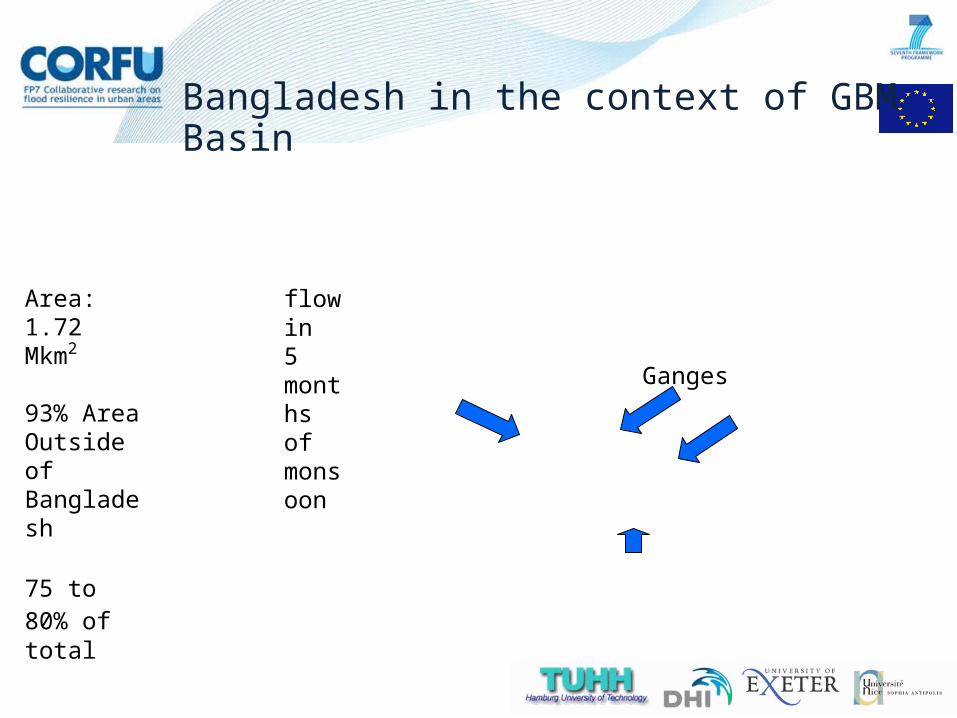
Bangladesh in the context of GBM Basin
Area:1.72 Mkm2
93% Area Outside of Bangladesh
75 to 80% oftotal flow in5 months ofmonsoon
Ganges
Brahmaputra
Meghna
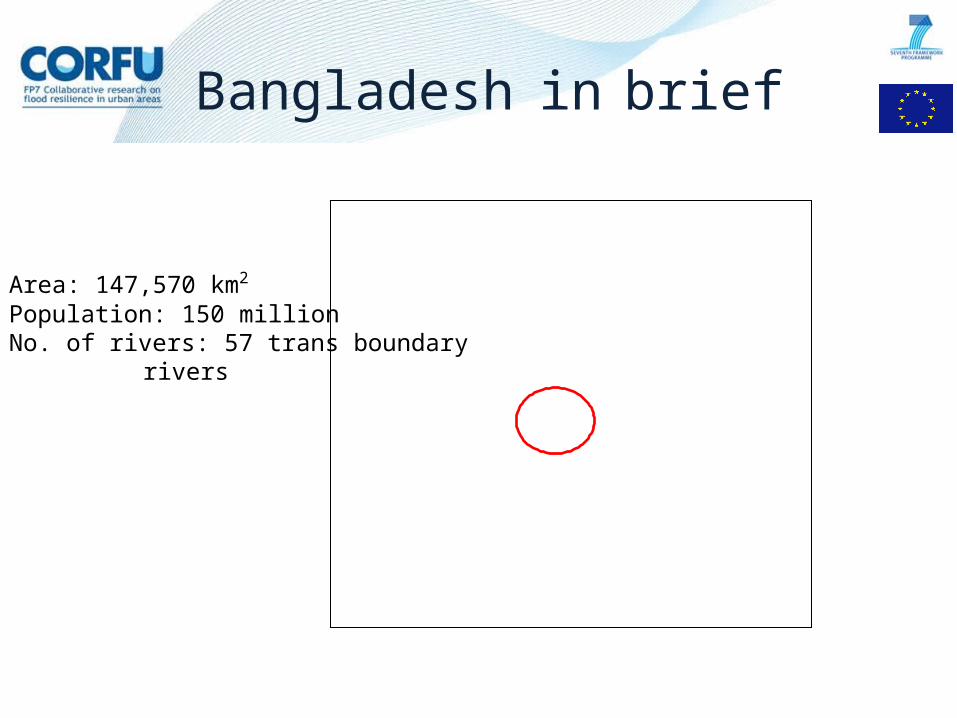
Bangladesh in brief
Area: 147,570 km2
Population: 150 millionNo. of rivers: 57 trans boundary
rivers

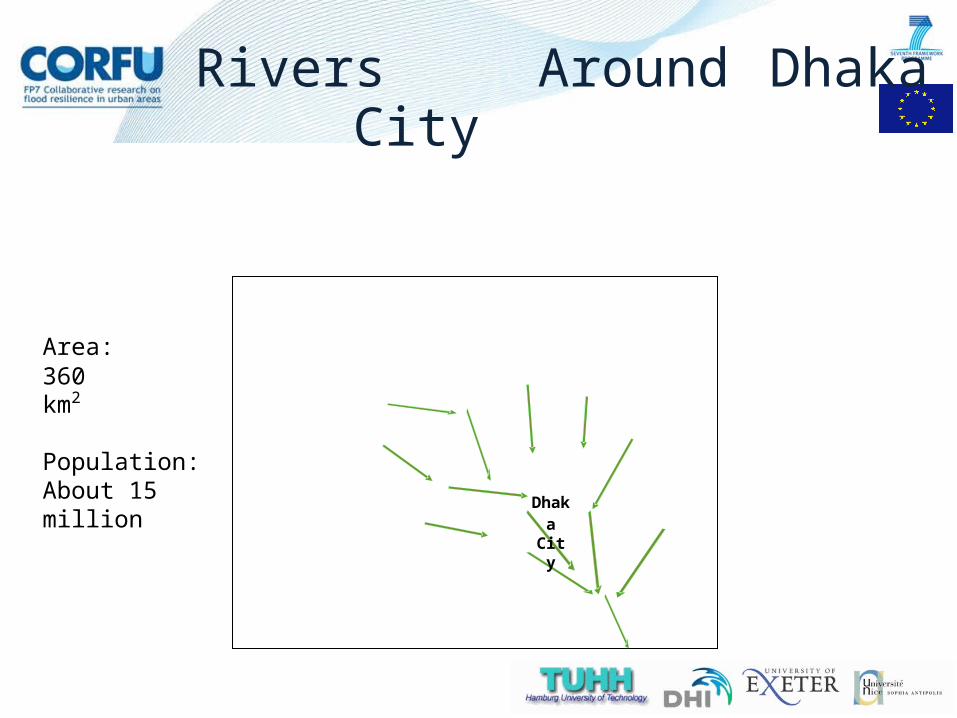
Area:360 km2
Rivers Around DhakaCity
Population:About 15 million Dhaka
City

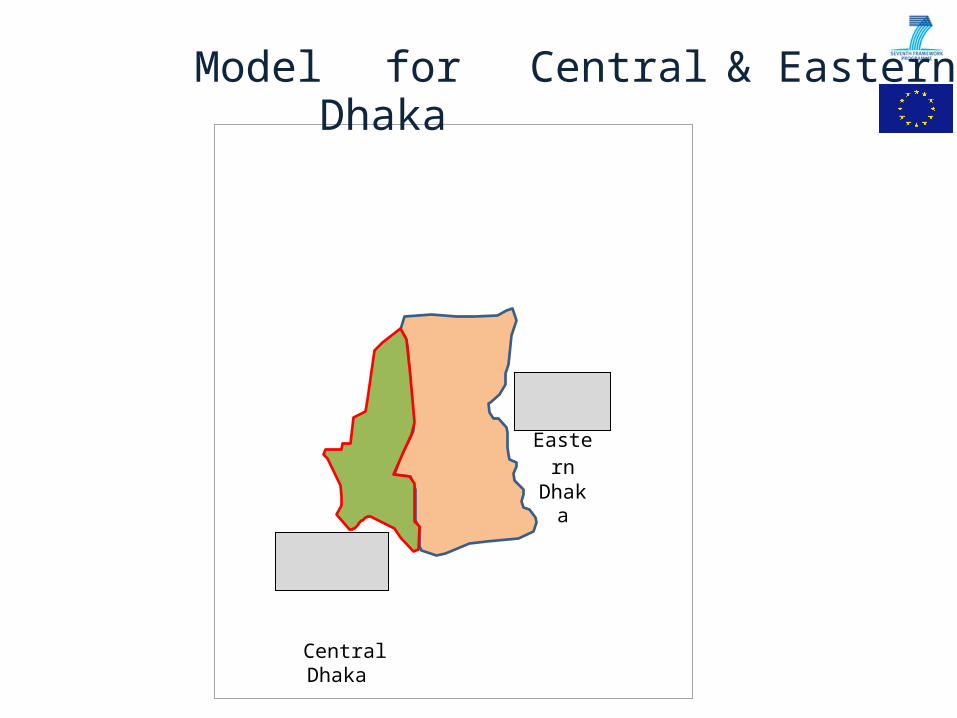
Model for Central & EasternDhaka
EasternDhaka
CentralDhaka
Pragati Sharani as Drainage Divider
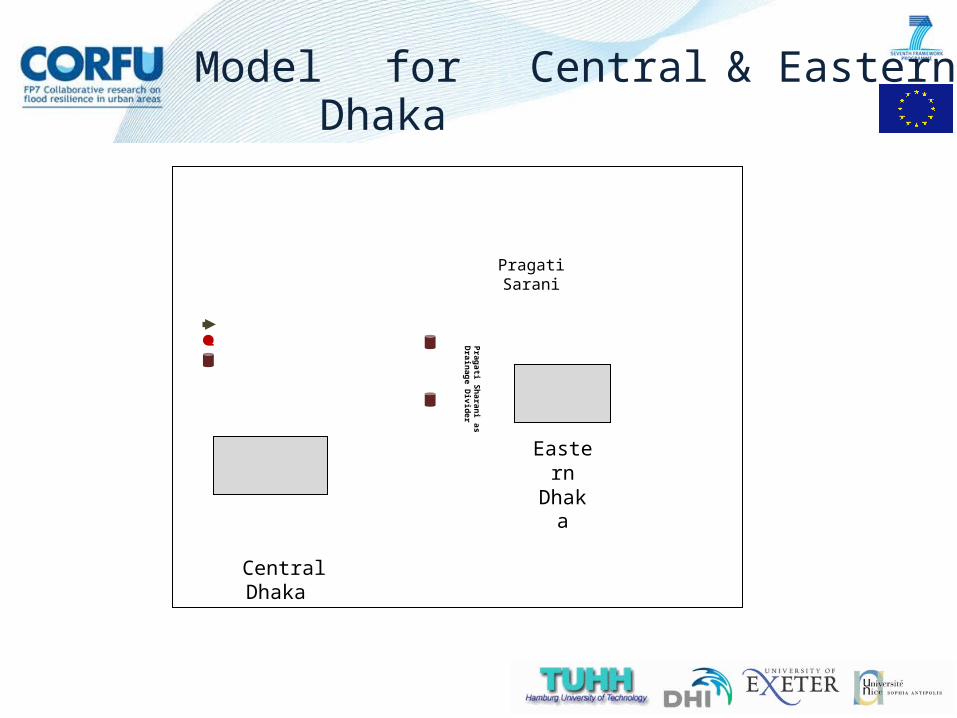
Model for Central & EasternDhaka
Pragati Sarani
EasternDhaka
CentralDhaka
Types of Flood River FloodWater intrusion to the low lying areas of city from Surrounding Rivers. Since the internalDrainage network discharges to the rivers, at high water level in the river, the drainage system becomes dysfunctional.
Urban FloodCaused by high intensitystorm rainfall runoff in the city area. The incidentrunoff
overwhelms existing drainage infrastructure, both natural and man made. This leads to water logging for an extended period of time.
Dhaka ContextEastern Dhaka is unprotected. It is usually effected by river flood caused by high water levelin the rivers.
As the Central Dhaka is protected by embankments, it is usually effected by Urban flood caused by drainage congestion.
Rain
fall
(mm
)
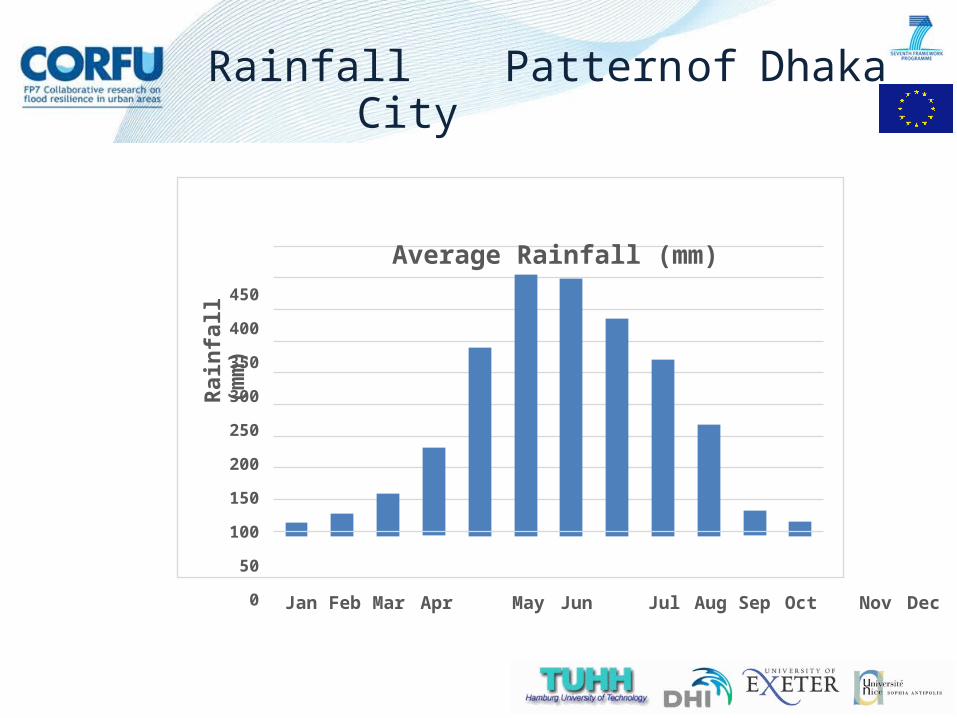
Rainfall Pattern of DhakaCity
450
400
350
300
250
200
150
100
50
0
Average Rainfall (mm)
Jan Feb Mar Apr May Jun Jul Aug Sep Oct Nov Dec
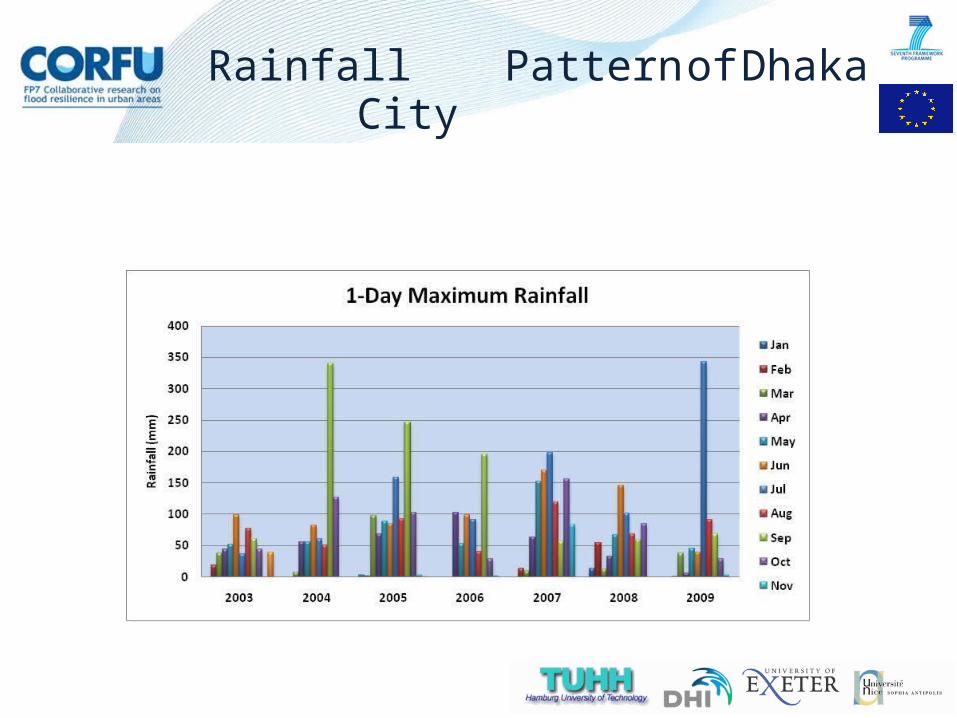
Rainfall Pattern of DhakaCity
Rain
fall
(mm
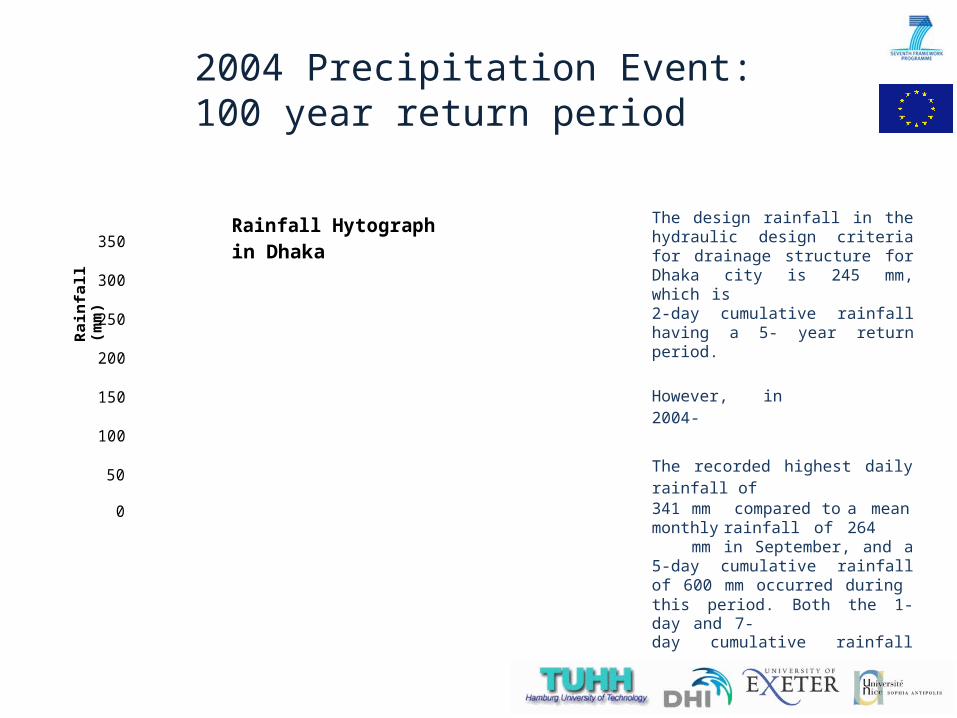
)2004 Precipitation Event:100 year return period
350
300
250
200
150
100
50
0
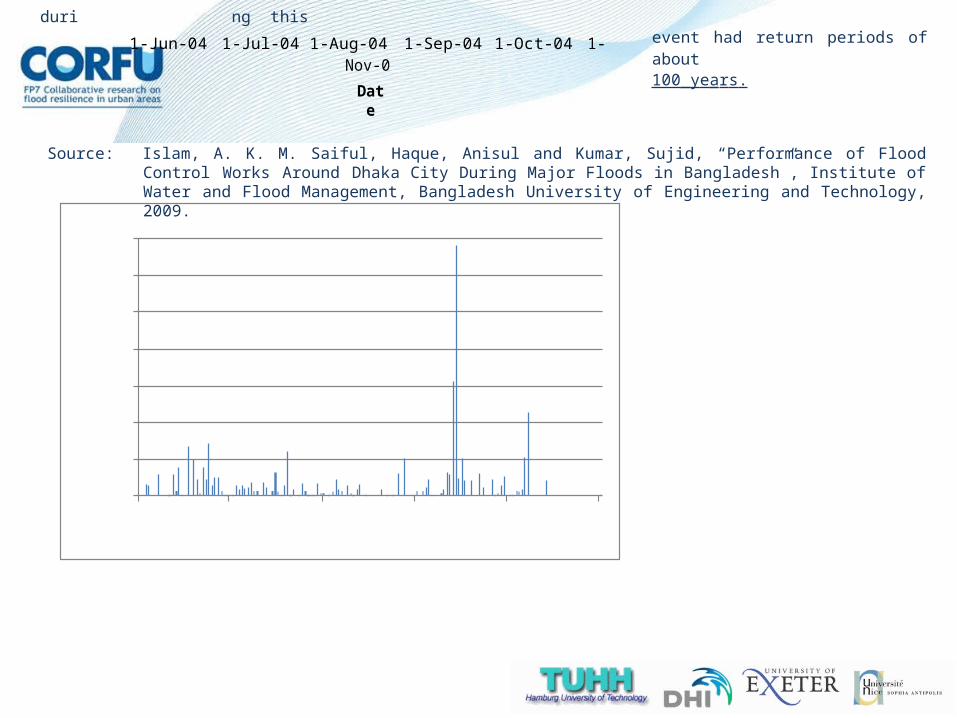
Rainfall Hytograph in Dhaka
The design rainfall in the hydraulic design criteria for drainage structure for Dhaka city is 245 mm, which is2-day cumulative rainfall having a 5- year return period.
However, in 2004-
The recorded highest daily rainfall of341 mm compared to a
mean monthly rainfallof264 mm in September,
and a 5-day cumulative rainfall of 600 mm occurred duringthis period. Both the 1-day and 7-day cumulative rainfall during this
1-Jun-04 1-Jul-04 1-Aug-04 1-Sep-04 1-Oct-04 1-Nov-0 Da
te event had return periods of about100 ye ars .
Source: Islam, A. K. M. Saiful, Haque, Anisul and Kumar, Sujid, “Performance of Flood Control Works Around Dhaka City During Major Floods in Bangladesh”, Institute of Water and Flood Management, Bangladesh University of Engineering and Technology, 2009.
Skeleton of Methodology
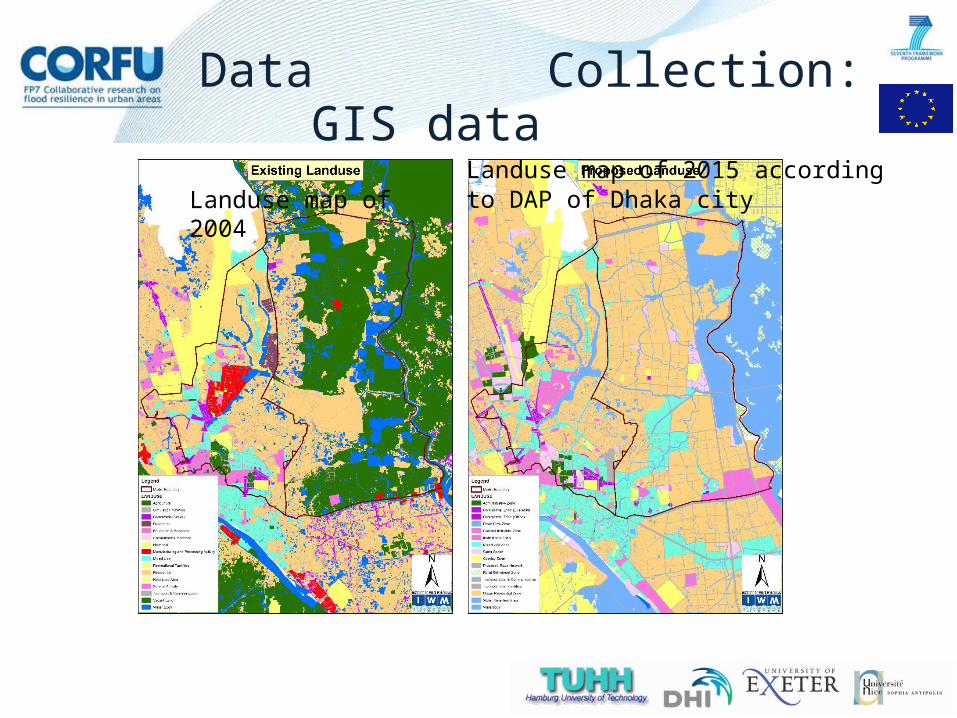
Data Collection: GIS data
Landuse map of 2015 accordingLanduse map of 2004 to DAP of Dhaka city
Source: Capital Development Authority (Rajuk)
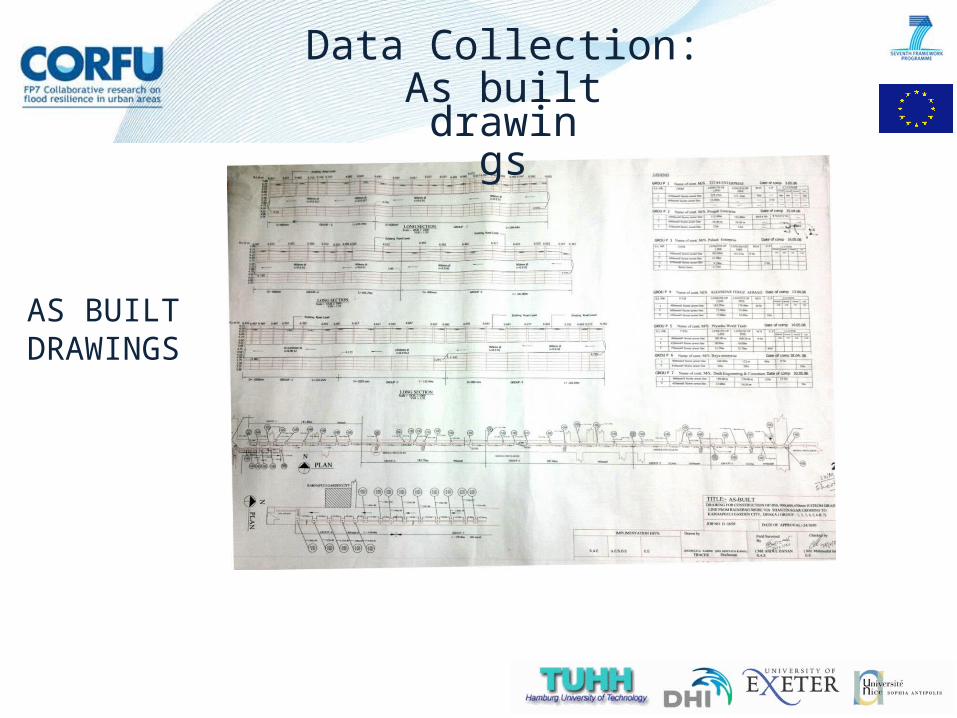
AS BUILT DRAWINGS
Data Collection: As builtdrawing
s
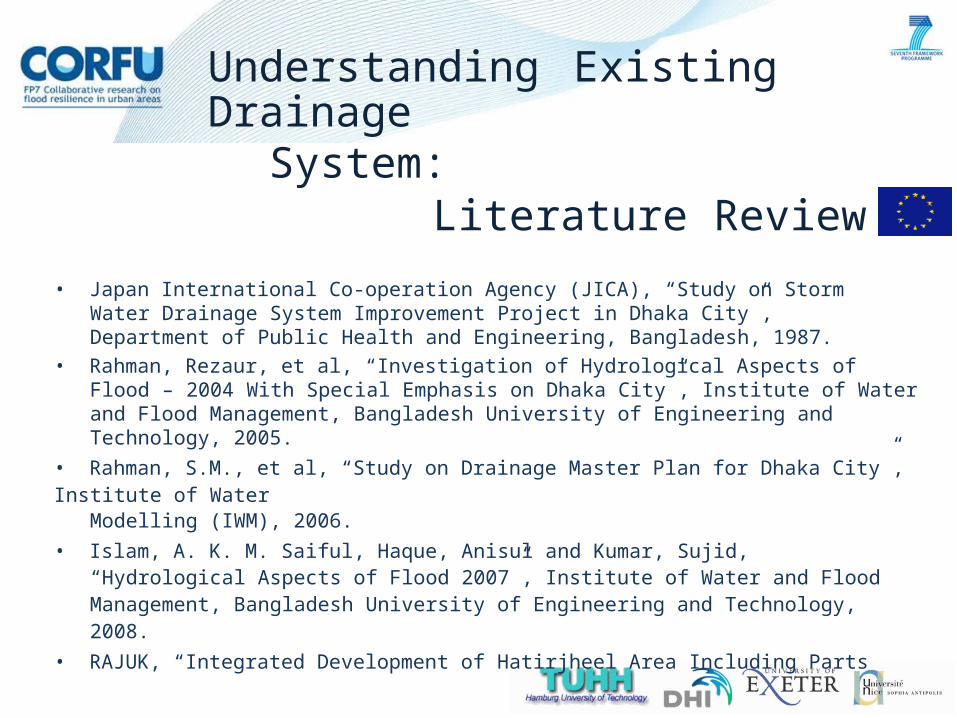
UnderstandingExisting DrainageSystem:
Literature Review• Japan International Co-operation Agency (JICA), “Study on Storm Water
Drainage System Improvement Project in Dhaka City”, Department of Public Health and Engineering, Bangladesh, 1987.
• Rahman, Rezaur, et al, “Investigation of Hydrological Aspects of Flood – 2004 With Special Emphasis on Dhaka City”, Institute of Water and Flood Management, Bangladesh University of Engineering and Technology, 2005.
• Rahman, S.M., et al, “Study on Drainage Master Plan for Dhaka City”, Institute of Water
Modelling (IWM), 2006.• Islam, A. K. M. Saiful, Haque, Anisul and Kumar, Sujid, “Hydrological Aspects of
Flood 2007”, Institute of Water and Flood Management, Bangladesh University of Engineering and Technology, 2008.
• RAJUK, “Integrated Development of Hatirjheel Area Including Parts of Bagunbari Khal”, Mid- term report, Bangladesh University of Engineering and Technology, 2008.
• Islam, A. K. M. Saiful, Haque, Anisul and Kumar, Sujid, “Performance of Flood Control Works Around Dhaka City During Major Floods in Bangladesh”, Institute

of Water and Flood Management, Bangladesh University of Engineering and Technology, 2009.
• Murshed, Sonia Binte, Islam, AKM Saiful and Khan, M. Shah Alam, “Impact of Climate Change on Rainfall Intensity in Bangladesh”, Institute of Water and Flood Management, Bangladesh University of Engineering and Technology, 2011.
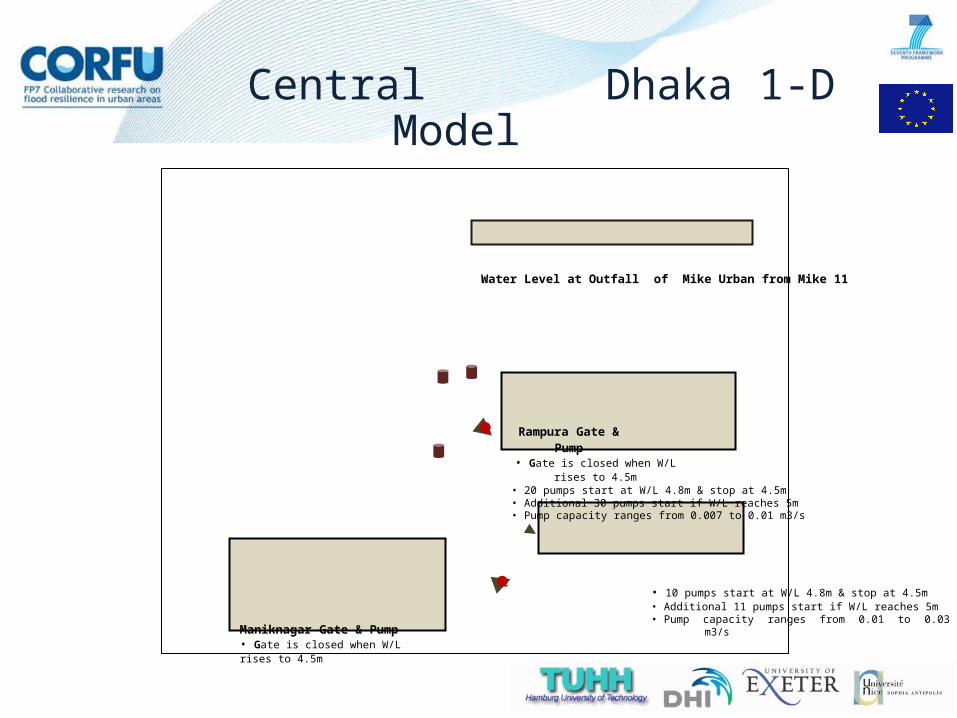
Central Dhaka 1-DModel
Water Level at Outfall of Mike Urban from Mike 11
Rampura Gate & Pump• Gate is closed when W/L rises to 4.5m• 20 pumps start at W/L 4.8m & stop at 4.5m• Additional 30 pumps start if W/L reaches 5m• Pump capacity ranges from 0.007 to 0.01 m3/s
Maniknagar Gate & Pump• Gate is closed when W/L rises to 4.5m• 10 pumps start at W/L 4.8m & stop at 4.5m• Additional 11 pumps start if W/L reaches 5m
• Pump capacity ranges from 0.01 to 0.03m3/s
Manda Sluice Gate• Gate is closed when W/L rises to 5.4m• No pump is available
Wat
er L
evel
(mPW
D)
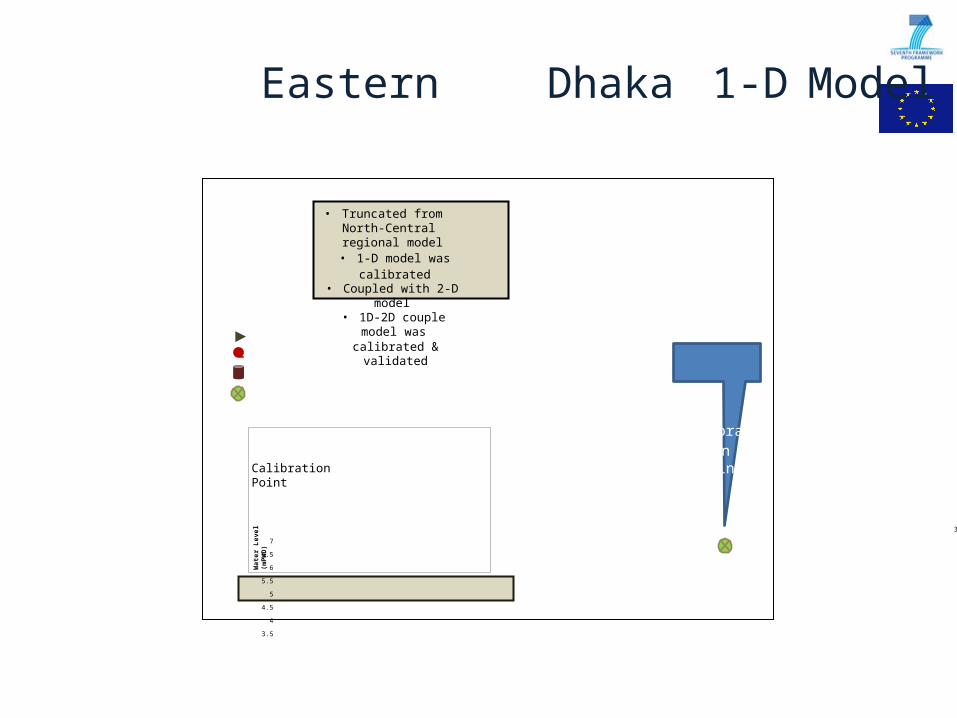
Eastern Dhaka 1-D Model
• Truncated from North-Central regional model
• 1-D model was calibrated• Coupled with 2-D model• 1D-2D couple model was
calibrated & validated
Calibration Point
CalibrationPoint
7
6.5
6
5.5
5
4.5
4
3.5
3
Water level Hydrograph at Demra
1-Jun-04 1-Jul-04 31-Jul-04 30-Aug-04 29-Sep-04 29-Oct-04
Date
Water Level at Demra on Balu River from Mike 11
1-DModel Simulation

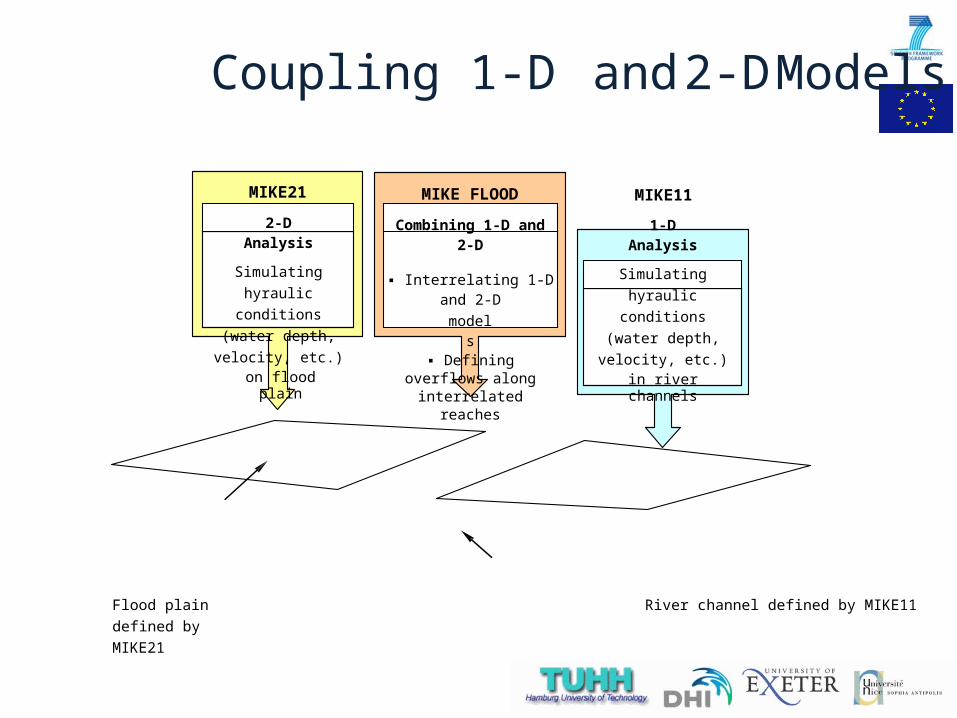
Coupling 1-D and2-DModels
MIKE212-D Analysis
Simulating hyraulic conditions
(water depth, velocity, etc.)
on flood plain
MIKE FLOODCombining 1-D and 2-D
▪ Interrelating 1-D and 2-D
models▪ Defining overflows
along interrelated reaches
MIKE111-D Analysis
Simulating hyraulic conditions
(water depth, velocity, etc.)
in river channels
Flood plain defined by MIKE21
River channel defined by MIKE11
Lateral Link defined by MIKE FLOOD
Source: Danish Hydraulic Institute (DHI)
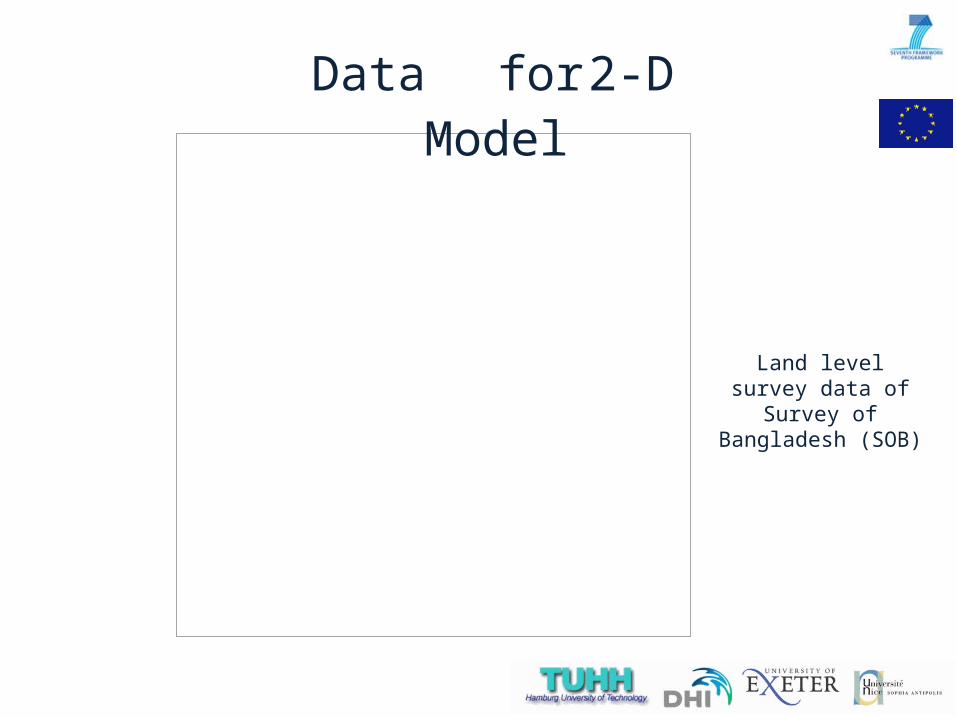
Data for 2-DModel
Land level survey data of Survey of Bangladesh (SOB)

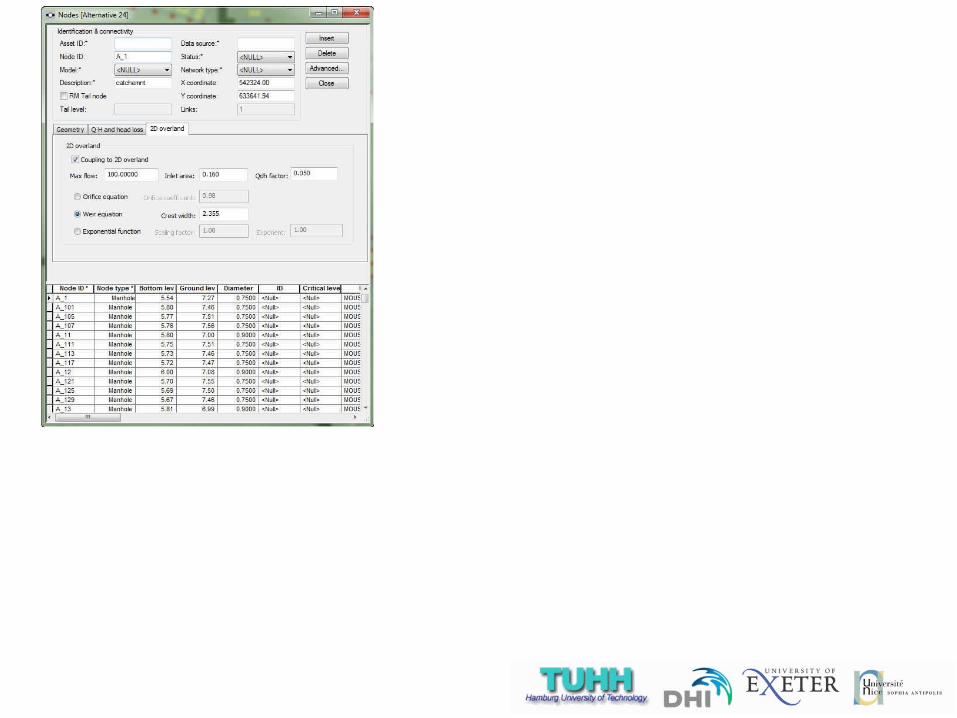
Developing 1-D 2-D Couple Model
in Mike Urban
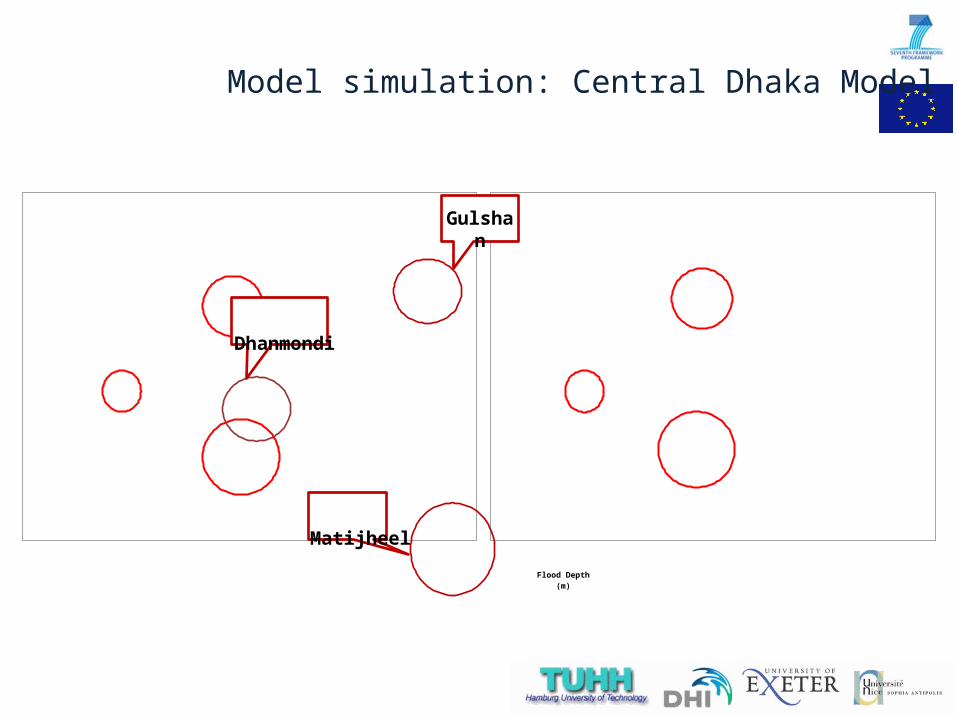
Model simulation: Central Dhaka Model
Gulshan
Dhanmondi
Matijheel
Flood Depth (m)
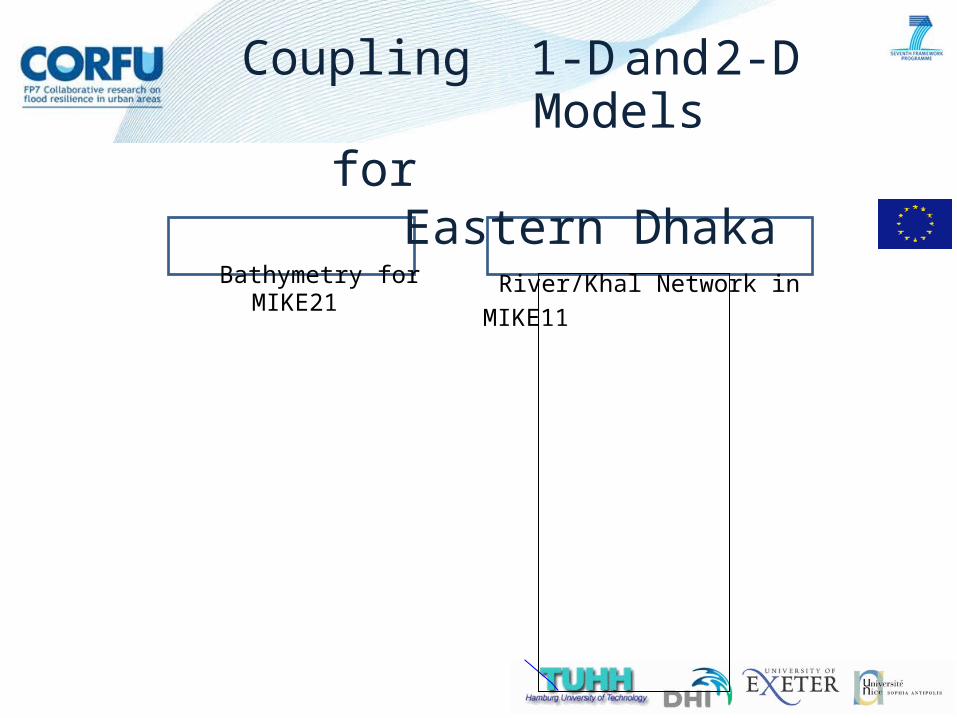
Coupling 1-D and2-DModels
forEastern DhakaBathymetry for
MIKE21River/Khal Network in MIKE11
Model Calibration: Eastern Dhaka Model
Results Interpretation: Flood Exposure
Flood Duration (min)
Results Interpretation:VelocityGradient
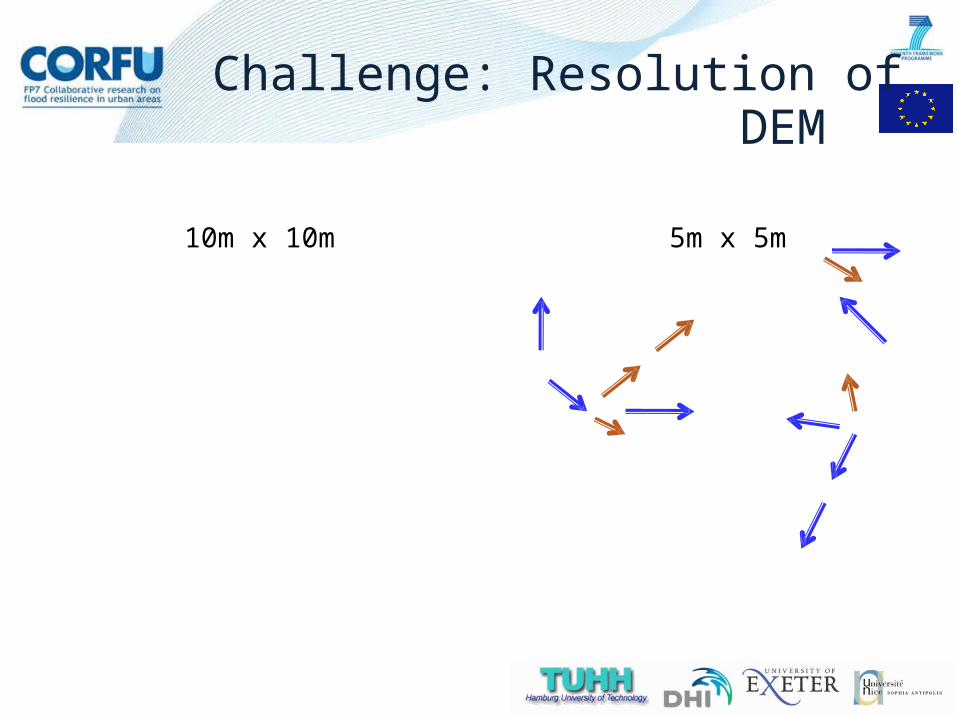
Challenge: Resolution ofDEM
10m x 10m 5m x 5m
No flow area
MH Pocket
Road Flow Path
Flow area
Road
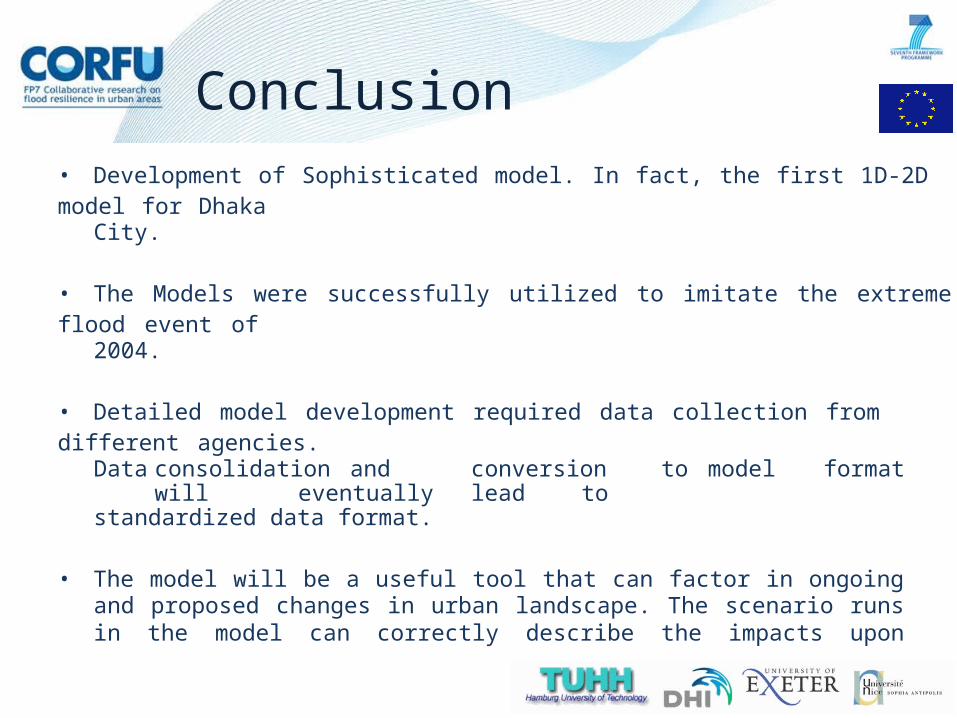
Conclusion• Development of Sophisticated model. In fact, the first 1D-2D model for Dhaka
City.
• The Models were successfully utilized to imitate the extreme flood event of
2004.
• Detailed model development required data collection from different agencies.
Data consolidation and conversion to model format willeventually lead to
standardized data format.
• The model will be a useful tool that can factor in ongoing and proposed changes in urban landscape. The scenario runs in the model can correctly describe the impacts upon drainage infrastructures. This will help policy makers in adopting better strategies and infrastructure solutions.
• Integrated models require more detailed data, computational resources and skill development. The CORFU initiative is only the beginning!
ThankYou
Land Development
)s/3(m ffonRu
Area
(km
2 )
Results Interpretation:Eastern Dhaka
Model
Flood Depth Comparision for 1D and 1D-2D couple model35
30 1D-2D couple model1D model
25
20
15
10
5
-
0-0.5m 0.5-1m 1-2m 2-3m 3-3.5m 3.5-4m >4m
Flood Depth
Floo
d Du
ratio
n(ho
ur)
Results Interpretation:
CentralDhakaModel
35.00
30.00
Flood Depth Comparison
1 in 10 year event 1 in 30 year event 1 in 100 year event Actual event
80.00
70.00
Flood Duration Comparison
1 in 10 year event 1 in 30 year event 1 in 100 year event Actual event
25.0060.00
20.00
15.00
50.00
40.00
30.00
10.0020.00
5.0010.00
Area
(km
2 )0.00
Flood Free 0.1-0.25 0.25-0.75 0.75-1.5 >1.5Flood Depth (m)
0.00Average Maximum