atex style aastex6 v. 1 - arxiv typeset using latex style aastex6 v. 1.0 ... area of the sky in the...
TRANSCRIPT
ApJ submittedPreprint typeset using LATEX style AASTeX6 v. 1.0
ASTROSAT CZT IMAGER OBSERVATIONS OF GRB 151006A: TIMING, SPECTROSCOPY, AND
POLARISATION STUDY
A. R. Rao1, Vikas Chand1, M.K. Hingar1, S. Iyyani1, Rakesh Khanna1, A.P.K. Kutty1, J.P. Malkar1, D. Paul1,V. B. Bhalerao2, D. Bhattacharya2, G. C. Dewangan2, Pramod Pawar2,3, A. M. Vibhute2, T. Chattopadhyay4,
N.P.S. Mithun4, S.V. Vadawale4, N. Vagshette4, R. Basak5, P. Pradeep6, Essy Samuel6, S. Sreekumar6, P.Vinod6, K.H. Navalgund7, R. Pandiyan7, K. S. Sarma7, S. Seetha7 K. Subbarao7
1Department of Astronomy and Astrophysics, Tata Institute of Fundamental Research, Homi Bhabha Road, Mumbai, India;2Inter University Center for Astronomy & Astrophysics, Pune, India3 S. R. T. M. University, Nanded, India4Physical Research Laboratory, Ahmedabad, India5Nicolaus Copernicus Astronomical Center, Polish Academy of Sciences, Warsaw, Poland6Vikram Sarabhai Space Centre, Thiruvananthapuram, India7ISRO Satellite Centre, Bengaluru, India
ABSTRACT
AstroSat is a multi-wavelength satellite launched on 2015 September 28. The CZT Imager of AstroSat
on its very first day of operation detected a long duration gamma-ray burst (GRB) namely GRB
151006A. Using the off-axis imaging and spectral response of the instrument, we demonstrate that
CZT Imager can localise this GRB correct to about a few degrees and it can provide, in conjunction
with Swift, spectral parameters similar to that obtained from Fermi/GBM. Hence CZT Imager would
be a useful addition to the currently operating GRB instruments (Swift and Fermi). Specifically, we
argue that the CZT Imager will be most useful for the short hard GRBs by providing localisation for
those detected by Fermi and spectral information for those detected only by Swift. We also provide
preliminary results on a new exciting capability of this instrument: CZT Imager is able to identify
Compton scattered events thereby providing polarisation information for bright GRBs. GRB 151006A,
in spite of being relatively faint, shows hints of a polarisation signal at 100–300 keV (though at a low
significance level). We point out that CZT Imager should provide significant time resolved polarisation
measurements for GRBs that have fluence 3 times higher than that of GRB 151006A. We estimate
that the number of such bright GRBs detectable by CZT Imager is 5 – 6 per year. CZT Imager
can also act as a good hard X–ray monitoring device for possible electromagnetic counterparts of
Gravitational Wave events.Keywords: gamma-ray burst: general — gamma-ray burst: individual (151006A) — X–rays: general
— instrumentation: detectors
1. INTRODUCTION
The past decade has seen a tremendous improvement
in our understanding of gamma-ray bursts (GRBs), par-
ticularly after the launch of Swift and Fermi satellites
(Gehrels 2004; Gehrels & Meszaros 2012).
With its quick localisation ability, Swift could detect
the afterglows of many GRBs and help measure their
redshifts (Gehrels, Ramirez-Ruiz, & Fox 2009). The
Fermi satellite, on the other hand, provided the widest
ever spectral coverage of the prompt emission of GRBs
from 8 keV to ∼ 40 MeV using the GBM instrument,
and extending further up to >300 GeV with the LAT
instrument for some GRBs (Meegan et al. 2009; Atwood
et al. 2009).
A new addition to the suite of instruments studying
GRBs is the hard X–ray imager Cadmium Zinc Tel-
luride Imager (CZTI) on AstroSat, the Indian multi–
wavelength observatory (Singh et al. 2014). CZTI
utilises a coded aperture mask and Cadmium Zinc Tel-
luride detectors (Figure 1, left) to image a 4.6◦× 4.6◦
area of the sky in the 20–200 keV range (Bhalerao
et al. 2016). Apart from this primary coded field of
view, CZTI functions as an open detector at energies
> 100 keV, sensitive to almost the entire sky (Figure 1,
right). At these energies, CZTI also has X–ray polarisa-
tion capabilities (Chattopadhyay et al. 2014; Vadawale
et al. 2015). CsI (Tl) scintillators placed below the CZT
modules for active anti–coincidence shielding (Figure 1,right) also serve as all–sky high energy detectors in the
arX
iv:1
608.
0738
8v1
[as
tro-
ph.H
E]
26
Aug
201
6

2 Rao et al.
100–500 keV range.
Swift and Fermi satellites showcase two different ap-
proaches to the study of GRBs. For quick and precise
localisation, Swift uses a Coded Aperture Mask (CAM)
and large area pixelated Cadmium Zinc Telluride (CZT)
detectors with 4 mm×4 mm pixels of 2 mm thickness
(Barthelmy et al. 2005). At such thickness, CZT detec-
tors have low spectral response at higher energies (above
about 150 keV) and hence BAT by itself cannot pre-
cisely measure the peak energy of hard GRBs. In fact
the number of short GRBs detected by Swift is much
lower than that detected by other instruments, particu-
larly due to the lack of response to high energy X–rays
(Band 2006). On the other hand, Fermi uses multiple
open NaI crystal detectors (Meegan et al. 2009) and lo-
calises the GRBs by comparing the relative counts in
the different detectors. Hence the resultant localisation
accuracy is poor (several degrees) and the energy reso-
lution of the detectors are rather modest (Meegan et al.
2009). Consequently, the prompt spectral studies are
hampered and hence a good understanding of the ra-
diation mechanism during the prompt phase is lacking.
With its wide field of view, high energy coverage, and
good spectral resolution, CZTI thus fills the gap between
the capabilities Swift and Fermi.
On the very first day of operation, CZTI detected
GRB 151006A (Bhalerao et al. 2015). GRB 151006A
was first reported by Swift BAT (Kocevski et al. 2015) at
α = 09h49m48s, δ = +70◦30′31′′. The prompt emission
lasted for more than 300 s and, subsequently, detection
by other X–ray and Gamma-ray missions were reported
in a series of GCN circulars. Fermi triggered ∼ 4 s
before BAT and reported a T90 of ∼ 84 s (Roberts &
Meegan 2015). Due to the wide angle detection capabili-
ties of CZTI, GRB 151006A was registered in CZTI even
though the incident angle was as large as ∼ 60◦ from its
pointing direction (Bhalerao et al. 2015). The presence
of double Compton events are also seen in CZTI, which
will help measure the polarisation of the GRB (Vadawale
et al. 2015). Coincidentally, GRB 151006A is also the
first detected GRB in the CALorimetric Electron Tele-
scope (CALET) aboard the International Space Station
Gamma-Ray Burst Monitor detection (CGBM). CGBM
reported a double peak separated by 4 seconds (Yoshida
et al. 2015).
In this paper, we present the results of the CZTI ob-
servations of GRB 151006A. We demonstrate that CZTI
with Swift can give spectral parameters similar to that
obtained by Fermi/GBM and CZTI can localise this
GRB correct to a few degrees. We also present some re-
sults of the measurements of hard X–ray polarisation in
this GRB and show that CZTI will be very useful in con-
straining the emission mechanism in the prompt phase
of GRBs. A detailed description of CZT Imager is given
in Bhalerao et al. (2016) and details of onboard per-
formance and spectral fitting methodology are given in
Vadawale et al. (2016) and Chattopadhyay et al. (2016).
For the sake of completeness, however, some salient tech-
nical details of CZT Imager are given in the following
sections while discussing results like light curves, spec-
tra, localisation, and polarisation.
2. OBSERVATIONS AND DATA REDUCTION
2.1. Swift BAT
The Swift–BAT data were retrieved from HEASARC’s
data outlet1. Lightcurves with 1 s time bin in dif-
ferent energy ranges were made by making use of
HEASOFT-6.17, FTOOLS and the recipe as described in
Swift–BAT software guide2. We applied gain correction
using bateconvert, then batbinevt was utilised to pro-
duce lightcurves after making a detector plane image
(dpi), retrieving problematic detectors, removing hot
pixels and subtracting the background using batbinevt
again, batdetmask, bathotpix and batmaskwtevt, re-
spectively. The background subtraction is an advantage
with coded aperture masked detectors.
The time integrated Swift–BAT spectrum is obtained
in the BAT mission elapsed times (METs) correspond-
ing to the times of our selection for joint time-integrated
spectral analysis (465818107.555 – 465818198.115 BAT
MET). The steps followed to get BAT spectrum are the
same as described above to obtain BAT light curves and
additional FTOOLS batupdatephakw and batphasyserr
are used for compensating the observed residual in the
responses and for making sure that we have the posi-
tion of the burst in instrument coordinates. We have
generated the detector response matrix (DRM) using
batdrmgen.
2.2. Fermi
Fermi–GBM has 12 thallium activated sodium iodide
(NaI) detectors and 2 Bismuth Germanate (BGO) detec-
tors, covering energy ranges 8.0 keV – 1000 keV and 200
keV – 40 MeV respectively (Meegan et al. 2009). The
NaI 0, 1, 3 (now onwards referred to as n#, where # is
the detector number) registered higher fluence than the
other NaI detectors as seen in the quick look data from
the Fermi GRB burst catalog on HEASARC3. Time
tagged event data are available for the complete range
spanning the T90 of this GRB and we make use of this
1 HEASARC archive: https://heasarc.gsfc.nasa.gov/cgi-bin/W3Browse/w3browse.pl
2 Swift–BAT guide: http://swift.gsfc.nasa.gov/analysis/bat_swguide_v6_3.pdf
3 Fermi GRB catalog: https://heasarc.gsfc.nasa.gov/W3Browse/fermi/fermigbrst.html
CZT Imager observations of GRB 151006A 3
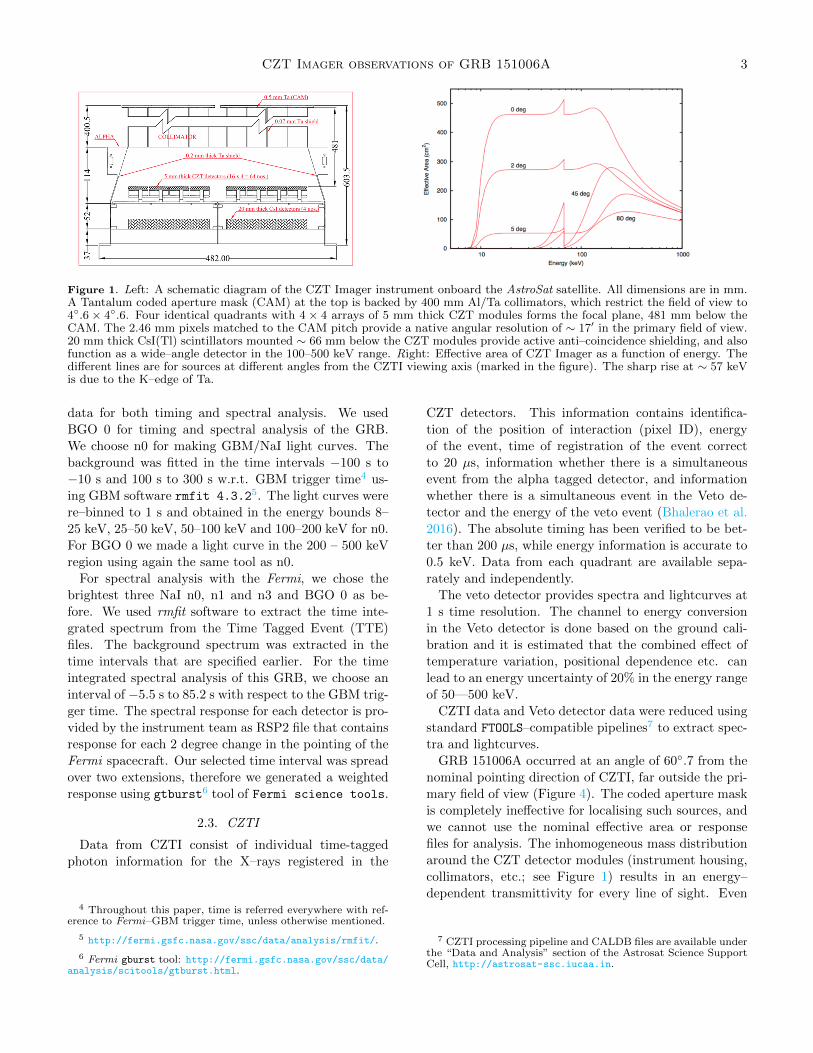
Figure 1. Left: A schematic diagram of the CZT Imager instrument onboard the AstroSat satellite. All dimensions are in mm.A Tantalum coded aperture mask (CAM) at the top is backed by 400 mm Al/Ta collimators, which restrict the field of view to4◦.6 × 4◦.6. Four identical quadrants with 4 × 4 arrays of 5 mm thick CZT modules forms the focal plane, 481 mm below theCAM. The 2.46 mm pixels matched to the CAM pitch provide a native angular resolution of ∼ 17′ in the primary field of view.20 mm thick CsI(Tl) scintillators mounted ∼ 66 mm below the CZT modules provide active anti–coincidence shielding, and alsofunction as a wide–angle detector in the 100–500 keV range. Right: Effective area of CZT Imager as a function of energy. Thedifferent lines are for sources at different angles from the CZTI viewing axis (marked in the figure). The sharp rise at ∼ 57 keVis due to the K–edge of Ta.
data for both timing and spectral analysis. We used
BGO 0 for timing and spectral analysis of the GRB.
We choose n0 for making GBM/NaI light curves. The
background was fitted in the time intervals −100 s to
−10 s and 100 s to 300 s w.r.t. GBM trigger time4 us-
ing GBM software rmfit 4.3.25. The light curves were
re–binned to 1 s and obtained in the energy bounds 8–
25 keV, 25–50 keV, 50–100 keV and 100–200 keV for n0.
For BGO 0 we made a light curve in the 200 – 500 keV
region using again the same tool as n0.
For spectral analysis with the Fermi, we chose the
brightest three NaI n0, n1 and n3 and BGO 0 as be-
fore. We used rmfit software to extract the time inte-
grated spectrum from the Time Tagged Event (TTE)
files. The background spectrum was extracted in the
time intervals that are specified earlier. For the time
integrated spectral analysis of this GRB, we choose an
interval of −5.5 s to 85.2 s with respect to the GBM trig-
ger time. The spectral response for each detector is pro-
vided by the instrument team as RSP2 file that contains
response for each 2 degree change in the pointing of the
Fermi spacecraft. Our selected time interval was spread
over two extensions, therefore we generated a weighted
response using gtburst6 tool of Fermi science tools.
2.3. CZTI
Data from CZTI consist of individual time-tagged
photon information for the X–rays registered in the
4 Throughout this paper, time is referred everywhere with ref-erence to Fermi–GBM trigger time, unless otherwise mentioned.
5 http://fermi.gsfc.nasa.gov/ssc/data/analysis/rmfit/.
6 Fermi gburst tool: http://fermi.gsfc.nasa.gov/ssc/data/analysis/scitools/gtburst.html.
CZT detectors. This information contains identifica-
tion of the position of interaction (pixel ID), energy
of the event, time of registration of the event correct
to 20 µs, information whether there is a simultaneous
event from the alpha tagged detector, and information
whether there is a simultaneous event in the Veto de-
tector and the energy of the veto event (Bhalerao et al.
2016). The absolute timing has been verified to be bet-
ter than 200 µs, while energy information is accurate to
0.5 keV. Data from each quadrant are available sepa-
rately and independently.
The veto detector provides spectra and lightcurves at
1 s time resolution. The channel to energy conversion
in the Veto detector is done based on the ground cali-
bration and it is estimated that the combined effect of
temperature variation, positional dependence etc. can
lead to an energy uncertainty of 20% in the energy range
of 50—500 keV.
CZTI data and Veto detector data were reduced using
standard FTOOLS–compatible pipelines7 to extract spec-
tra and lightcurves.
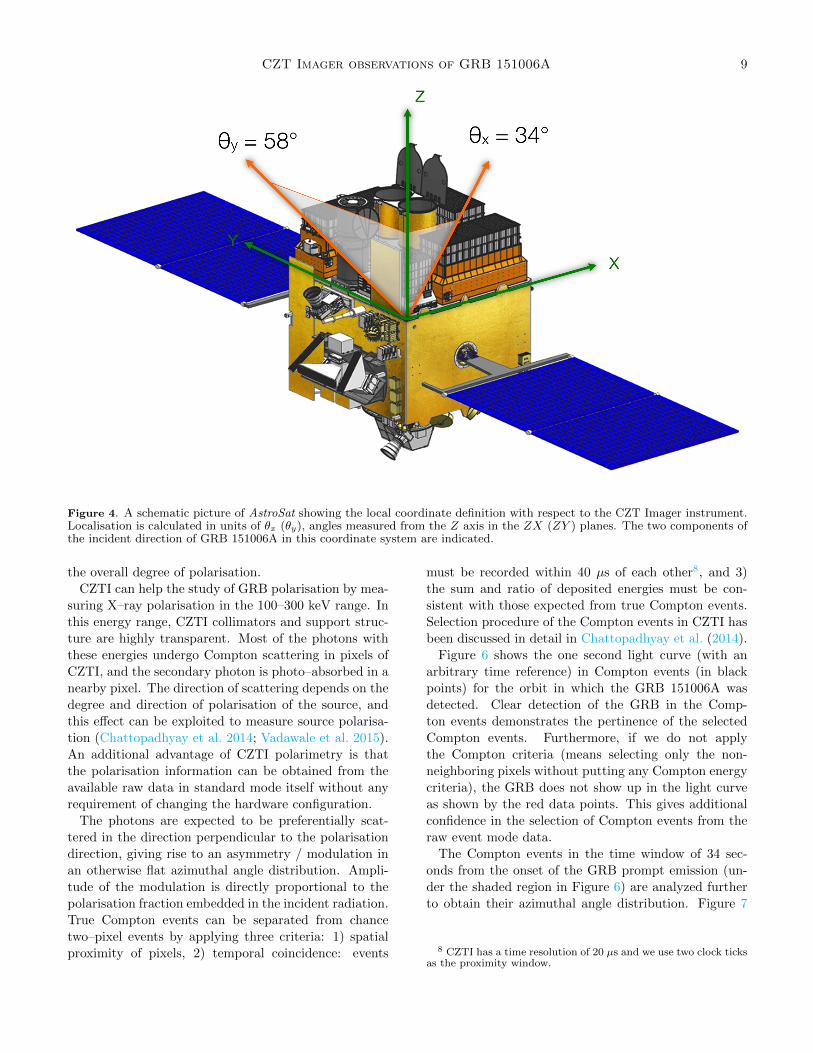
GRB 151006A occurred at an angle of 60◦.7 from the
nominal pointing direction of CZTI, far outside the pri-
mary field of view (Figure 4). The coded aperture mask
is completely ineffective for localising such sources, and
we cannot use the nominal effective area or response
files for analysis. The inhomogeneous mass distribution
around the CZT detector modules (instrument housing,
collimators, etc.; see Figure 1) results in an energy–
dependent transmittivity for every line of sight. Even
7 CZTI processing pipeline and CALDB files are available underthe “Data and Analysis” section of the Astrosat Science SupportCell, http://astrosat-ssc.iucaa.in.
4 Rao et al.
for a given direction, this transmittivity is different for
each CZT pixel.
We have developed a ray tracing code to estimate the
effective area of each pixel in the detector plane for an
object at a given location in the sky. The mechanical
structure given in Figure 1 is represented by 63 distinct
surfaces which are converted into as many cuboids de-
fined by area, thickness, absorbing material, and orien-
tation with respect to the detector surface. For each
pixel, the efficiency of transmission through all this ma-
terial is calculated, along with the detection efficiency
of the detectors and geometric projection terms, to give
an effective area for a given source direction and energy.
The blocking parts of the satellite along these lines of
sights have been assumed to be low–Z materials, and
have been ignored in this simulation.
For spectral analysis of GRB 151006A, we used the
Swift–BAT position to generate effective areas and re-
sponses independently for CZT and the Veto detectors,
separately for each quadrant for the latter. A Gaussian
response is generated for CZT with channels numbered
from 1 to 512 and Full Width at half maximum (FWHM)
of 2.5 keV. Quadrant wise responses were generated for
Veto detector with channels ranging from 0 to 255 and
FWHM of 13.04 keV.
3. RESULTS
3.1. Light Curves
The combined light curves of GRB 151006A using
data from Fermi, Swift, and CZTI are shown in Fig-
ure 2. The panels are arranged with increasing energy
from top to bottom, and data from different detectors
are shown in the same panels for similar energy ranges.
The observed count rates in BAT, normally given as
count s−1 per detector element, are multiplied by 1000
so that they roughly scale to the total observed counts.
The vertical dashed lines indicate the time range chosen
for spectral analysis (§3.2). Errors bars are not shown,
however, the typical errors in CZTI data are indicated
in the figure with comparative numbers from Fermi.
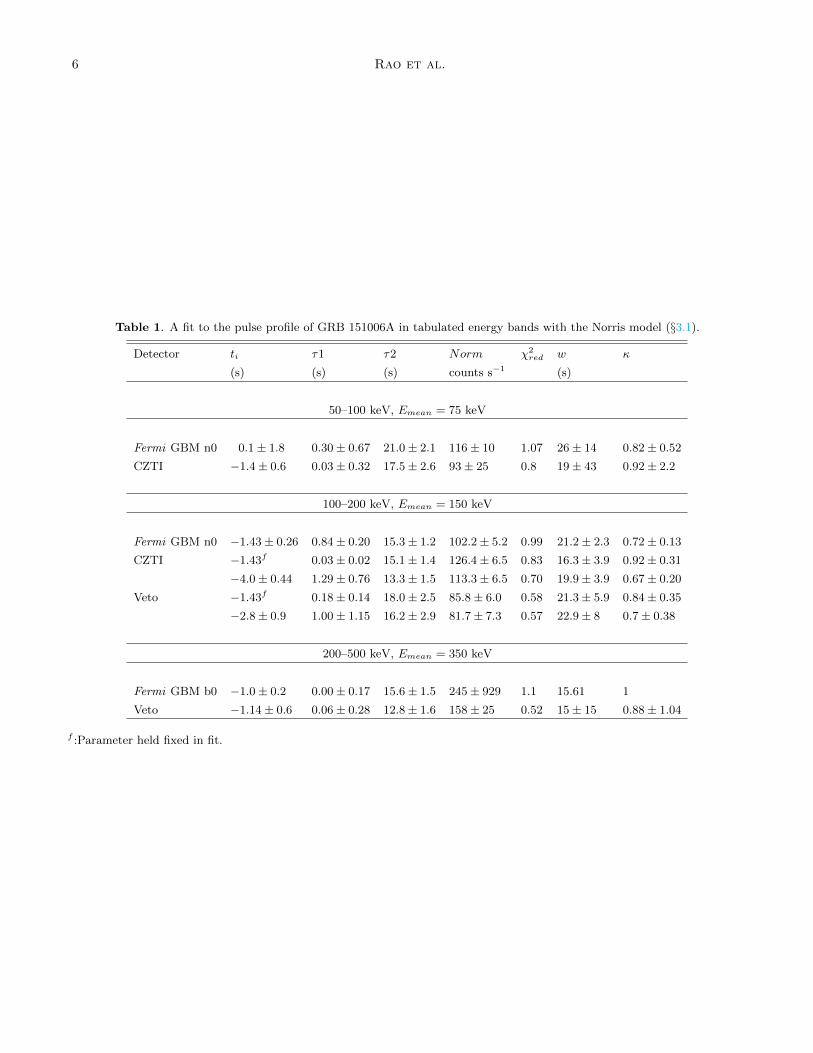
We fit the light curves with the Norris model (Norris
et al. 2005), which describes the temporal profile of GRB
pulses with the following equation:
I(t) = Aλ exp[−τ1/(t− ti)− (t− ti)/τ2], (1)
Here, t is time since trigger, ti is the pulse start time,
τ1 and τ2 are the scaling times of the pulse rise and
pulse decay, A is the pulse amplitude, and the con-
stant λ ≡ exp [2(τ1/τ2)1/2]. The pulse width, w, is
derived from the rise and decay time of the pulse as
τ2(1 + 4√τ1/τ2)0.5, and the asymmetry of the pulse is
τ2/w. The pulse shape parameters for different energy
bands are given in Table 1 for Fermi and CZTI data.
It can be seen that the parameters derived from the
CZT and Veto detectors agree with that of the BAT
and GBM pulses. Note that the pulse start time ti is
poorly constrained and when we fix this value for CZTI
data to that obtained from GBM, we get comparable
values of χ2. Further, the measured peak count rates
have comparable signal to noise ratio in CZTI and Fermi
demonstrating that above 100 keV CZTI is as sensitive
as Fermi for detecting GRBs.
3.2. Spectral Analysis
Many physical and empirical models have been used
for GRB spectral analysis, for instance the Band func-
tion (Band et al. 1993, Goldstein et al. 2013, Gruber
et al. 2014), Band + blackbody (Guiriec et al. 2011;
Axelsson et al. 2012; Burgess et al. 2014), blackbody
with a power law (Ryde 2005; Ryde & Pe’er 2009; Page
et al. 2011; Sparre & Starling 2012), double blackbodies
with a power law (Basak & Rao 2015; Iyyani et al. 2015)
etc. Here we examine the time integrated spectrum of
GRB 151006A with a few of the above mentioned mod-
els, primarily to emphasise the ability of joint spectral
analysis of BAT and CZTI data to produce spectral fit
results consistent with those of Fermi GBM. We make
our spectral analysis using four sets of data: a) GBM,
b) GBM jointly with CZTI, c) BAT, and d) BAT jointly
with CZTI.
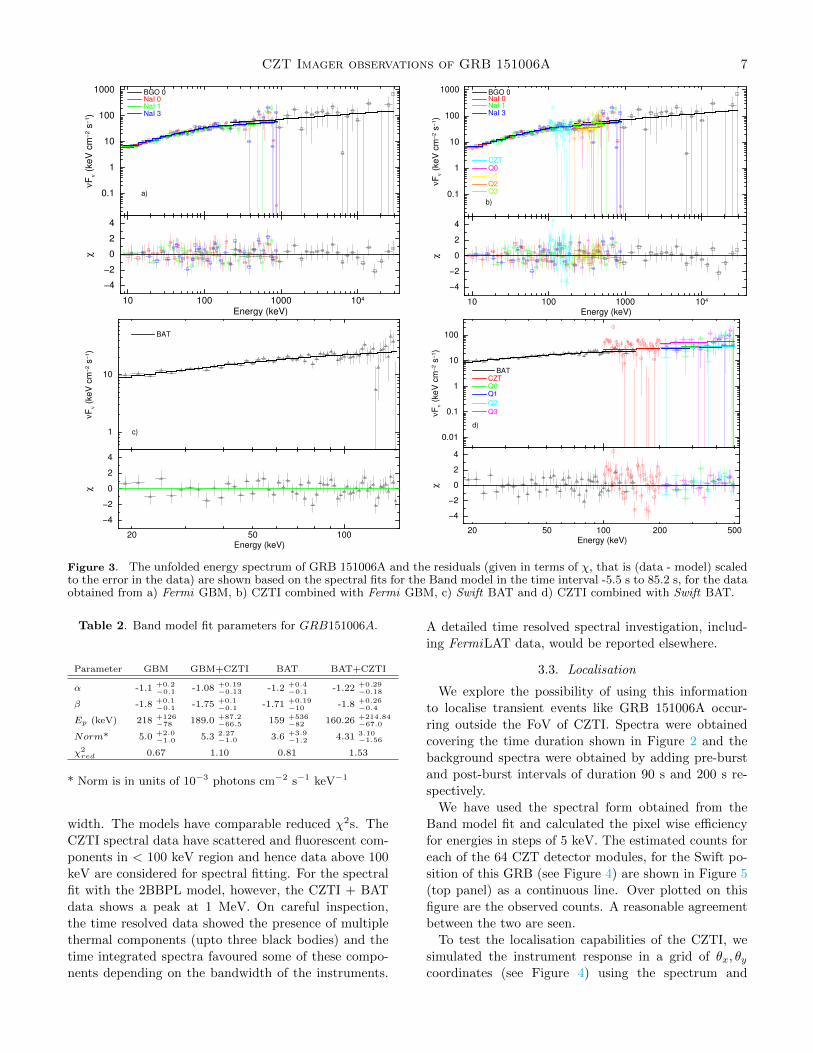
To start with, we use the Band model to fit all four sets
of data. The best–fit parameters are given in Table 2
the data and the results are given in Table 2 and the un-
folded spectra along with the residuals, given in terms of
χ, that is (data - model) scaled to the error in the data,
are shown in Figure 3, for all the four sets of data. It can
be seen that the high energy index, β is not constrained
using only the BAT data (due to limited high energy
response), but are constrained in all the other data sets.
The obtained values of β being greater than −2 indi-
cates the presence of high energy emission beyond the
currently analysed energy window of the detectors. An
examination of the residuals shows that CZTI data are
consistent with the others, though the use of CZTI data
gives a slightly higher value of reduced χ2. We also find
that the cross normalisation values for CZTI are within
20% of other detectors. For example, for the BAT data
jointly fit with CZTI data, the BAT normalisation with
respect to CZT detector is 0.8 ± 0.1, whereas the nor-
malisation of Veto detectors agree with CZT detectors
within errors. For GBM jointly fit with CZTI data, the
CZT detector normalisation with respect to GBM n0 is
0.8± 0.1.
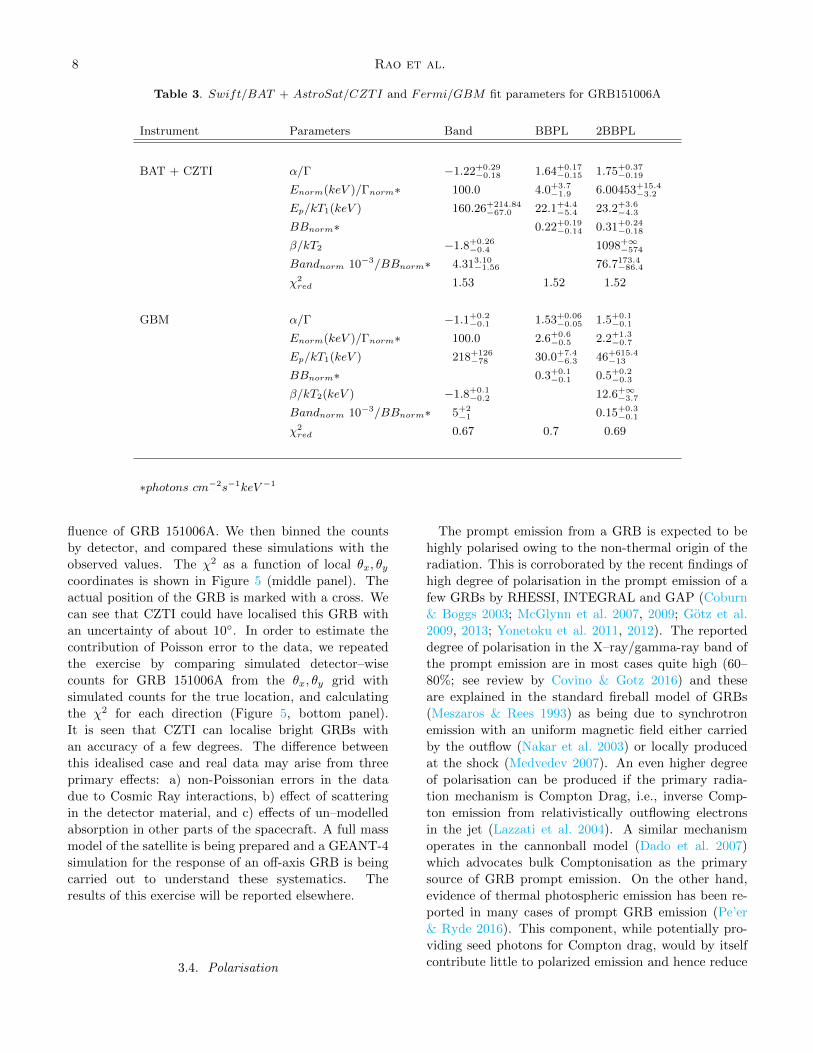
The fit values of the parameters obtained for other
models (BBPL and 2BBPL), along with the parameters
for the Band model, are listed in Table 3 for BAT jointly
with CZTI and GBM data to show the effectiveness of
using CZTI data with BAT to extend the energy band-
CZT Imager observations of GRB 151006A 5
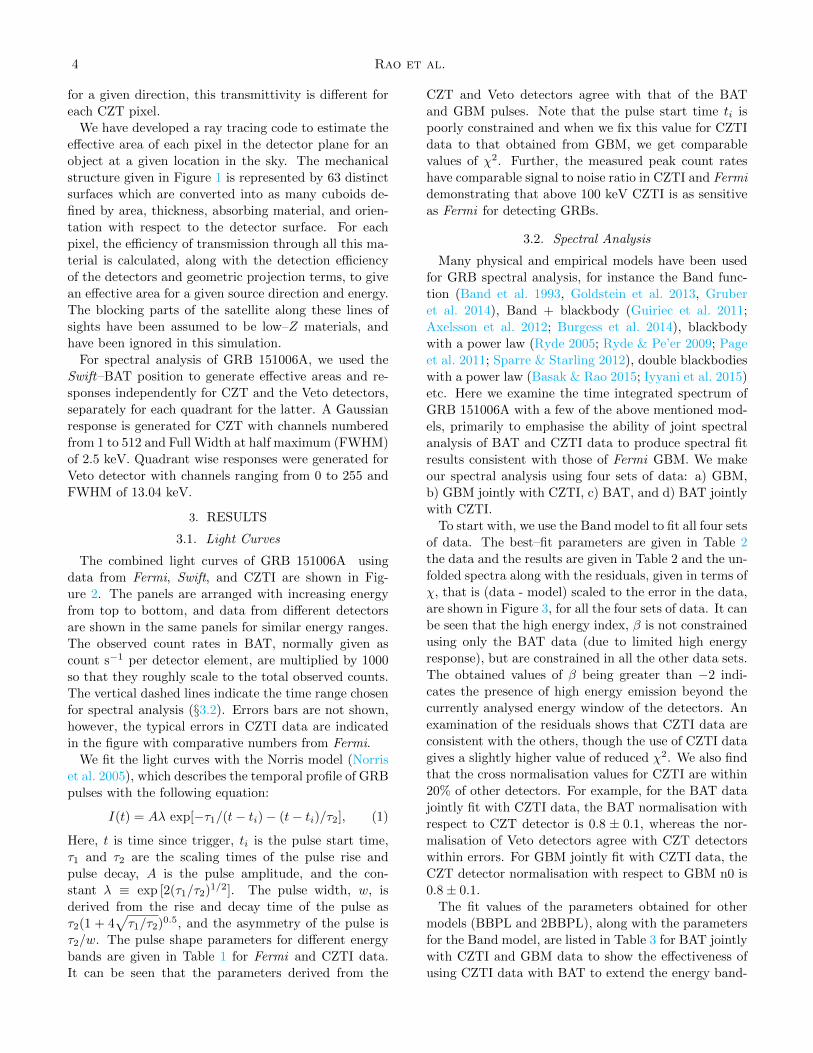
Figure 2. Light curves of GRB 151006A using GBM, BAT, and CZTI data in denoted energy bands. Time is w.r.t. GBMtrigger time and the bin size is 1 s. BAT light curves shown here are in counts/sec/illuminated detector and are scaled 1000times to plot along with GBM light curves. The vertical black dashed lines show the time range used for time integrated spectralanalysis. Error bars are not shown, but the typical error bar of CZTI, along with that from GBM, are shown in the third andfifth panels from the top.
6 Rao et al.
Table 1. A fit to the pulse profile of GRB 151006A in tabulated energy bands with the Norris model (§3.1).
Detector ti τ1 τ2 Norm χ2red w κ
(s) (s) (s) counts s−1 (s)
50–100 keV, Emean = 75 keV
Fermi GBM n0 0.1± 1.8 0.30± 0.67 21.0± 2.1 116± 10 1.07 26± 14 0.82± 0.52
CZTI −1.4± 0.6 0.03± 0.32 17.5± 2.6 93± 25 0.8 19± 43 0.92± 2.2
100–200 keV, Emean = 150 keV
Fermi GBM n0 −1.43± 0.26 0.84± 0.20 15.3± 1.2 102.2± 5.2 0.99 21.2± 2.3 0.72± 0.13
CZTI −1.43f 0.03± 0.02 15.1± 1.4 126.4± 6.5 0.83 16.3± 3.9 0.92± 0.31
−4.0± 0.44 1.29± 0.76 13.3± 1.5 113.3± 6.5 0.70 19.9± 3.9 0.67± 0.20
Veto −1.43f 0.18± 0.14 18.0± 2.5 85.8± 6.0 0.58 21.3± 5.9 0.84± 0.35
−2.8± 0.9 1.00± 1.15 16.2± 2.9 81.7± 7.3 0.57 22.9± 8 0.7± 0.38
200–500 keV, Emean = 350 keV
Fermi GBM b0 −1.0± 0.2 0.00± 0.17 15.6± 1.5 245± 929 1.1 15.61 1
Veto −1.14± 0.6 0.06± 0.28 12.8± 1.6 158± 25 0.52 15± 15 0.88± 1.04
f :Parameter held fixed in fit.
CZT Imager observations of GRB 151006A 7
0.1
1
10
100
1000νF
ν (
keV
cm
−2 s
−1)
BGO 0 NaI 0 NaI 1 NaI 3
a)
10 100 1000 104
−4
−2
0
2
4
χ
Energy (keV)
0.1
1
10
100
1000
νF
ν (
ke
V c
m−
2 s
−1)
BGO 0 NaI 0 NaI 1 NaI 3
CZT Q0 Q1 Q2 Q3
b)
10 100 1000 104
−4
−2
0
2
4
χ
Energy (keV)
1
10
νF
ν (
ke
V c
m−
2 s
−1)
BAT
c)
10020 50
−4
−2
0
2
4
χ
Energy (keV)
0.01
0.1
1
10
100
νF
ν (
keV
cm
−2 s
−1)
BAT CZT Q0 Q1
Q2
Q3
d)
10020 50 200 500
−4
−2
0
2
4
χ
Energy (keV)
Figure 3. The unfolded energy spectrum of GRB 151006A and the residuals (given in terms of χ, that is (data - model) scaledto the error in the data) are shown based on the spectral fits for the Band model in the time interval -5.5 s to 85.2 s, for the dataobtained from a) Fermi GBM, b) CZTI combined with Fermi GBM, c) Swift BAT and d) CZTI combined with Swift BAT.
Table 2. Band model fit parameters for GRB151006A.
Parameter GBM GBM+CZTI BAT BAT+CZTI
α -1.1 +0.2−0.1 -1.08 +0.19
−0.13 -1.2 +0.4−0.1 -1.22 +0.29
−0.18
β -1.8 +0.1−0.1 -1.75 +0.1
−0.1 -1.71 +0.19−10 -1.8 +0.26
−0.4
Ep (keV) 218 +126−78 189.0 +87.2
−66.5 159 +536−82 160.26 +214.84
−67.0
Norm* 5.0 +2.0−1.0 5.3 2.27
−1.0 3.6 +3.9−1.2 4.31 3.10
−1.56
χ2red 0.67 1.10 0.81 1.53
* Norm is in units of 10−3 photons cm−2 s−1 keV−1
width. The models have comparable reduced χ2s. The
CZTI spectral data have scattered and fluorescent com-
ponents in < 100 keV region and hence data above 100
keV are considered for spectral fitting. For the spectral
fit with the 2BBPL model, however, the CZTI + BAT
data shows a peak at 1 MeV. On careful inspection,
the time resolved data showed the presence of multiple
thermal components (upto three black bodies) and the
time integrated spectra favoured some of these compo-
nents depending on the bandwidth of the instruments.
A detailed time resolved spectral investigation, includ-
ing FermiLAT data, would be reported elsewhere.
3.3. Localisation
We explore the possibility of using this information
to localise transient events like GRB 151006A occur-
ring outside the FoV of CZTI. Spectra were obtained
covering the time duration shown in Figure 2 and the
background spectra were obtained by adding pre-burst
and post-burst intervals of duration 90 s and 200 s re-
spectively.
We have used the spectral form obtained from the
Band model fit and calculated the pixel wise efficiency
for energies in steps of 5 keV. The estimated counts for
each of the 64 CZT detector modules, for the Swift po-
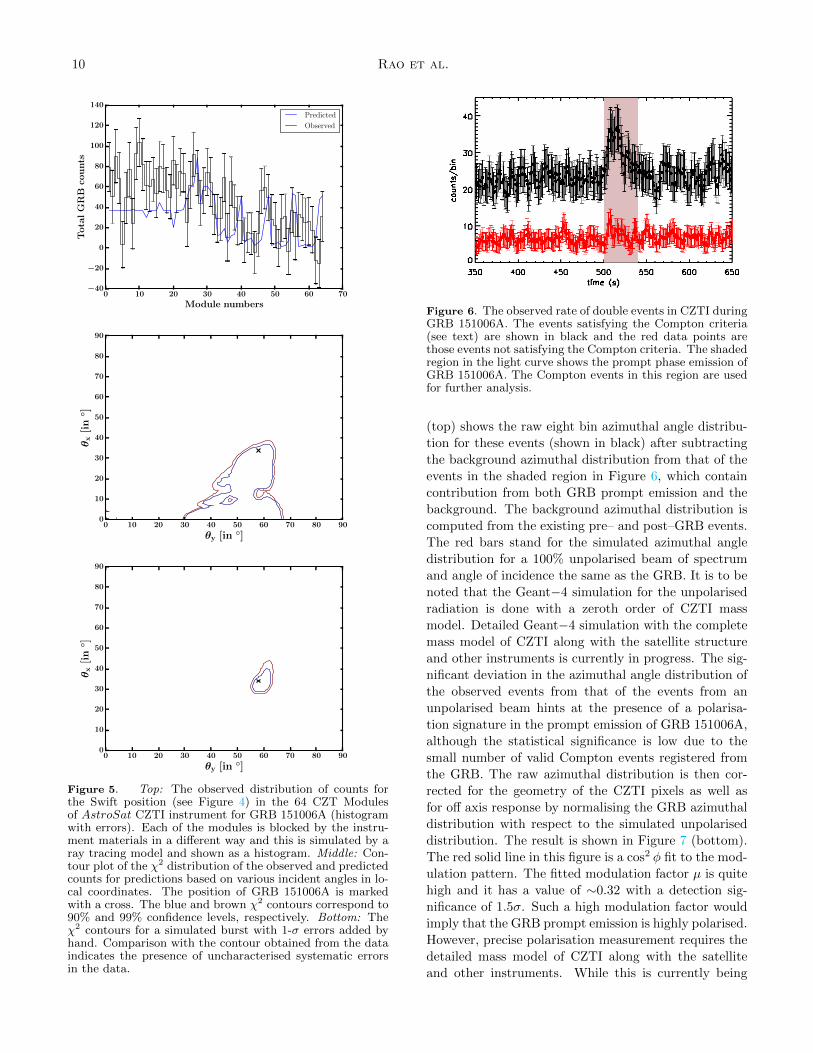
sition of this GRB (see Figure 4) are shown in Figure 5
(top panel) as a continuous line. Over plotted on this
figure are the observed counts. A reasonable agreement
between the two are seen.
To test the localisation capabilities of the CZTI, we
simulated the instrument response in a grid of θx, θycoordinates (see Figure 4) using the spectrum and
8 Rao et al.
Table 3. Swift/BAT + AstroSat/CZTI and Fermi/GBM fit parameters for GRB151006A
Instrument Parameters Band BBPL 2BBPL
BAT + CZTI α/Γ −1.22+0.29−0.18 1.64+0.17
−0.15 1.75+0.37−0.19
Enorm(keV )/Γnorm∗ 100.0 4.0+3.7−1.9 6.00453+15.4
−3.2
Ep/kT1(keV ) 160.26+214.84−67.0 22.1+4.4
−5.4 23.2+3.6−4.3
BBnorm∗ 0.22+0.19−0.14 0.31+0.24
−0.18
β/kT2 −1.8+0.26−0.4 1098+∞
−574
Bandnorm 10−3/BBnorm∗ 4.313.10−1.56 76.7173.4
−86.4
χ2red 1.53 1.52 1.52
GBM α/Γ −1.1+0.2−0.1 1.53+0.06
−0.05 1.5+0.1−0.1
Enorm(keV )/Γnorm∗ 100.0 2.6+0.6−0.5 2.2+1.3
−0.7
Ep/kT1(keV ) 218+126−78 30.0+7.4
−6.3 46+615.4−13
BBnorm∗ 0.3+0.1−0.1 0.5+0.2
−0.3
β/kT2(keV ) −1.8+0.1−0.2 12.6+∞
−3.7
Bandnorm 10−3/BBnorm∗ 5+2−1 0.15+0.3
−0.1
χ2red 0.67 0.7 0.69
∗photons cm−2s−1keV −1
fluence of GRB 151006A. We then binned the counts
by detector, and compared these simulations with the
observed values. The χ2 as a function of local θx, θycoordinates is shown in Figure 5 (middle panel). The
actual position of the GRB is marked with a cross. We
can see that CZTI could have localised this GRB with
an uncertainty of about 10◦. In order to estimate the
contribution of Poisson error to the data, we repeated
the exercise by comparing simulated detector–wisecounts for GRB 151006A from the θx, θy grid with
simulated counts for the true location, and calculating
the χ2 for each direction (Figure 5, bottom panel).
It is seen that CZTI can localise bright GRBs with
an accuracy of a few degrees. The difference between
this idealised case and real data may arise from three
primary effects: a) non-Poissonian errors in the data
due to Cosmic Ray interactions, b) effect of scattering
in the detector material, and c) effects of un–modelled
absorption in other parts of the spacecraft. A full mass
model of the satellite is being prepared and a GEANT-4
simulation for the response of an off-axis GRB is being
carried out to understand these systematics. The
results of this exercise will be reported elsewhere.
3.4. Polarisation
The prompt emission from a GRB is expected to be
highly polarised owing to the non-thermal origin of the
radiation. This is corroborated by the recent findings of
high degree of polarisation in the prompt emission of a
few GRBs by RHESSI, INTEGRAL and GAP (Coburn
& Boggs 2003; McGlynn et al. 2007, 2009; Gotz et al.
2009, 2013; Yonetoku et al. 2011, 2012). The reported
degree of polarisation in the X–ray/gamma-ray band of
the prompt emission are in most cases quite high (60–
80%; see review by Covino & Gotz 2016) and these
are explained in the standard fireball model of GRBs
(Meszaros & Rees 1993) as being due to synchrotron
emission with an uniform magnetic field either carried
by the outflow (Nakar et al. 2003) or locally produced
at the shock (Medvedev 2007). An even higher degree
of polarisation can be produced if the primary radia-
tion mechanism is Compton Drag, i.e., inverse Comp-
ton emission from relativistically outflowing electrons
in the jet (Lazzati et al. 2004). A similar mechanism
operates in the cannonball model (Dado et al. 2007)
which advocates bulk Comptonisation as the primary
source of GRB prompt emission. On the other hand,
evidence of thermal photospheric emission has been re-
ported in many cases of prompt GRB emission (Pe’er
& Ryde 2016). This component, while potentially pro-
viding seed photons for Compton drag, would by itself
contribute little to polarized emission and hence reduce
CZT Imager observations of GRB 151006A 9
Figure 4. A schematic picture of AstroSat showing the local coordinate definition with respect to the CZT Imager instrument.Localisation is calculated in units of θx (θy), angles measured from the Z axis in the ZX (ZY ) planes. The two components ofthe incident direction of GRB 151006A in this coordinate system are indicated.
the overall degree of polarisation.
CZTI can help the study of GRB polarisation by mea-
suring X–ray polarisation in the 100–300 keV range. In
this energy range, CZTI collimators and support struc-
ture are highly transparent. Most of the photons with
these energies undergo Compton scattering in pixels of
CZTI, and the secondary photon is photo–absorbed in a
nearby pixel. The direction of scattering depends on the
degree and direction of polarisation of the source, and
this effect can be exploited to measure source polarisa-
tion (Chattopadhyay et al. 2014; Vadawale et al. 2015).
An additional advantage of CZTI polarimetry is that
the polarisation information can be obtained from the
available raw data in standard mode itself without any
requirement of changing the hardware configuration.
The photons are expected to be preferentially scat-
tered in the direction perpendicular to the polarisation
direction, giving rise to an asymmetry / modulation in
an otherwise flat azimuthal angle distribution. Ampli-
tude of the modulation is directly proportional to the
polarisation fraction embedded in the incident radiation.
True Compton events can be separated from chance
two–pixel events by applying three criteria: 1) spatial
proximity of pixels, 2) temporal coincidence: events
must be recorded within 40 µs of each other8, and 3)
the sum and ratio of deposited energies must be con-
sistent with those expected from true Compton events.
Selection procedure of the Compton events in CZTI has
been discussed in detail in Chattopadhyay et al. (2014).
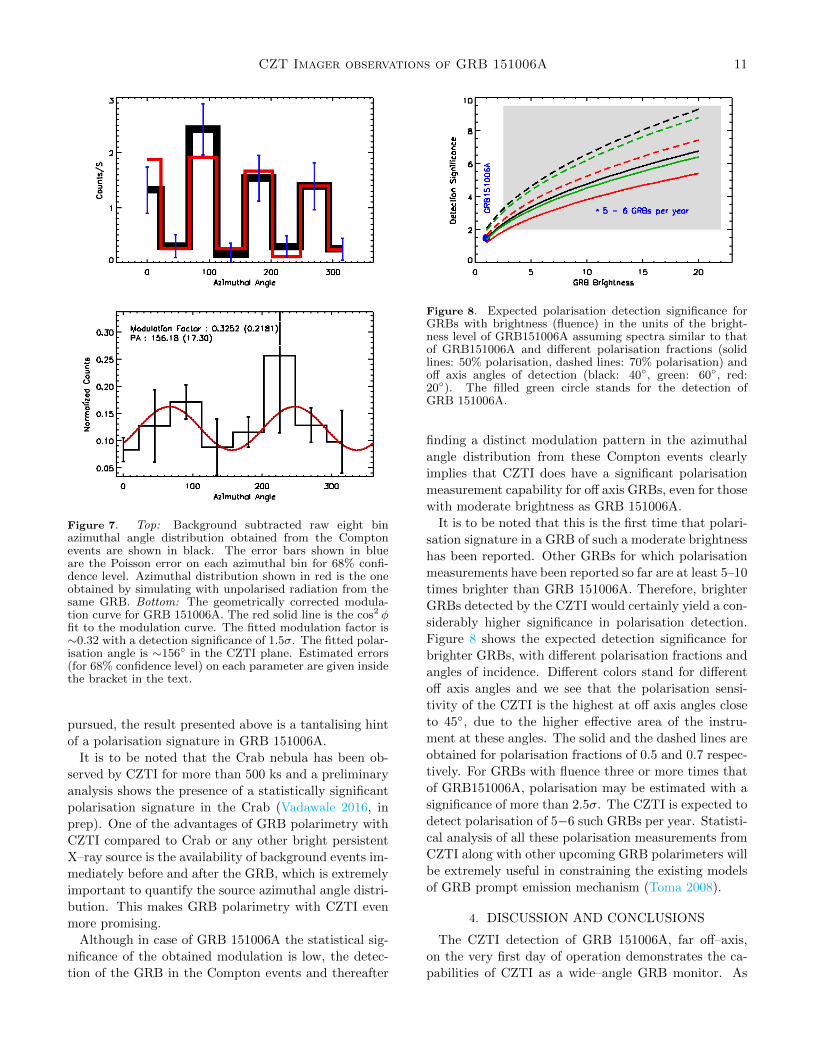
Figure 6 shows the one second light curve (with an
arbitrary time reference) in Compton events (in black
points) for the orbit in which the GRB 151006A was
detected. Clear detection of the GRB in the Comp-
ton events demonstrates the pertinence of the selected
Compton events. Furthermore, if we do not apply
the Compton criteria (means selecting only the non-
neighboring pixels without putting any Compton energy
criteria), the GRB does not show up in the light curve
as shown by the red data points. This gives additional
confidence in the selection of Compton events from the
raw event mode data.
The Compton events in the time window of 34 sec-
onds from the onset of the GRB prompt emission (un-
der the shaded region in Figure 6) are analyzed further
to obtain their azimuthal angle distribution. Figure 7
8 CZTI has a time resolution of 20 µs and we use two clock ticksas the proximity window.
10 Rao et al.
0 10 20 30 40 50 60 70
Module numbers
−40
−20
0
20
40
60
80
100
120
140
Tota
lG
RB
cou
nts
Predicted
Observed
0 10 20 30 40 50 60 70 80 90
θy [in ◦]
0
10
20
30
40
50
60
70
80
90
θx
[in◦ ]
0 10 20 30 40 50 60 70 80 90
θy [in ◦]
0
10
20
30
40
50
60
70
80
90
θx
[in◦ ]
Figure 5. Top: The observed distribution of counts forthe Swift position (see Figure 4) in the 64 CZT Modulesof AstroSat CZTI instrument for GRB 151006A (histogramwith errors). Each of the modules is blocked by the instru-ment materials in a different way and this is simulated by aray tracing model and shown as a histogram. Middle: Con-tour plot of the χ2 distribution of the observed and predictedcounts for predictions based on various incident angles in lo-cal coordinates. The position of GRB 151006A is markedwith a cross. The blue and brown χ2 contours correspond to90% and 99% confidence levels, respectively. Bottom: Theχ2 contours for a simulated burst with 1-σ errors added byhand. Comparison with the contour obtained from the dataindicates the presence of uncharacterised systematic errorsin the data.
Figure 6. The observed rate of double events in CZTI duringGRB 151006A. The events satisfying the Compton criteria(see text) are shown in black and the red data points arethose events not satisfying the Compton criteria. The shadedregion in the light curve shows the prompt phase emission ofGRB 151006A. The Compton events in this region are usedfor further analysis.
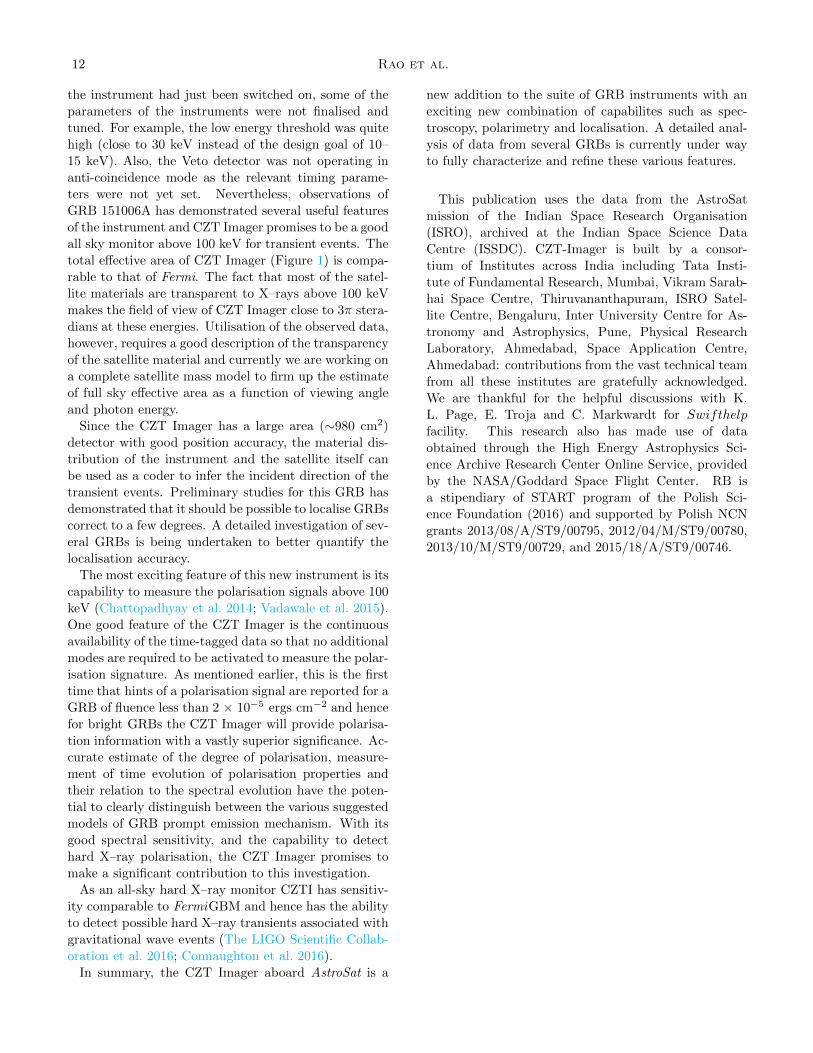
(top) shows the raw eight bin azimuthal angle distribu-
tion for these events (shown in black) after subtracting
the background azimuthal distribution from that of the
events in the shaded region in Figure 6, which contain
contribution from both GRB prompt emission and the
background. The background azimuthal distribution is
computed from the existing pre– and post–GRB events.
The red bars stand for the simulated azimuthal angle
distribution for a 100% unpolarised beam of spectrum
and angle of incidence the same as the GRB. It is to be
noted that the Geant−4 simulation for the unpolarised
radiation is done with a zeroth order of CZTI mass
model. Detailed Geant−4 simulation with the complete
mass model of CZTI along with the satellite structure
and other instruments is currently in progress. The sig-
nificant deviation in the azimuthal angle distribution of
the observed events from that of the events from an
unpolarised beam hints at the presence of a polarisa-
tion signature in the prompt emission of GRB 151006A,
although the statistical significance is low due to the
small number of valid Compton events registered from
the GRB. The raw azimuthal distribution is then cor-
rected for the geometry of the CZTI pixels as well as
for off axis response by normalising the GRB azimuthal
distribution with respect to the simulated unpolarised
distribution. The result is shown in Figure 7 (bottom).
The red solid line in this figure is a cos2 φ fit to the mod-
ulation pattern. The fitted modulation factor µ is quite
high and it has a value of ∼0.32 with a detection sig-
nificance of 1.5σ. Such a high modulation factor would
imply that the GRB prompt emission is highly polarised.
However, precise polarisation measurement requires the
detailed mass model of CZTI along with the satellite
and other instruments. While this is currently being
CZT Imager observations of GRB 151006A 11
Figure 7. Top: Background subtracted raw eight binazimuthal angle distribution obtained from the Comptonevents are shown in black. The error bars shown in blueare the Poisson error on each azimuthal bin for 68% confi-dence level. Azimuthal distribution shown in red is the oneobtained by simulating with unpolarised radiation from thesame GRB. Bottom: The geometrically corrected modula-tion curve for GRB 151006A. The red solid line is the cos2 φfit to the modulation curve. The fitted modulation factor is∼0.32 with a detection significance of 1.5σ. The fitted polar-isation angle is ∼156◦ in the CZTI plane. Estimated errors(for 68% confidence level) on each parameter are given insidethe bracket in the text.
pursued, the result presented above is a tantalising hint
of a polarisation signature in GRB 151006A.
It is to be noted that the Crab nebula has been ob-
served by CZTI for more than 500 ks and a preliminary
analysis shows the presence of a statistically significant
polarisation signature in the Crab (Vadawale 2016, in
prep). One of the advantages of GRB polarimetry with
CZTI compared to Crab or any other bright persistent
X–ray source is the availability of background events im-
mediately before and after the GRB, which is extremely
important to quantify the source azimuthal angle distri-
bution. This makes GRB polarimetry with CZTI even
more promising.
Although in case of GRB 151006A the statistical sig-
nificance of the obtained modulation is low, the detec-
tion of the GRB in the Compton events and thereafter
Figure 8. Expected polarisation detection significance forGRBs with brightness (fluence) in the units of the bright-ness level of GRB151006A assuming spectra similar to thatof GRB151006A and different polarisation fractions (solidlines: 50% polarisation, dashed lines: 70% polarisation) andoff axis angles of detection (black: 40◦, green: 60◦, red:20◦). The filled green circle stands for the detection ofGRB 151006A.
finding a distinct modulation pattern in the azimuthal
angle distribution from these Compton events clearly
implies that CZTI does have a significant polarisation
measurement capability for off axis GRBs, even for those
with moderate brightness as GRB 151006A.
It is to be noted that this is the first time that polari-
sation signature in a GRB of such a moderate brightness
has been reported. Other GRBs for which polarisation
measurements have been reported so far are at least 5–10
times brighter than GRB 151006A. Therefore, brighter
GRBs detected by the CZTI would certainly yield a con-
siderably higher significance in polarisation detection.
Figure 8 shows the expected detection significance for
brighter GRBs, with different polarisation fractions and
angles of incidence. Different colors stand for different
off axis angles and we see that the polarisation sensi-
tivity of the CZTI is the highest at off axis angles close
to 45◦, due to the higher effective area of the instru-
ment at these angles. The solid and the dashed lines are
obtained for polarisation fractions of 0.5 and 0.7 respec-
tively. For GRBs with fluence three or more times that
of GRB151006A, polarisation may be estimated with a
significance of more than 2.5σ. The CZTI is expected to
detect polarisation of 5−6 such GRBs per year. Statisti-
cal analysis of all these polarisation measurements from
CZTI along with other upcoming GRB polarimeters will
be extremely useful in constraining the existing models
of GRB prompt emission mechanism (Toma 2008).
4. DISCUSSION AND CONCLUSIONS
The CZTI detection of GRB 151006A, far off–axis,
on the very first day of operation demonstrates the ca-
pabilities of CZTI as a wide–angle GRB monitor. As
12 Rao et al.
the instrument had just been switched on, some of the
parameters of the instruments were not finalised and
tuned. For example, the low energy threshold was quite
high (close to 30 keV instead of the design goal of 10–
15 keV). Also, the Veto detector was not operating in
anti-coincidence mode as the relevant timing parame-
ters were not yet set. Nevertheless, observations of
GRB 151006A has demonstrated several useful features
of the instrument and CZT Imager promises to be a good
all sky monitor above 100 keV for transient events. The
total effective area of CZT Imager (Figure 1) is compa-
rable to that of Fermi. The fact that most of the satel-
lite materials are transparent to X–rays above 100 keV
makes the field of view of CZT Imager close to 3π stera-
dians at these energies. Utilisation of the observed data,
however, requires a good description of the transparency
of the satellite material and currently we are working on
a complete satellite mass model to firm up the estimate
of full sky effective area as a function of viewing angle
and photon energy.
Since the CZT Imager has a large area (∼980 cm2)
detector with good position accuracy, the material dis-
tribution of the instrument and the satellite itself can
be used as a coder to infer the incident direction of the
transient events. Preliminary studies for this GRB has
demonstrated that it should be possible to localise GRBs
correct to a few degrees. A detailed investigation of sev-
eral GRBs is being undertaken to better quantify the
localisation accuracy.
The most exciting feature of this new instrument is its
capability to measure the polarisation signals above 100
keV (Chattopadhyay et al. 2014; Vadawale et al. 2015).
One good feature of the CZT Imager is the continuous
availability of the time-tagged data so that no additional
modes are required to be activated to measure the polar-
isation signature. As mentioned earlier, this is the first
time that hints of a polarisation signal are reported for a
GRB of fluence less than 2 × 10⁻⁵ ergs cm−2 and hence
for bright GRBs the CZT Imager will provide polarisa-
tion information with a vastly superior significance. Ac-
curate estimate of the degree of polarisation, measure-
ment of time evolution of polarisation properties and
their relation to the spectral evolution have the poten-
tial to clearly distinguish between the various suggested
models of GRB prompt emission mechanism. With its
good spectral sensitivity, and the capability to detect
hard X–ray polarisation, the CZT Imager promises to
make a significant contribution to this investigation.
As an all-sky hard X–ray monitor CZTI has sensitiv-
ity comparable to FermiGBM and hence has the ability
to detect possible hard X–ray transients associated with
gravitational wave events (The LIGO Scientific Collab-
oration et al. 2016; Connaughton et al. 2016).
In summary, the CZT Imager aboard AstroSat is a
new addition to the suite of GRB instruments with an
exciting new combination of capabilites such as spec-
troscopy, polarimetry and localisation. A detailed anal-
ysis of data from several GRBs is currently under way
to fully characterize and refine these various features.
This publication uses the data from the AstroSat
mission of the Indian Space Research Organisation
(ISRO), archived at the Indian Space Science Data
Centre (ISSDC). CZT-Imager is built by a consor-
tium of Institutes across India including Tata Insti-
tute of Fundamental Research, Mumbai, Vikram Sarab-
hai Space Centre, Thiruvananthapuram, ISRO Satel-
lite Centre, Bengaluru, Inter University Centre for As-
tronomy and Astrophysics, Pune, Physical Research
Laboratory, Ahmedabad, Space Application Centre,
Ahmedabad: contributions from the vast technical team
from all these institutes are gratefully acknowledged.
We are thankful for the helpful discussions with K.
L. Page, E. Troja and C. Markwardt for Swifthelp
facility. This research also has made use of data
obtained through the High Energy Astrophysics Sci-
ence Archive Research Center Online Service, provided
by the NASA/Goddard Space Flight Center. RB is
a stipendiary of START program of the Polish Sci-
ence Foundation (2016) and supported by Polish NCN
grants 2013/08/A/ST9/00795, 2012/04/M/ST9/00780,
2013/10/M/ST9/00729, and 2015/18/A/ST9/00746.

CZT Imager observations of GRB 151006A 13
REFERENCES
Atwood, W. B., Abdo, A. A., Ackermann, M., Althouse, W.,
Anderson, B., et al. 2009, ApJ, 697, 1071
Axelsson, M., Baldini, L., Barbiellini, G., Baring, M. G.,Bellazzini, R., et al. 2012, ApJL, 757, L31
Band, D., Matteson, J., Ford, L., Schaefer, B., Palmer, D., et al.
1993, ApJ, 413, 281Band, D. L. 2006, ApJ, 644, 378
Barthelmy, S. D., Barbier, L. M., Cummings, J. R., Fenimore,E. E., Gehrels, N., et al. 2005, SSRv, 120, 143
Basak, R., & Rao, A. R. 2015, ApJ, 812, 156
Bhalerao, V., Bhattacharya, D., Rao, A. R., & Vadawale, S.2015, GRB Coordinates Network, 18422
Bhalerao, V., Bhattacharya, D., Vibhute, A., Pawar, P., Rao,
A. R., et al. 2016, ArXiv e-printsBurgess, J. M., Preece, R. D., Connaughton, V., Briggs, M. S.,
Goldstein, A., et al. 2014, ApJ, 784, 17
Chattopadhyay, T., Vadawale, S. V., Rao, A. R., Bhattacharya,D., Mithun, N. P. S., & Bhalerao, V. 2016, in Proc. SPIE, Vol.
9905, Space Telescopes and Instrumentation 2016: Ultraviolet
to Gamma Ray, 99054DChattopadhyay, T., Vadawale, S. V., Shanmugam, M., & Goyal,
S. K. 2014, ApJS, 212, 12Coburn, W., & Boggs, S. E. 2003, Nature, 423, 415
Connaughton, V., Burns, E., Goldstein, A., Briggs, M. S.,
Zhang, B.-B., et al. 2016, ArXiv e-printsCovino, S., & Gotz, D. 2016, ArXiv e-prints
Dado, S., Dar, A., & De Rujula, A. 2007, ArXiv Astrophysics
e-printsGehrels, N. 2004, in American Institute of Physics Conference
Series, Vol. 727, Gamma-Ray Bursts: 30 Years of Discovery,
ed. E. Fenimore & M. Galassi, 637–641Gehrels, N., & Meszaros, P. 2012, Science, 337, 932
Gehrels, N., Ramirez-Ruiz, E., & Fox, D. B. 2009, ARA&A, 47,
567Goldstein, A., Preece, R. D., Mallozzi, R. S., Briggs, M. S.,
Fishman, G. J., Kouveliotou, C., Paciesas, W. S., & Burgess,
J. M. 2013, ApJS, 208, 21Gotz, D., Covino, S., Fernandez-Soto, A., Laurent, P., &
Bosnjak, Z. 2013, MNRAS, 431, 3550Gotz, D., Laurent, P., Lebrun, F., Daigne, F., & Bosnjak, Z.
2009, ApJL, 695, L208
Gruber, D., Goldstein, A., Weller von Ahlefeld, V., NarayanaBhat, P., Bissaldi, E., et al. 2014, ApJS, 211, 12
Guiriec, S., Connaughton, V., Briggs, M. S., Burgess, M., Ryde,
F., et al. 2011, ApJL, 727, L33Iyyani, S., Ryde, F., Ahlgren, B., Burgess, J. M., Larsson, J.,
et al. 2015, MNRAS, 450, 1651
Kocevski, D., Barthelmy, S. D., Evans, P. A., Page, K. L., &Sbarufatti, B. 2015, GRB Coordinates Network, 18398
Lazzati, D., Rossi, E., Ghisellini, G., & Rees, M. J. 2004,
MNRAS, 347, L1
McGlynn, S., Clark, D. J., Dean, A. J., Hanlon, L., McBreen, S.,
et al. 2007, A&A, 466, 895
McGlynn, S., Foley, S., McBreen, B., Hanlon, L., McBreen, S.,
et al. 2009, A&A, 499, 465
Medvedev, M. V. 2007, Ap&SS, 307, 245
Meegan, C., Lichti, G., Bhat, P. N., Bissaldi, E., Briggs, M. S.,
et al. 2009, ApJ, 702, 791
Meszaros, P., & Rees, M. J. 1993, ApJ, 405, 278
Nakar, E., Piran, T., & Waxman, E. 2003, JCAP, 10, 005
Norris, J. P., Bonnell, J. T., Kazanas, D., Scargle, J. D., Hakkila,
J., & Giblin, T. W. 2005, ApJ, 627, 324
Page, K. L., Starling, R. L. C., Fitzpatrick, G., Pandey, S. B.,
Osborne, J. P., et al. 2011, MNRAS, 416, 2078
Pe’er, A., & Ryde, F. 2016, ArXiv e-prints
Roberts, O. J., & Meegan, C. 2015, GRB Coordinates Network,
18404
Ryde, F. 2005, ApJL, 625, L95
Ryde, F., & Pe’er, A. 2009, ApJ, 702, 1211
Singh, K. P., Tandon, S. N., Agrawal, P. C., Antia, H. M.,
Manchanda, R. K., et al. 2014, in Proc. SPIE, Vol. 9144,
Space Telescopes and Instrumentation 2014: Ultraviolet to
Gamma Ray, 91441S
Sparre, M., & Starling, R. L. C. 2012, MNRAS, 427, 2965
The LIGO Scientific Collaboration, the Virgo Collaboration,
Abbott, B. P., Abbott, R., Abbott, T. D., et al. 2016, ArXiv
e-prints
Toma, K. 2008, in American Institute of Physics Conference
Series, Vol. 1040, American Institute of Physics Conference
Series, ed. H. Kodama & K. Ioka, 186–190
Vadawale, S. V. 2016, in preparation
Vadawale, S. V., Chattopadhyay, T., Rao, A. R., Bhattacharya,
D., Bhalerao, V. B., Vagshette, N., Pawar, P., & Sreekumar, S.
2015, A&A, 578, A73
Vadawale, S. V., Rao, A. R., Bhattacharya, D., Bhalerao, V. B.,
Dewangan, G. C., et al. 2016, in Proc. SPIE, Vol. 9905, Space
Telescopes and Instrumentation 2016: Ultraviolet to Gamma
Ray, 99051F
Yonetoku, D., Murakami, T., Gunji, S., Mihara, T., Toma, K.,
et al. 2011, ApJL, 743, L30
—. 2012, ApJL, 758, L1
Yoshida, A., Sakamoto, T., Takahashi, I., Kawakubo, Y.,
Senuma, K., et al. 2015, GRB Coordinates Network, 18475