dr g raviprasad
TRANSCRIPT
8/6/2019 Dr G Raviprasad
http://slidepdf.com/reader/full/dr-g-raviprasad 1/14
12/16/200
Dr G Raviprasad
5th December, 2009
FAI Annual Seminar,
Hyderabad
India-Present Fertiliser Policy Scenario
• Urea under fully controlled environment:
• Phosphatics: partially decontrolled but state-wise MRPsand allocation is fixed by the Central Government
• Result: Huge difference between international prices of fertilisers and prices to Indian Farmers, and hugewastage of inputs
• Subsidy: 2008-09 we have spent 1 lakh crore onfertiliser subsidy and nevertheless this year also we willbe spending at least half of that
• It will have an adverse impact on the long run
• Discussions are on for a nutrient based subsidy system• We are also talking about giving subsidy directly to
farmers
8/6/2019 Dr G Raviprasad
http://slidepdf.com/reader/full/dr-g-raviprasad 2/14
12/16/200
What is total decontrol?
• A scenario where farmers pay the actualinternational market price of fertilisers. MRP isopen and anybody is free to sell any fertiliser anywhere in india as long as the product is recognisedby Governemnt of India
Scheme of presentation
• Prices of raw material- the trend
• Major fertiliser price trend
• Expected fertilisers price to farmers after decontrol
• The expected consumption of fertilisers afterdecontrol
• The state wise consumption projection afterdecontrol
• The impact on fertliser marketing
• The strategic intervention
8/6/2019 Dr G Raviprasad
http://slidepdf.com/reader/full/dr-g-raviprasad 3/14
12/16/200
5
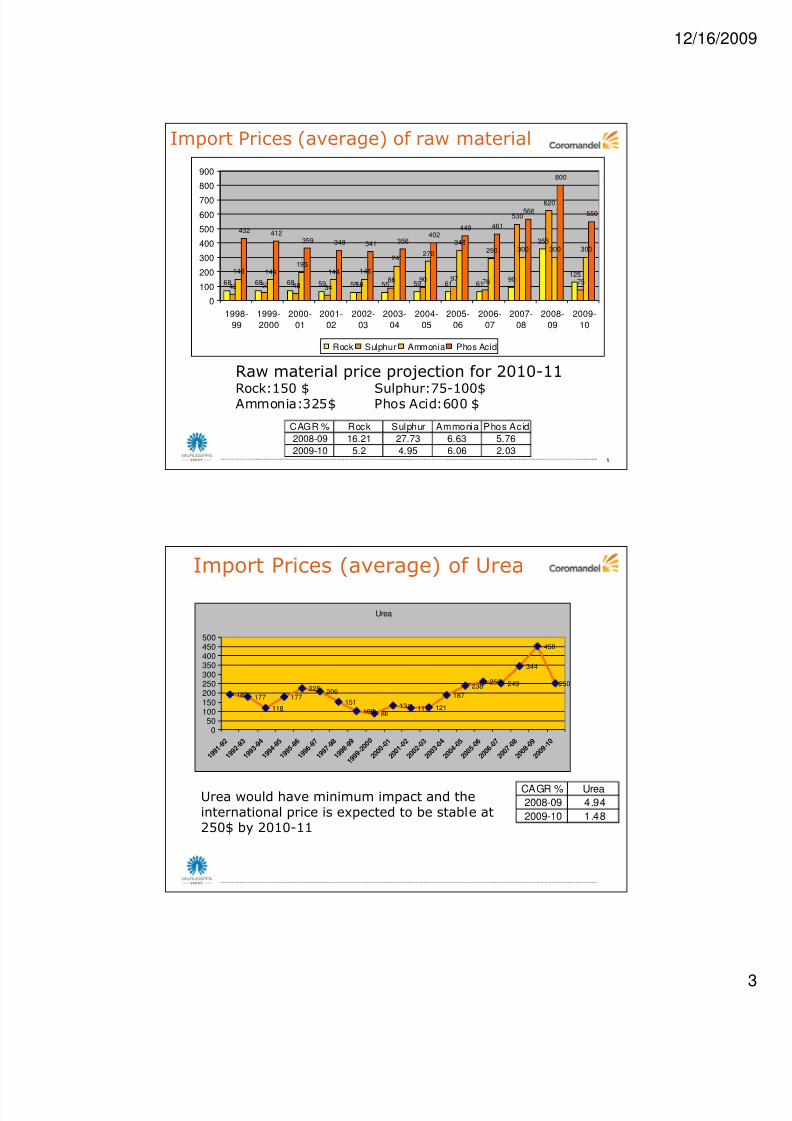
Import Prices (average) of raw material
68 68 68 59 55 55 59 61 6190
355
125
42 52 48 34 5686 90 97 76
530
620
75
148 144195
144 146
241270
348290 300 300 300
432 412359 348 341 356
402449 461
566
800
550
0
100
200
300
400
500
600
700
800
900
1998-
99
1999-
2000
2000-
01
2001-
02
2002-
03
2003-
04
2004-
05
2005-
06
2006-
07
2007-
08
2008-
09
2009-
10
Rock Sulphur Ammonia Phos Acid
Raw material price projection for 2010-11
Rock:150 $ Sulphur:75-100$Ammonia:325$ Phos Acid:600 $
CAGR % Rock Sulphur Ammonia Phos Acid
2008-09 16.21 27.73 6.63 5.76
2009-10 5.2 4.95 6.06 2.03
Import Prices (average) of Urea
Urea
189 177
118
177
225 206
151
100 86131 117 121
187
238259 249
344
450
250
050
100150200250300350400450500
1 9 9 1
- 9 2
1 9 9 2
- 9 3
1 9 9 3
- 9 4
1 9 9 4
- 9 5
1 9 9 5
- 9 6
1 9 9 6
- 9 7
1 9 9 7
- 9 8
1 9 9 8
- 9 9
1 9 9 9
- 2 0 0
0
2 0 0 0
- 0 1
2 0 0 1
- 0 2
2 0 0 2
- 0 3
2 0 0 3
- 0 4
2 0 0 4
- 0 5
2 0 0 5
- 0 6
2 0 0 6
- 0 7
2 0 0 7
- 0 8
2 0 0 8
- 0 9
2 0 0 9
- 1 0
Urea would have minimum impact and theinternational price is expected to be stable at250$ by 2010-11
CAGR % Urea2008-09 4.94
2009-10 1.48
8/6/2019 Dr G Raviprasad
http://slidepdf.com/reader/full/dr-g-raviprasad 4/14
12/16/200
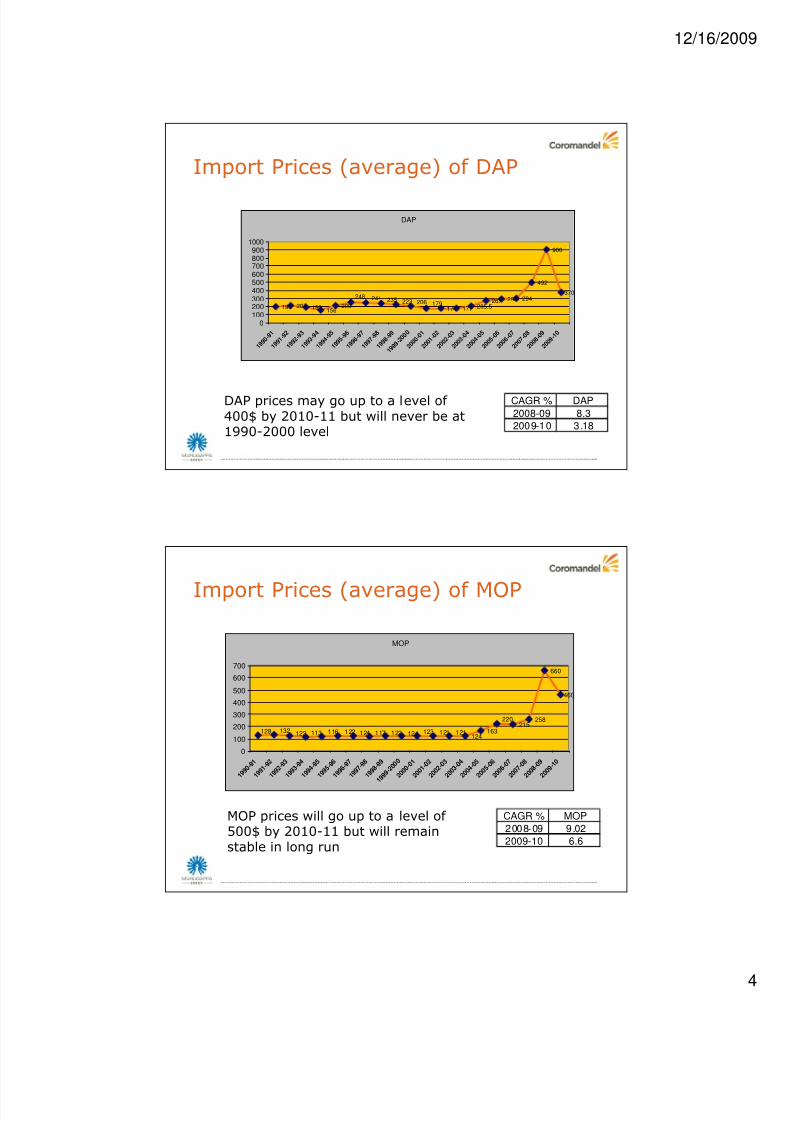
Import Prices (average) of DAP
DAP
198 207 190 156209 174 177 205.5
267 290 294
492
900
370
179206223235241248
0
100
200
300
400
500
600
700
800
900
1000
1 9 9 0
- 9 1
1 9 9 1
- 9 2
1 9 9 2
- 9 3
1 9 9 3
- 9 4
1 9 9 4
- 9 5
1 9 9 5
- 9 6
1 9 9 6
- 9 7
1 9 9 7
- 9 8
1 9 9 8
- 9 9
1 9 9 9
- 2 0 0
0
2 0 0 0
- 0 1
2 0 0 1
- 0 2
2 0 0 2
- 0 3
2 0 0 3
- 0 4
2 0 0 4
- 0 5
2 0 0 5
- 0 6
2 0 0 6
- 0 7
2 0 0 7
- 0 8
2 0 0 8
- 0 9
2 0 0 9
- 1 0
DAP prices may go up to a level of 400$ by 2010-11 but will never be at1990-2000 level
CAGR % DAP
2008-09 8.3
2009-10 3.18
Import Prices (average) of MOP
MOP
124163
215258
660
460
128 132122 113 116 122 124 117 122 124 123 121 121
220
0
100
200
300
400
500
600
700
1 9 9 0
- 9 1
1 9 9 1
- 9 2
1 9 9 2
- 9 3
1 9 9 3
- 9 4
1 9 9 4
- 9 5
1 9 9 5
- 9 6
1 9 9 6
- 9 7
1 9 9 7
- 9 8
1 9 9 8
- 9 9
1 9 9 9
- 2 0 0
0
2 0 0 0
- 0 1
2 0 0 1
- 0 2
2 0 0 2
- 0 3
2 0 0 3
- 0 4
2 0 0 4
- 0 5
2 0 0 5
- 0 6
2 0 0 6
- 0 7
2 0 0 7
- 0 8
2 0 0 8
- 0 9
2 0 0 9
- 1 0
MOP prices will go up to a level of 500$ by 2010-11 but will remainstable in long run
CAGR % MOP
2008-09 9.02
2009-10 6.6
8/6/2019 Dr G Raviprasad
http://slidepdf.com/reader/full/dr-g-raviprasad 5/14
12/16/200
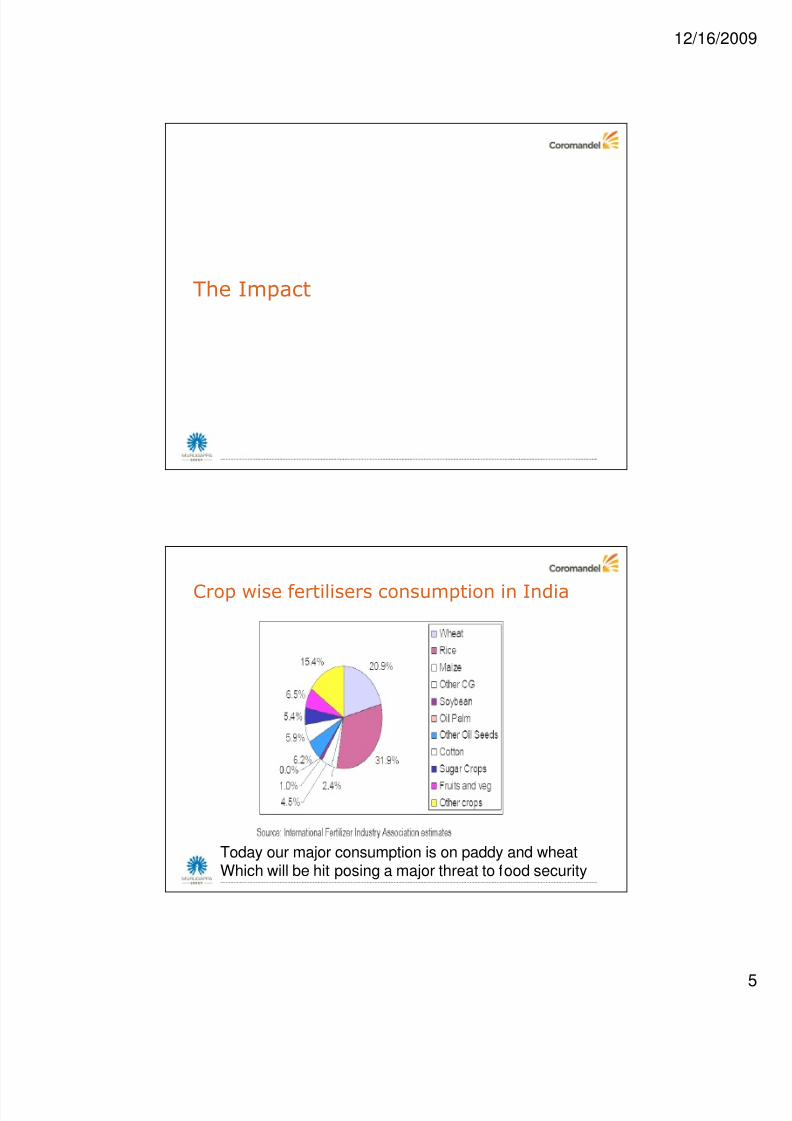
The Impact
Crop wise fertilisers consumption in India
Today our major consumption is on paddy and wheatWhich will be hit posing a major threat to food security
8/6/2019 Dr G Raviprasad
http://slidepdf.com/reader/full/dr-g-raviprasad 6/14
12/16/200
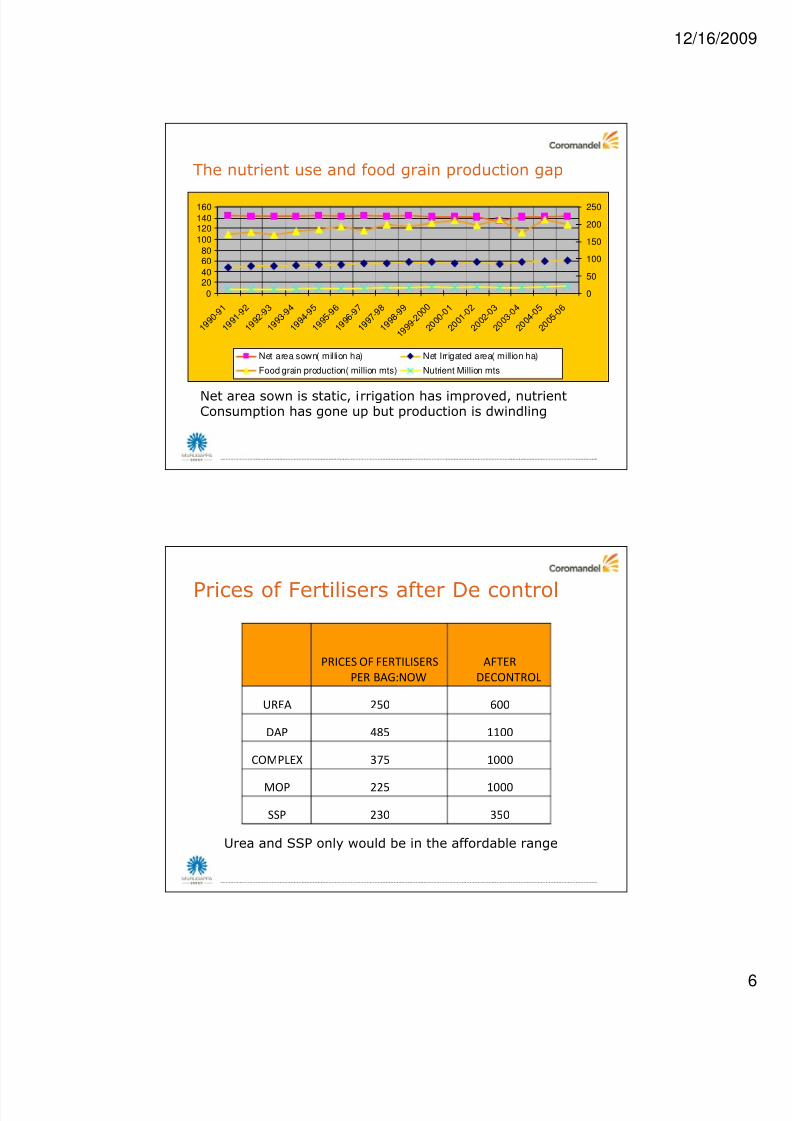
The nutrient use and food grain production gap
0
2040
6080
100
120140
160
1 9 9 0
- 9 1
1 9 9 1
- 9 2
1 9 9 2
- 9 3
1 9 9 3
- 9 4
1 9 9 4
- 9 5
1 9 9 5
- 9 6
1 9 9 6
- 9 7
1 9 9 7
- 9 8
1 9 9 8
- 9 9
1 9 9 9
- 2 0 0
0
2 0 0 0
- 0 1
2 0 0 1
- 0 2
2 0 0 2
- 0 3
2 0 0 3
- 0 4
2 0 0 4
- 0 5
2 0 0 5
- 0 6
0
50
100
150
200
250
Net area sown( million ha) Net Irrigated area( million ha)
Food grain production( million mts) Nutrient Million mts
Net area sown is static, irrigation has improved, nutrientConsumption has gone up but production is dwindling
Prices of Fertilisers after De control
PRICES OF FERTILISERS
PER BAG:NOW
AFTER
DECONTROL
UREA 250 600
DAP 485 1100
COMPLEX 375 1000
MOP 225 1000
SSP 230 350
Urea and SSP only would be in the affordable range
8/6/2019 Dr G Raviprasad
http://slidepdf.com/reader/full/dr-g-raviprasad 7/14
12/16/200
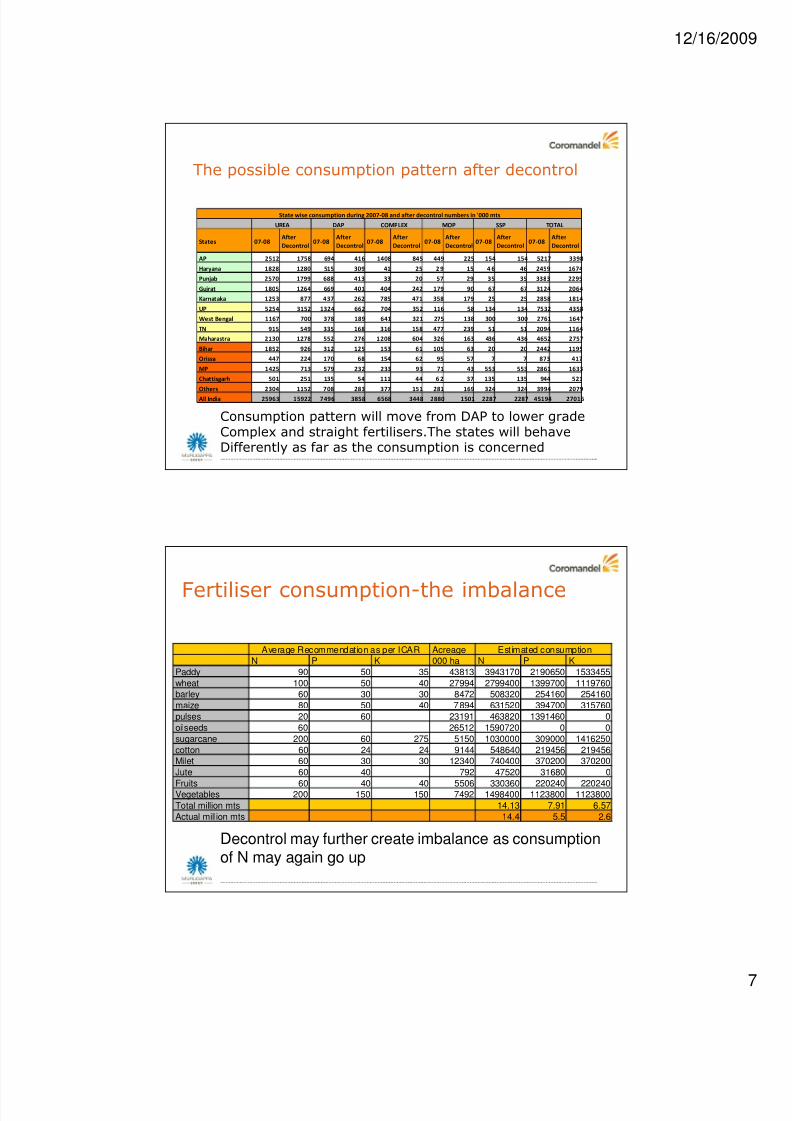
The possible consumption pattern after decontrol
States 07-08After
Decontrol07-08
After
Decontrol07-08
After
Decontrol07-08
After
Decontrol07-08
After
Decontrol07-08
After
Decontrol
AP 2512 1758 694 416 1408 845 449 225 154 154 5217 3398
Haryana 1828 1280 515 309 41 25 2 9 15 4 6 46 2459 1674
Punjab 2570 1799 688 413 33 20 57 29 35 35 3383 2295
Gujrat 1805 1264 669 401 404 242 179 90 67 67 3124 2064
Karnataka 1253 877 437 262 785 471 358 179 25 25 2858 1814
UP 5254 3152 1324 662 704 352 116 58 134 134 7532 4358
West Bengal 1167 700 378 189 641 321 275 138 300 300 2761 1647
TN 915 549 335 168 316 158 477 239 51 51 2094 1164
Maharastra 2130 1278 552 276 1208 604 326 163 436 436 4652 2757
Bihar 1852 926 312 125 153 61 105 63 20 20 2442 1195
Orissa 447 224 170 68 154 62 95 57 7 7 873 417
MP 1425 713 579 232 233 93 71 43 553 553 2861 1633
Chattisgarh 501 251 135 54 111 44 6 2 37 135 135 944 521
Others 2304 1152 708 283 377 151 281 169 324 324 3994 2079
All India 25963 15922 7496 3858 6568 3448 2880 1501 2287 2287 45194 27016
SSP TOTAL
State wise consumption during 2007-08 and after decontrol numbers in '000 mts
UREA DAP COMPLEX MOP
Consumption pattern will move from DAP to lower gradeComplex and straight fertilisers.The states will behaveDifferently as far as the consumption is concerned
Fertiliser consumption-the imbalance
Acreage
N P K 000 ha N P K
Paddy 90 50 35 43813 3943170 2190650 1533455
wheat 100 50 40 27994 2799400 1399700 1119760
barley 60 30 30 8472 508320 254160 254160
maize 80 50 40 7894 631520 394700 315760
pulses 20 60 23191 463820 1391460 0
oilseeds 60 26512 1590720 0 0
sugarcane 200 60 275 5150 1030000 309000 1416250
cotton 60 24 24 9144 548640 219456 219456
Milet 60 30 30 12340 740400 370200 370200
Jute 60 40 792 47520 31680 0
Fruits 60 40 40 5506 330360 220240 220240Vegetables 200 150 150 7492 1498400 1123800 1123800
Total million mts 14.13 7.91 6.57
Actual million mts 14.4 5.5 2.6
Average Recommendation as per ICAR Estimated consumption
Decontrol may further create imbalance as consumptionof N may again go up
8/6/2019 Dr G Raviprasad
http://slidepdf.com/reader/full/dr-g-raviprasad 8/14
12/16/200
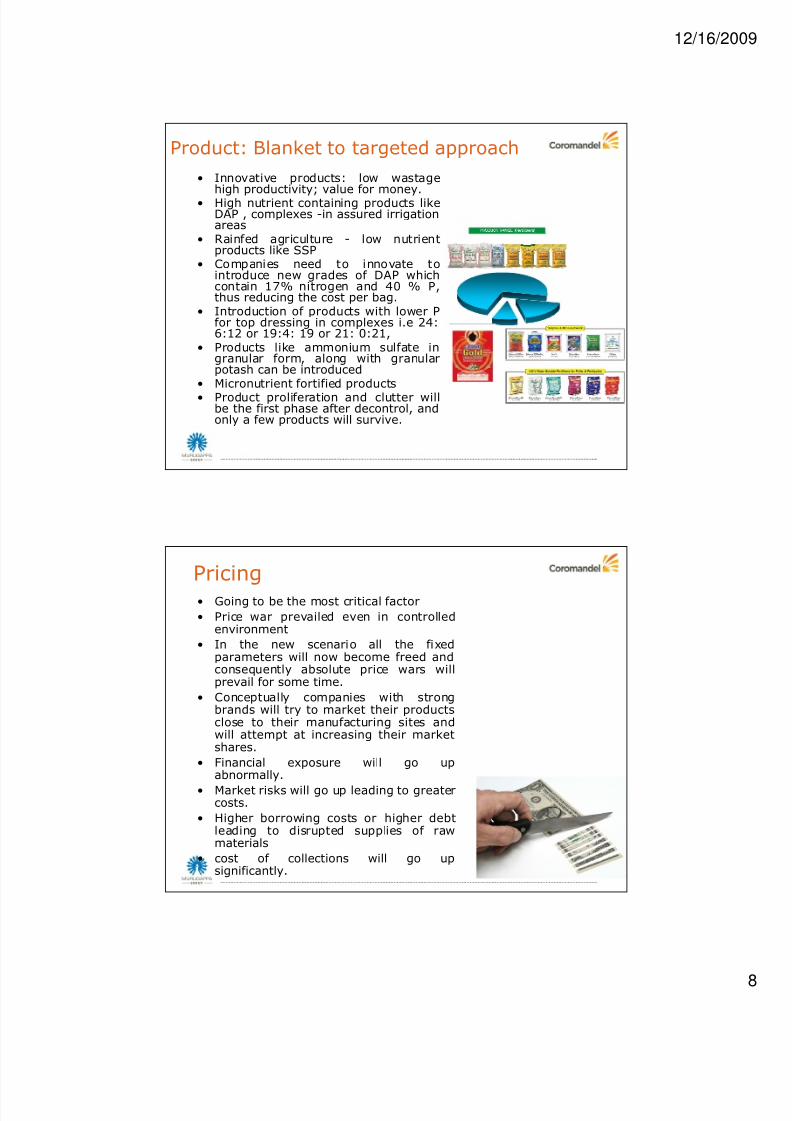
Product: Blanket to targeted approach
• Innovative products: low wastagehigh productivity; value for money.
• High nutrient containing products likeDAP , complexes -in assured irrigationareas
• Rainfed agriculture - low nutrientproducts like SSP
• Companies need to innovate tointroduce new grades of DAP whichcontain 17% nitrogen and 40 % P,thus reducing the cost per bag.
• Introduction of products with lower Pfor top dressing in complexes i.e 24:6:12 or 19:4: 19 or 21: 0:21,
• Products like ammonium sulfate ingranular form, along with granularpotash can be introduced
• Micronutrient fortified products• Product proliferation and clutter will
be the first phase after decontrol, andonly a few products will survive.
Pricing• Going to be the most critical factor
• Price war prevailed even in controlledenvironment
• In the new scenario all the fixedparameters will now become freed andconsequently absolute price wars willprevail for some time.
• Conceptually companies with strongbrands will try to market their productsclose to their manufacturing sites andwill attempt at increasing their marketshares.
• Financial exposure will go upabnormally.
• Market risks will go up leading to greatercosts.
• Higher borrowing costs or higher debtleading to disrupted supplies of rawmaterials
• cost of collections will go upsignificantly.
8/6/2019 Dr G Raviprasad
http://slidepdf.com/reader/full/dr-g-raviprasad 9/14
12/16/200
Distribution
• companies have to come together tosurvive post decontrol and streamlinetheir distribution set up.
• Distant markets will not be servicedby companies.
• Therefore the real aspect of productexchange has to be adoptedwhereby; companies will beproducing two or more brands fromthe same location, leading to shared
marketing concepts.
Imports
• Imports will play a key role,from the point of pricing andavailability.
• Once availability increases anddemand comes downautomatically, pricing pressureswill enter the matrix upsettingthe equilibrium.
• Mature companies will be able tobalance
• Imports will always be used bythe government to bridgedemand supply gaps in specificareas or at specific times so thatindustry does not profitabnormally.
8/6/2019 Dr G Raviprasad
http://slidepdf.com/reader/full/dr-g-raviprasad 10/14
12/16/200
Market Development
• Chaotic scenario in the field since allcompanies would be anxious to create brandpull
• This will have serious backlash and thecustomer I,e the farmer will be left withoutany direction ,and the products andstrategies will be less understood .
• Buying behaviour of farmers will drasticallychange and the entire consumer behaviourwill need to be revisited.
• As the issues evolve solutions will be
emerging, and time alone will be a witnessto all changes.
Strategic intervention
8/6/2019 Dr G Raviprasad
http://slidepdf.com/reader/full/dr-g-raviprasad 11/14
12/16/200
Product to Solutions
• Till now the fertiliser application is based on certainavailable grades in the market and farmers go forblanket application
• Currently grades and brands are region specific
• In total decontrol, the sale of fertilisers will besubstituted with total nutrient solutions.
• Micronutrient fortified fertilisers, customized fertilisers,water soluble fertilisers, bio fertilizers, organic fertilizersetc will be marketed to provide comprehensive nutrientsolutions which are cost effective.
• In fact the traditional 50 kg, bag may be replaced bydosages per acre and they may be stage and location
specific.
Understanding customer behaviour
• Present cost of fertilisers: 30 to 40 % of the total cost
• After decontrol: economics comes ahead0f added benefits or aesthetics
• The increased cost of fertilisers can resultin two activities.– Reduced chemical fertilizer application
:poor food grain output.– apply the cheapest: imbalanced
chemical nutrition• Dealer now loses his ability to influence
and the focus shifts to farmers• Companies will revive extension
programmes.• Crop productivity will become a key
rallying point and use of macro, micro andtrace elements will set in.
• Soil analysis, crop husbandry, correctplant nutrition, appropriate plantprotection and mechanization will be thebuzz words.
8/6/2019 Dr G Raviprasad
http://slidepdf.com/reader/full/dr-g-raviprasad 12/14
12/16/200
Product versatility
• Companies with versatile product offerings will have an edge• Companies with a single product will cease to exist or partner
with bigger ones.• Business will no more be volume driven but versatility and
value driven.• Companies that offer total plant nutrition will score• Organic products, high concentrate fertilisers, micronutrients,
low grade fertilisers, plant protection chemicals, specialties,mechanization, retail etc will come into picture
• Price becomes a critical factor,• Farmers in rainfed areas will opt for cheaper nutrient bags like
SSP, low grade complexes and compost rather than opting forhigh grade fertilisers.
• Rainfall and precipitation will also decide the type of fertilizerused.
• If monsoon is on time and good the farmer will try using highconcentrate fertilisers like DAP,
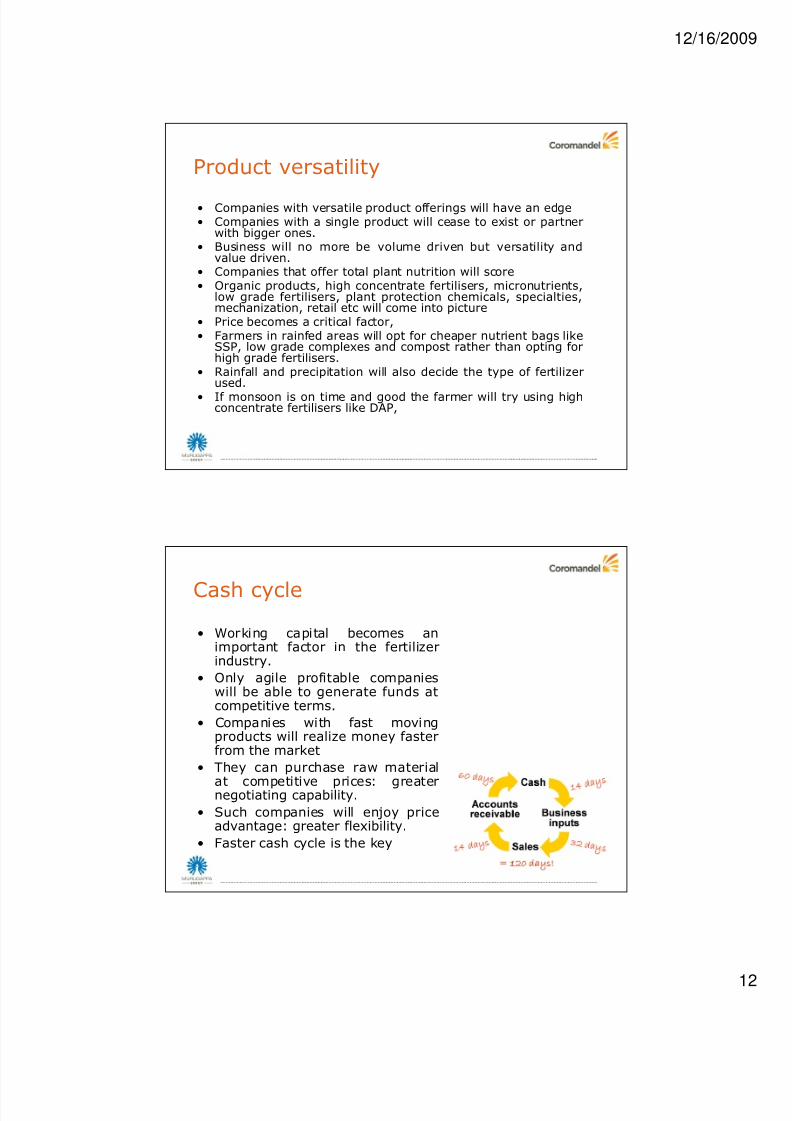
Cash cycle
• Working capital becomes animportant factor in the fertilizerindustry.
• Only agile profitable companieswill be able to generate funds atcompetitive terms.
• Companies with fast movingproducts will realize money fasterfrom the market
• They can purchase raw material
at competitive prices: greaternegotiating capability.
• Such companies will enjoy priceadvantage: greater flexibility.
• Faster cash cycle is the key
8/6/2019 Dr G Raviprasad
http://slidepdf.com/reader/full/dr-g-raviprasad 13/14
12/16/200
Human Resource
• The days of completing sales atrail heads or offices will come toan end
• Crop stage, prices of output,irrigation, competitor stock,brand strength, publicitycampaigns have all to bestudied and marketingpersonnel have to increase theirlevel of contact with farmers.
• Marketing will assume a more
significant role as it becomesthe single fund raising source
competition
• Competition from emergingtechnologies: GM crops, enzyme basedproducts, seaweed based products andmany more.
• All input companies will compete for ashare in farmers wallet.
• Products using recombinant DNA routepromising fixing atmospheric nitrogen,phosphorous releasing bacteria/products, low grade potash will allenter
• From competition, companies have toadopt cooptetion
• Agility and alacrity will be the key• nutrition revolution should happen
after the long cherished greenrevolution
8/6/2019 Dr G Raviprasad
http://slidepdf.com/reader/full/dr-g-raviprasad 14/14
12/16/200
Market Development
• Current methods like wall paintings, trolley paintings,hoardings etc can no longer survive in isolation: needfor integrated communication.
• Targeted and relationship marketing will prove to be thecutting edge
• Data about farmers, size of holdings, crops cultivated,irrigation source etc will gain importance.
• Call centers will form an important farmer touch point
• Decision support systems will also be used toguaranteed yield if farmers subscribe.
• Training programmes will be more holistic and will aimat improved crop productivity rather than disjointed
bursts of product advertisement.
28
www.coromandel.biz