indianagriculture a snapshot
TRANSCRIPT

8/11/2019 IndianAgriculture a Snapshot
http://slidepdf.com/reader/full/indianagriculture-a-snapshot 1/89
Confidential- For Kagashin clients onlyMay, 2014
The Difference Between Information & Knowledge
8/11/2019 IndianAgriculture a Snapshot
http://slidepdf.com/reader/full/indianagriculture-a-snapshot 2/89
INDIAN AGRICULTURE
Confidential- For Kagashin clients onlyMay, 2014
8/11/2019 IndianAgriculture a Snapshot
http://slidepdf.com/reader/full/indianagriculture-a-snapshot 3/89
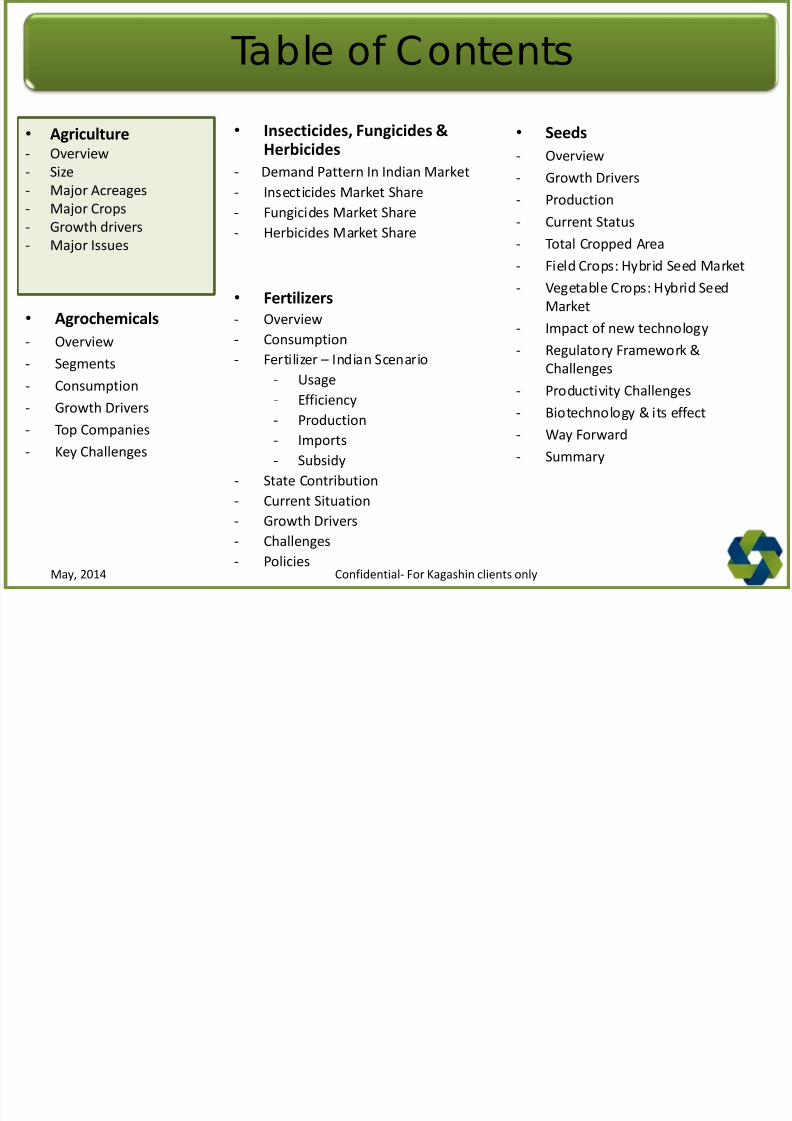
Table of Contents
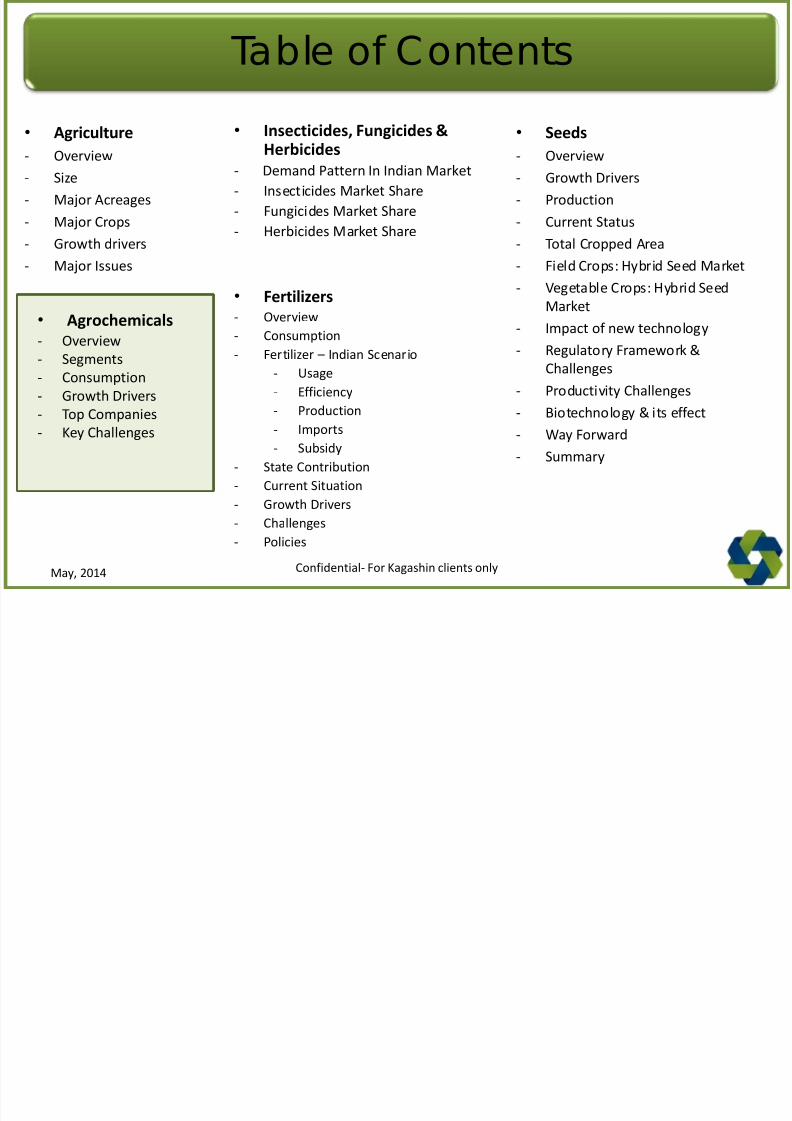
• Agrochemicals
- Overview
- Segments
- Consumption
- Growth Drivers- Top Companies
- Key Challenges
• Insecticides, Fungicides &Herbicides
- Demand Pattern In Indian Market
- Insecticides Market Share
- Fungicides Market Share
- Herbicides Market Share
• Fertilizers
- Overview
- Consumption
- Fertilizer – Indian Scenario
- Usage
- Efficiency
- Production
- Imports
- Subsidy
- State Contribution
- Current Situation
- Growth Drivers
- Challenges
- Policies
• Seeds- Overview
- Growth Drivers
- Production
- Current Status
- Total Cropped Area
- Field Crops: Hybrid Seed Market
- Vegetable Crops: Hybrid Seed
Market
- Impact of new technology
- Regulatory Framework &
Challenges
- Productivity Challenges
- Biotechnology & its effect- Way Forward
- Summary
• Agriculture- Overview
- Size
- Major Acreages
- Major Crops
- Growth drivers
- Major Issues
Confidential- For Kagashin clients onlyMay, 2014
8/11/2019 IndianAgriculture a Snapshot
http://slidepdf.com/reader/full/indianagriculture-a-snapshot 4/89
K e y
S t a t i s t
i c s
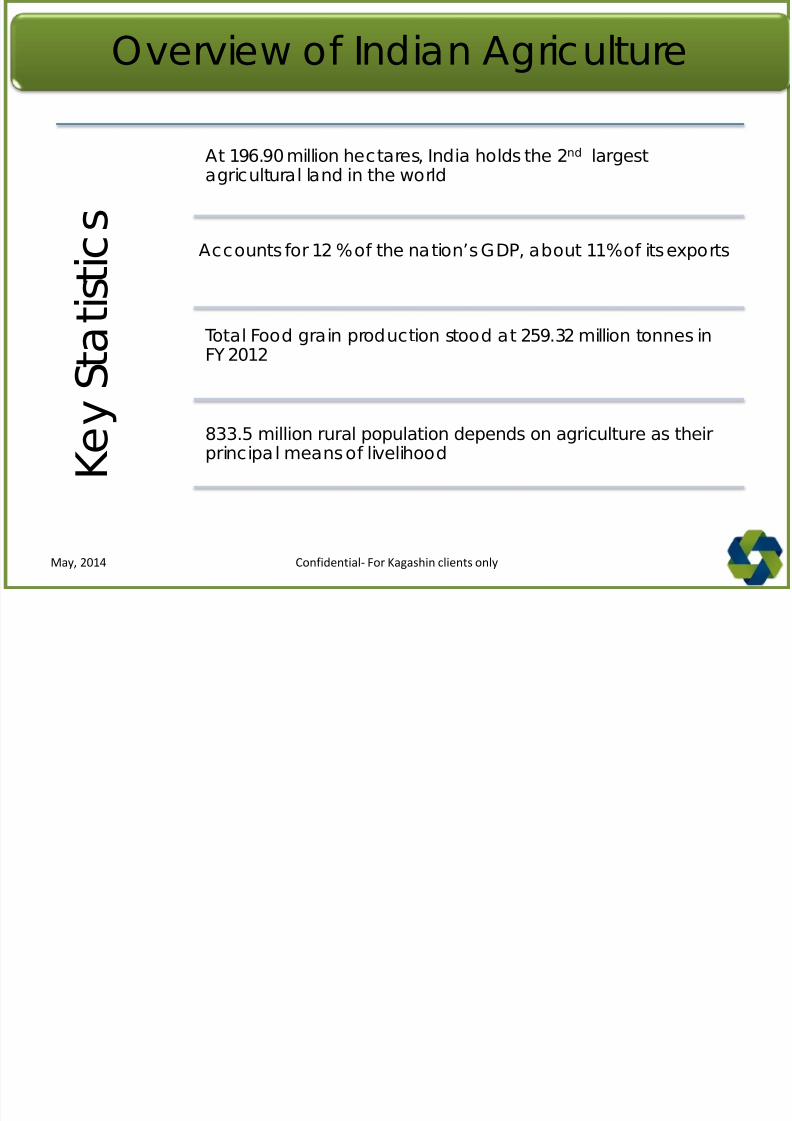
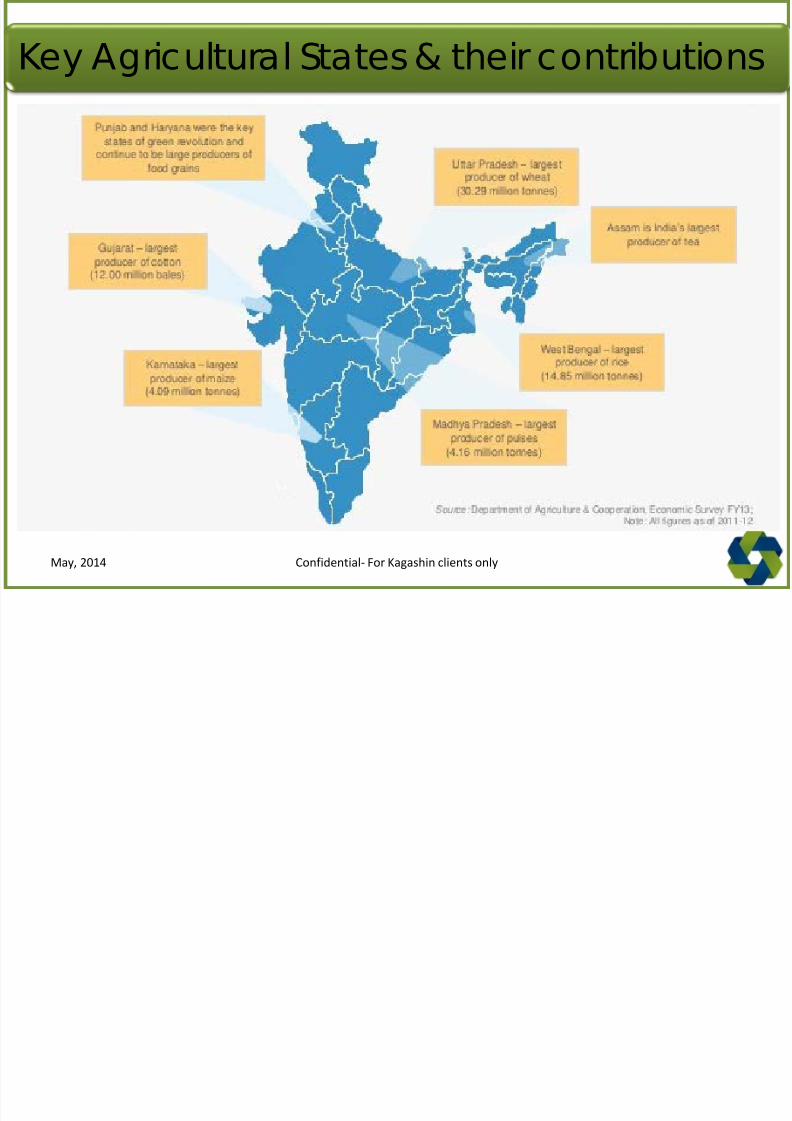
At 196.90 million hectares, India holds the 2nd largestagricultural land in the world
Accounts for 12 % of the nation’s GDP, about 11% of its exports
Total Food grain production stood at 259.32 million tonnes inFY 2012
833.5 million rural population depends on agriculture as theirprincipal means of livelihood
Overview of Indian Agriculture
Confidential- For Kagashin clients onlyMay, 2014
8/11/2019 IndianAgriculture a Snapshot
http://slidepdf.com/reader/full/indianagriculture-a-snapshot 5/89
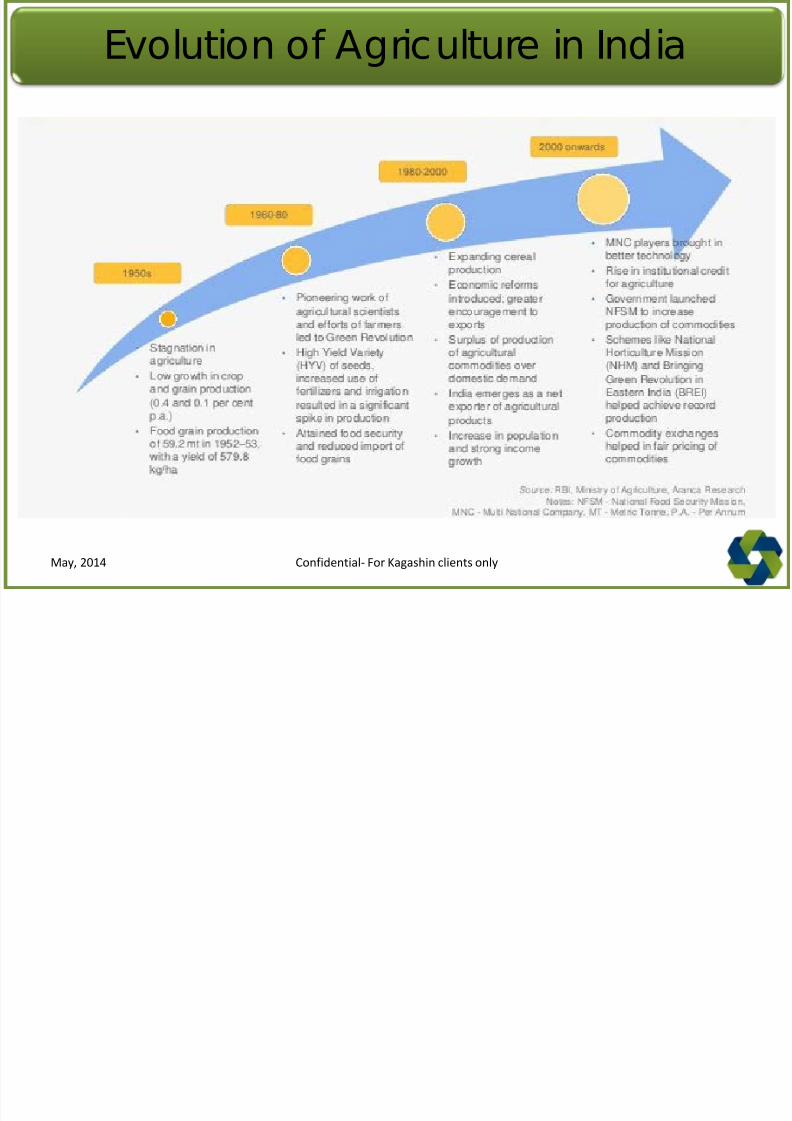
Evolution of Agriculture in India
Confidential- For Kagashin clients onlyMay, 2014
8/11/2019 IndianAgriculture a Snapshot
http://slidepdf.com/reader/full/indianagriculture-a-snapshot 6/89
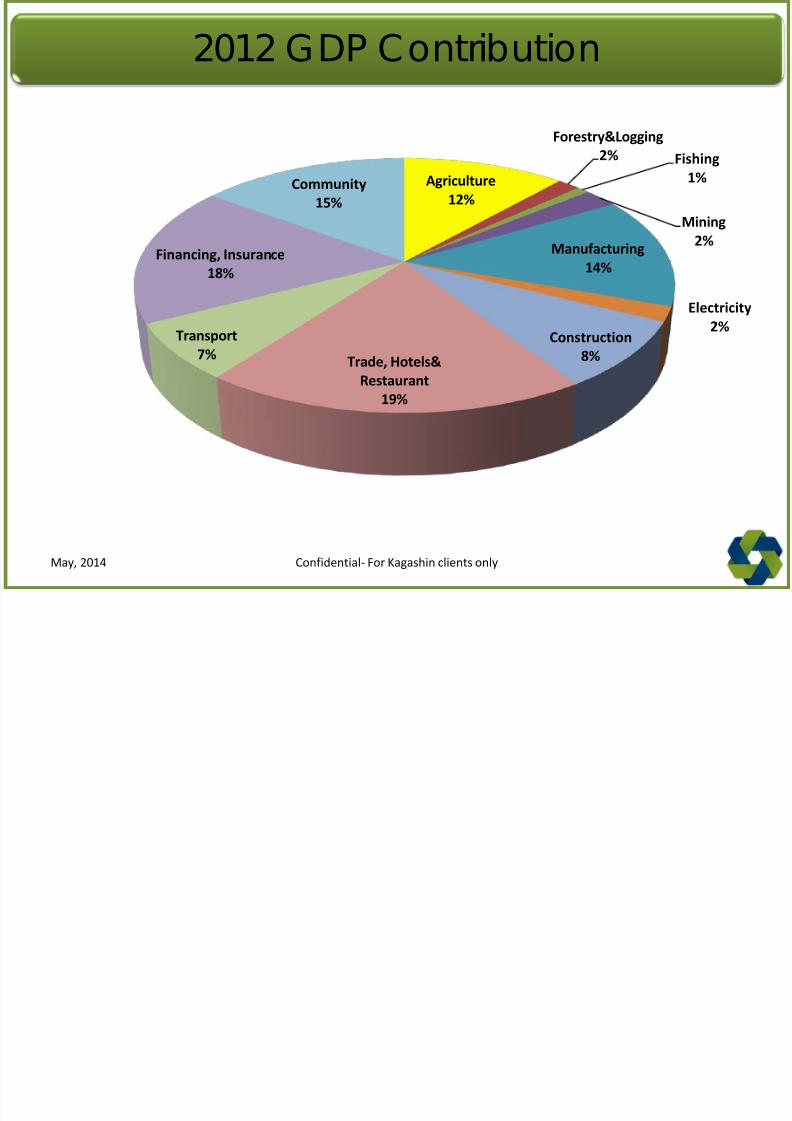
2012 GDP Contribution
Confidential- For Kagashin clients onlyMay, 2014
Agriculture
12%
Forestry&Logging2% Fishing
1%
Mining
2%Manufacturing
14%
Electricity
2%Construction
8%Trade, Hotels&
Restaurant
19%
Transport
7%
Financing, Insurance
18%
Community
15%
8/11/2019 IndianAgriculture a Snapshot
http://slidepdf.com/reader/full/indianagriculture-a-snapshot 7/89
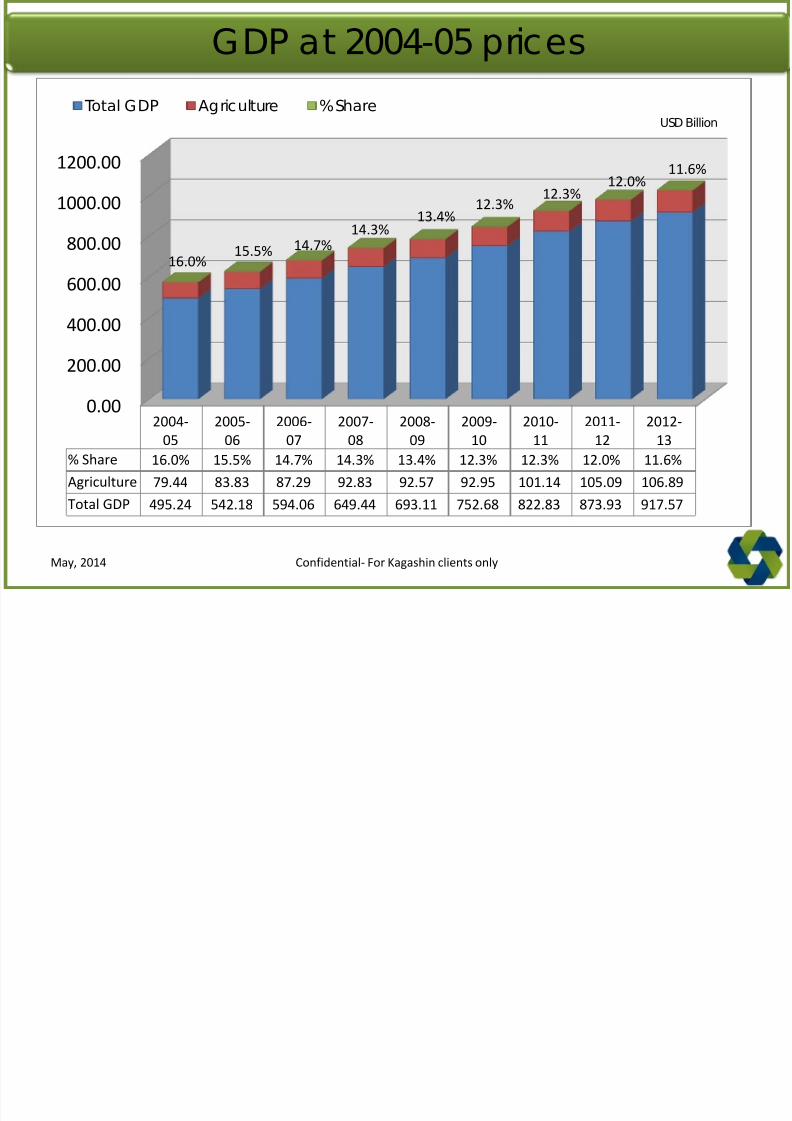
GDP at 2004-05 prices
0.00
200.00
400.00
600.00
800.00
1000.00
1200.00
2004-
05
2005-
06
2006-
07
2007-
08
2008-
09
2009-
10
2010-
11
2011-
12
2012-
13
% Share 16.0% 15.5% 14.7% 14.3% 13.4% 12.3% 12.3% 12.0% 11.6%
Agriculture 79.44 83.83 87.29 92.83 92.57 92.95 101.14 105.09 106.89
Total GDP 495.24 542.18 594.06 649.44 693.11 752.68 822.83 873.93 917.57
16.0%15.5% 14.7%
14.3%13.4%
12.3%12.3%
12.0%11.6%
Total GDP Agriculture % ShareUSD Billion
Confidential- For Kagashin clients onlyMay, 2014
8/11/2019 IndianAgriculture a Snapshot
http://slidepdf.com/reader/full/indianagriculture-a-snapshot 8/89
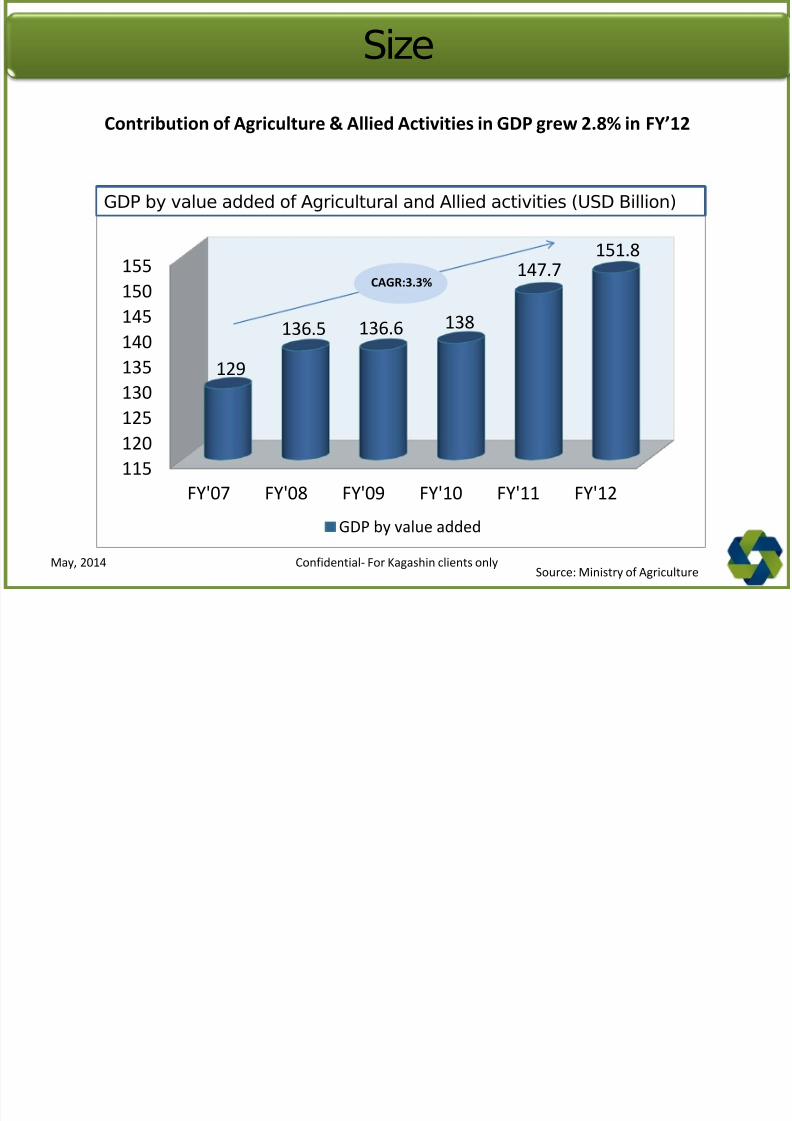
Size
115
120125
130
135
140
145
150
155
FY'07 FY'08 FY'09 FY'10 FY'11 FY'12
129
136.5 136.6 138
147.7
151.8
GDP by value added
CAGR:3.3%
Contribution of Agriculture & Allied Activities in GDP grew 2.8% in FY’12
GDP by value added of Agricultural and Allied activities (USD Billion)
Source: Ministry of AgricultureConfidential- For Kagashin clients onlyMay, 2014
8/11/2019 IndianAgriculture a Snapshot
http://slidepdf.com/reader/full/indianagriculture-a-snapshot 9/89
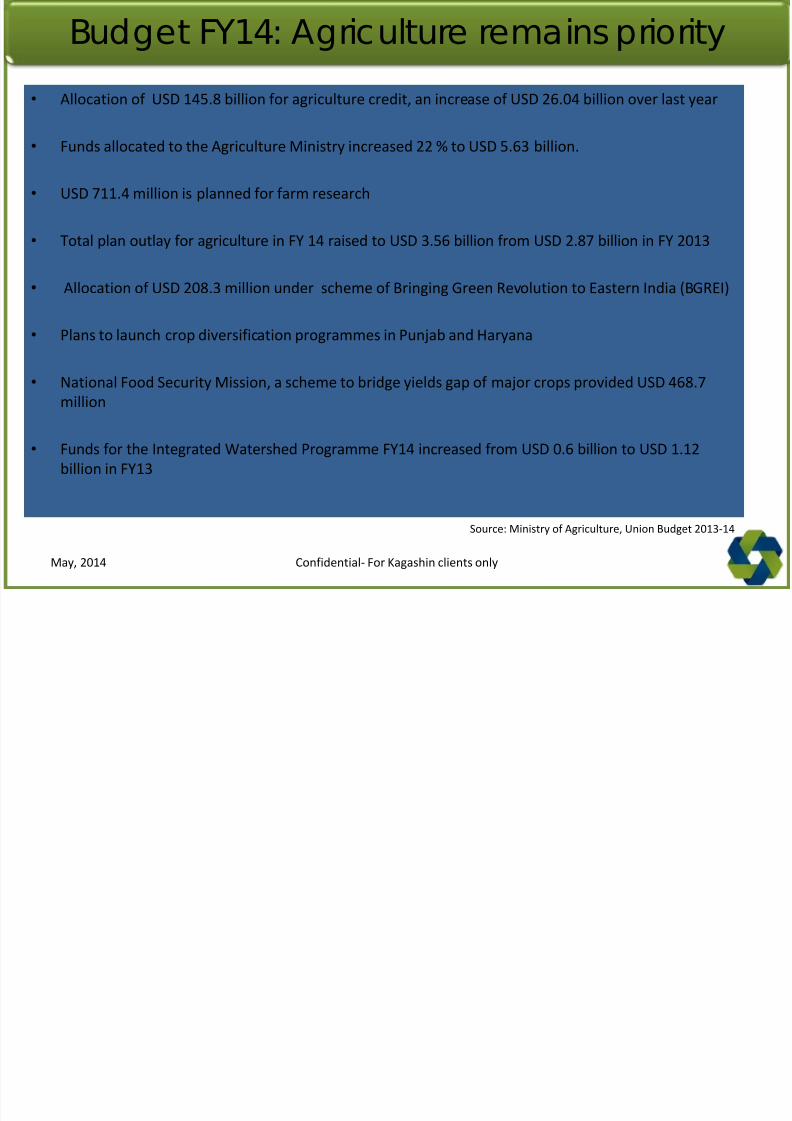
Budget FY14: Agriculture remains priority
• Allocation of USD 145.8 billion for agriculture credit, an increase of USD 26.04 billion over last year
• Funds allocated to the Agriculture Ministry increased 22 % to USD 5.63 billion.
• USD 711.4 million is planned for farm research
• Total plan outlay for agriculture in FY 14 raised to USD 3.56 billion from USD 2.87 billion in FY 2013
• Allocation of USD 208.3 million under scheme of Bringing Green Revolution to Eastern India (BGREI)
• Plans to launch crop diversification programmes in Punjab and Haryana
• National Food Security Mission, a scheme to bridge yields gap of major crops provided USD 468.7
million
• Funds for the Integrated Watershed Programme FY14 increased from USD 0.6 billion to USD 1.12
billion in FY13
Source: Ministry of Agriculture, Union Budget 2013-14
Confidential- For Kagashin clients onlyMay, 2014
8/11/2019 IndianAgriculture a Snapshot
http://slidepdf.com/reader/full/indianagriculture-a-snapshot 10/89
Key Agricultural States & their contributions
Confidential- For Kagashin clients onlyMay, 2014
8/11/2019 IndianAgriculture a Snapshot
http://slidepdf.com/reader/full/indianagriculture-a-snapshot 11/89
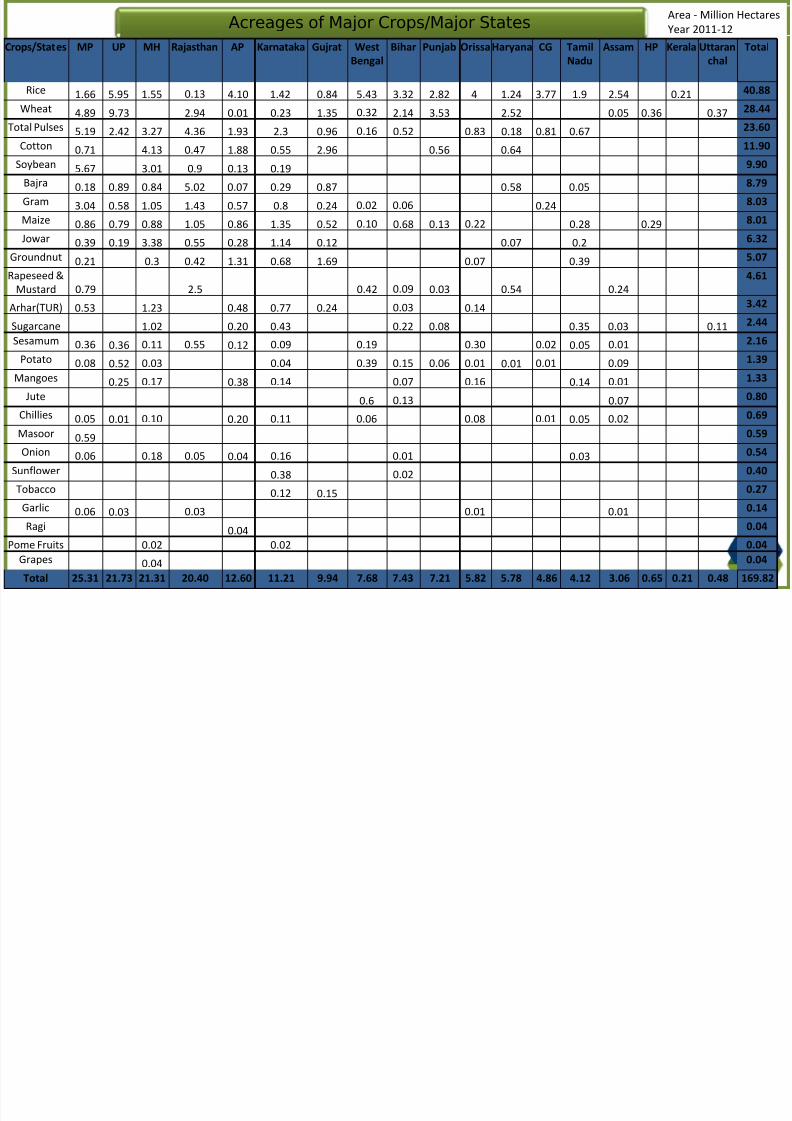
Acreages of Major Crops/Major StatesArea - Million Hectares
Year 2011-12
Crops/States MP UP MH Rajasthan AP Karnataka Gujrat West
Bengal
Bihar Punjab Orissa Haryana CG Tamil
Nadu
Assam HP Kerala Uttaran
chal
Total
Rice 1.66 5.95 1.55 0.13 4.10 1.42 0.84 5.43 3.32 2.82 4 1.24 3.77 1.9 2.54 0.21 40.88
Wheat 4.89 9.73 2.94 0.01 0.23 1.35 0.32 2.14 3.53 2.52 0.05 0.36 0.37 28.44
Total Pulses 5.19 2.42 3.27 4.36 1.93 2.3 0.96 0.16 0.52 0.83 0.18 0.81 0.67 23.60
Cotton 0.71 4.13 0.47 1.88 0.55 2.96 0.56 0.64 11.90
Soybean 5.67 3.01 0.9 0.13 0.19 9.90
Bajra 0.18 0.89 0.84 5.02 0.07 0.29 0.87 0.58 0.05 8.79
Gram 3.04 0.58 1.05 1.43 0.57 0.8 0.24 0.02 0.06 0.24 8.03
Maize 0.86 0.79 0.88 1.05 0.86 1.35 0.52 0.10 0.68 0.13 0.22 0.28 0.29 8.01
Jowar 0.39 0.19 3.38 0.55 0.28 1.14 0.12 0.07 0.2 6.32
Groundnut 0.21 0.3 0.42 1.31 0.68 1.69 0.07 0.39 5.07
Rapeseed &Mustard 0.79 2.5 0.42 0.09 0.03 0.54 0.24
4.61
Arhar(TUR) 0.53 1.23 0.48 0.77 0.24 0.03 0.14 3.42
Sugarcane 1.02 0.20 0.43 0.22 0.08 0.35 0.03 0.11 2.44
Sesamum 0.36 0.36 0.11 0.55 0.12 0.09 0.19 0.30 0.02 0.05 0.01 2.16
Potato 0.08 0.52 0.03 0.04 0.39 0.15 0.06 0.01 0.01 0.01 0.09 1.39
Mangoes 0.25 0.17 0.38 0.14 0.07 0.16 0.14 0.01 1.33
Jute 0.6 0.13 0.07 0.80
Chillies 0.05 0.01 0.10 0.20 0.11 0.06 0.08 0.01 0.05 0.02 0.69Masoor 0.59 0.59
Onion 0.06 0.18 0.05 0.04 0.16 0.01 0.03 0.54
Sunflower 0.38 0.02 0.40
Tobacco 0.12 0.15 0.27
Garlic 0.06 0.03 0.03 0.01 0.01 0.14
Ragi 0.04 0.04
Pome Fruits 0.02 0.02 0.04
Grapes 0.04 0.04
Total 25.31 21.73 21.31 20.40 12.60 11.21 9.94 7.68 7.43 7.21 5.82 5.78 4.86 4.12 3.06 0.65 0.21 0.48 169.82
8/11/2019 IndianAgriculture a Snapshot
http://slidepdf.com/reader/full/indianagriculture-a-snapshot 12/89
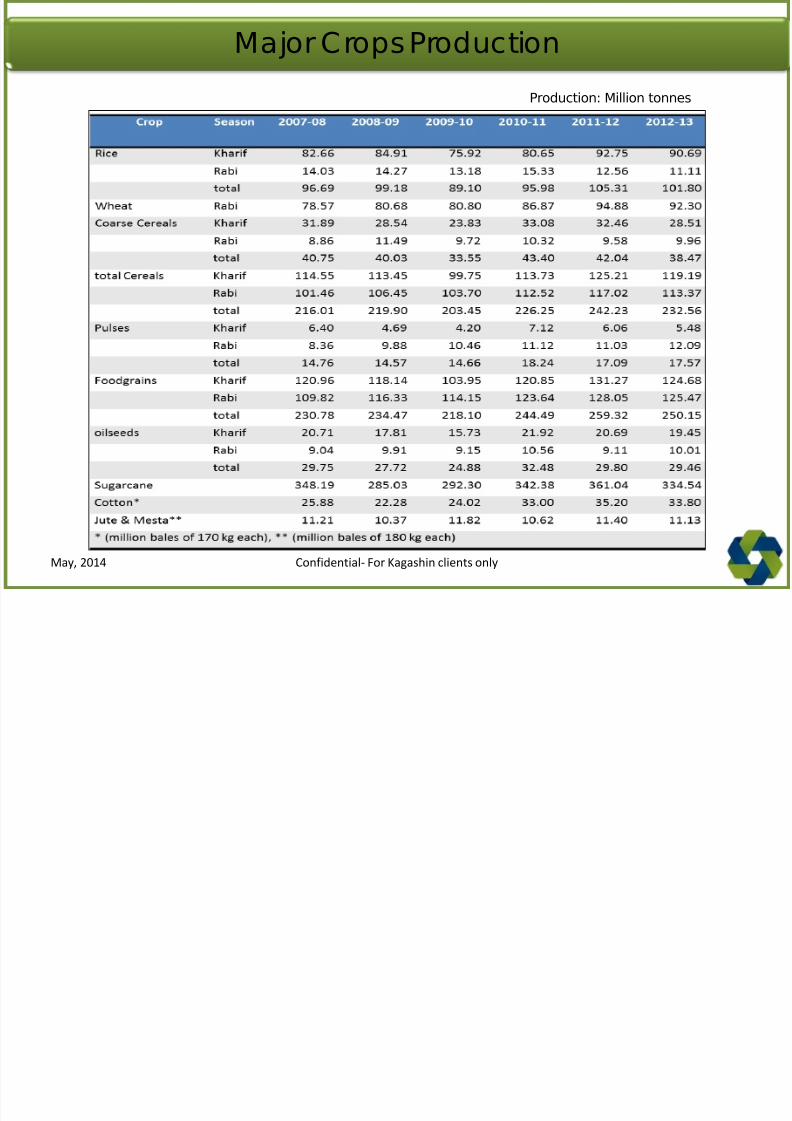
Major Crops Production
Production: Million tonnes
Confidential- For Kagashin clients onlyMay, 2014
8/11/2019 IndianAgriculture a Snapshot
http://slidepdf.com/reader/full/indianagriculture-a-snapshot 13/89
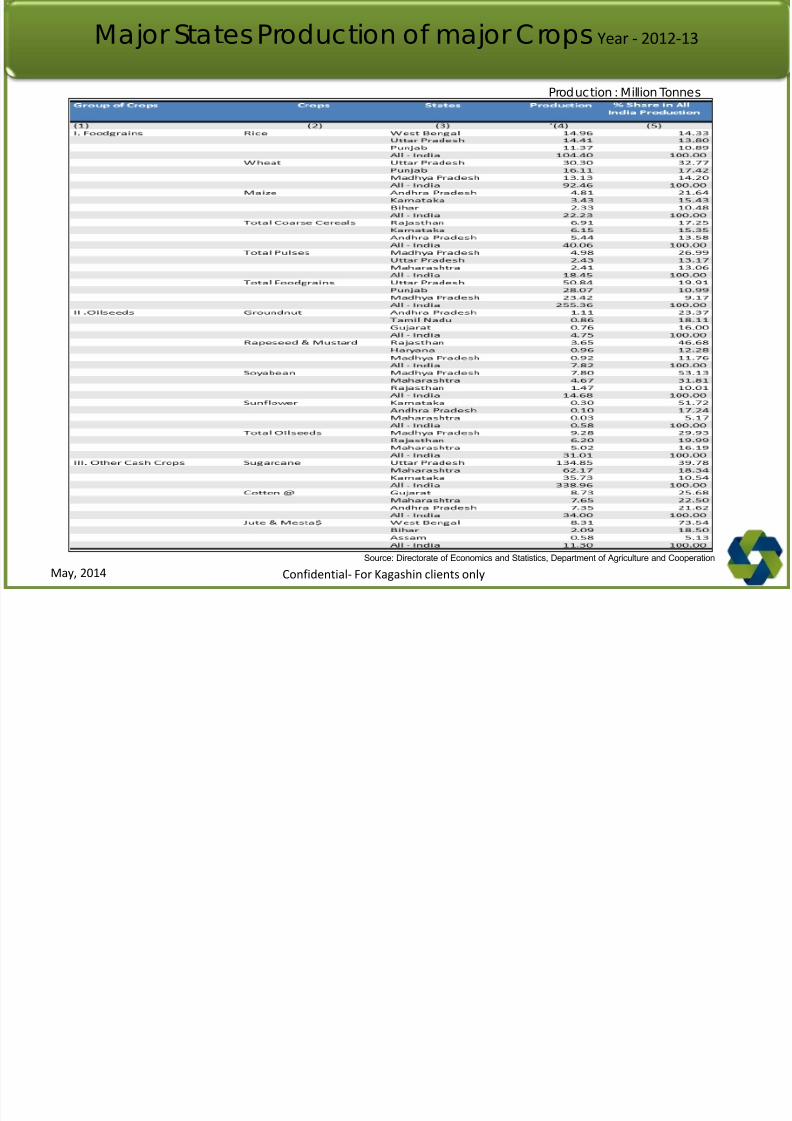
Major States Production of major Crops Year - 2012-13
Source: Directorate of Economics and Statistics, Department of Agriculture and Cooperation
Production : Million Tonnes
Confidential- For Kagashin clients onlyMay, 2014
8/11/2019 IndianAgriculture a Snapshot
http://slidepdf.com/reader/full/indianagriculture-a-snapshot 14/89
8/11/2019 IndianAgriculture a Snapshot
http://slidepdf.com/reader/full/indianagriculture-a-snapshot 15/89
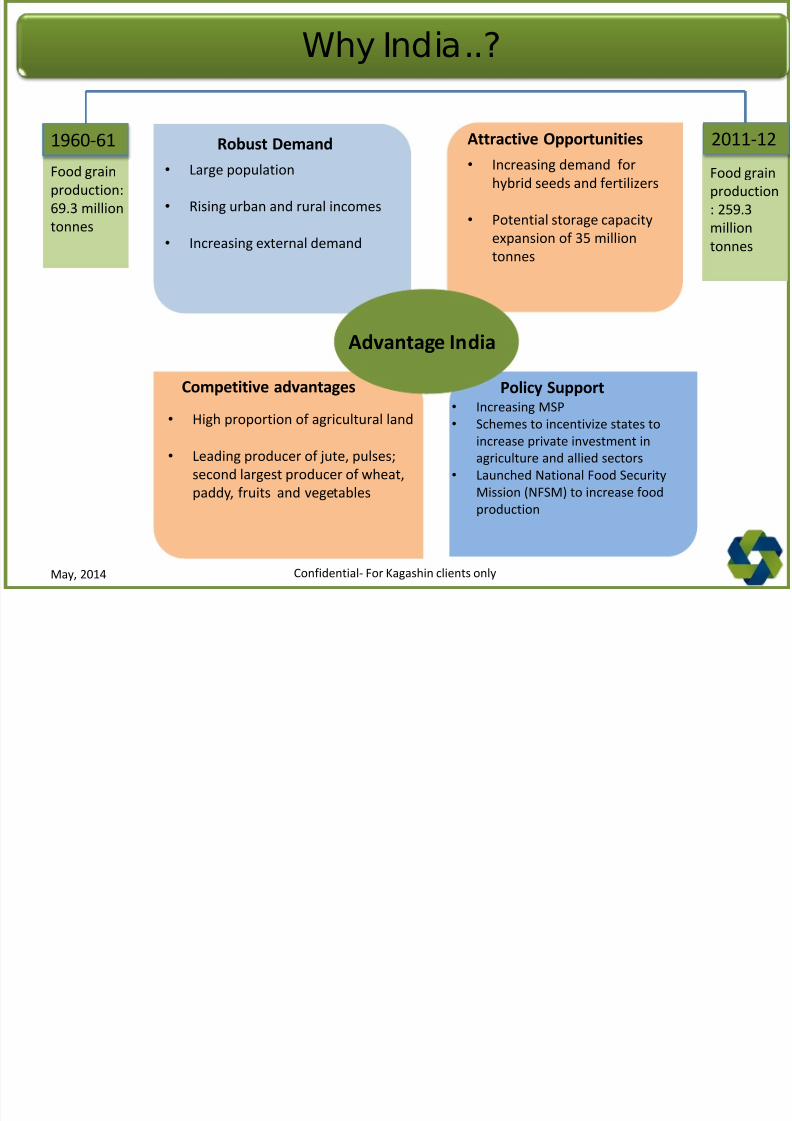
Why India..?
1960-61 2011-12Food grain
production:
69.3 million
tonnes
Food grain
production
: 259.3
million
tonnes
• Large population
• Rising urban and rural incomes
• Increasing external demand
Robust Demand Attractive Opportunities
Policy SupportCompetitive advantages
Advantage India
• Increasing demand for
hybrid seeds and fertilizers
• Potential storage capacity
expansion of 35 million
tonnes
• High proportion of agricultural land
• Leading producer of jute, pulses;
second largest producer of wheat,
paddy, fruits and vegetables
• Increasing MSP
• Schemes to incentivize states to
increase private investment in
agriculture and allied sectors
• Launched National Food Security
Mission (NFSM) to increase food
production
Confidential- For Kagashin clients onlyMay, 2014
8/11/2019 IndianAgriculture a Snapshot
http://slidepdf.com/reader/full/indianagriculture-a-snapshot 16/89
8/11/2019 IndianAgriculture a Snapshot
http://slidepdf.com/reader/full/indianagriculture-a-snapshot 17/89
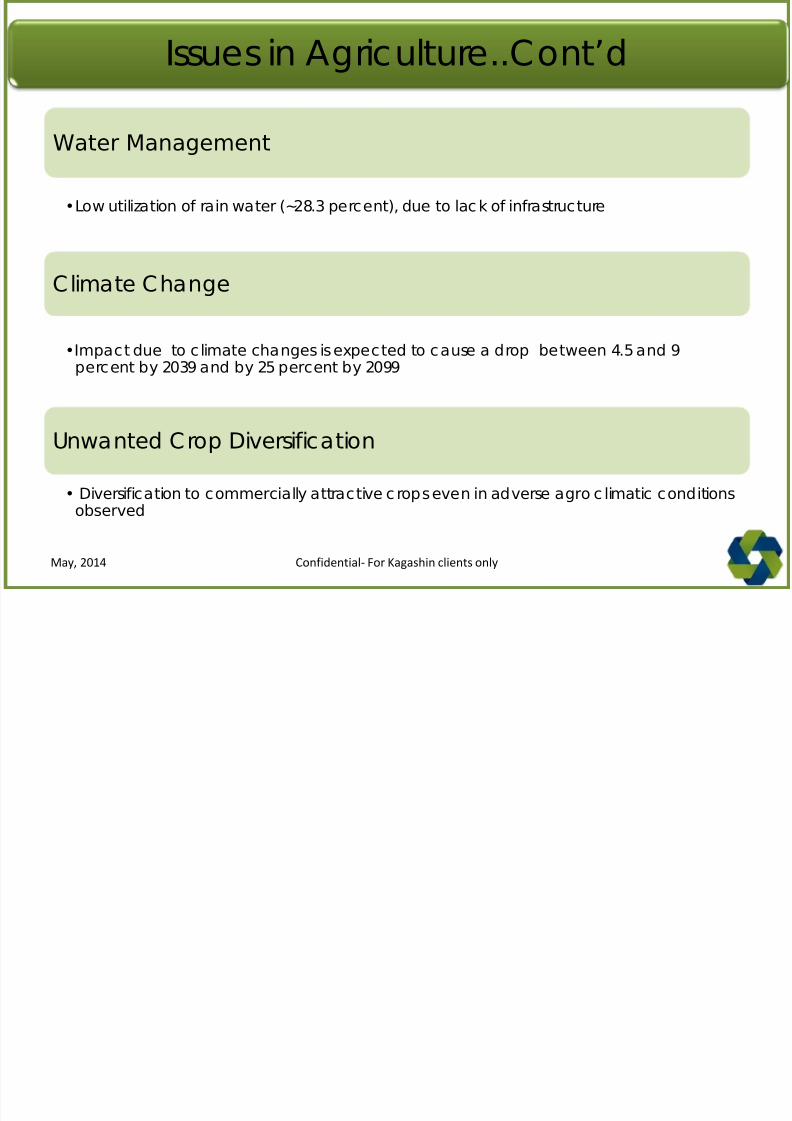
Water Management
•Low utilization of rain water (~28.3 percent), due to lack of infrastructure
Climate Change
•Impact due to c limate changes is expected to cause a drop between 4.5 and 9percent by 2039 and by 25 percent by 2099
Unwanted Crop Diversification
• Diversification to commercially attractive c rops even in adverse agro c limatic conditionsobserved
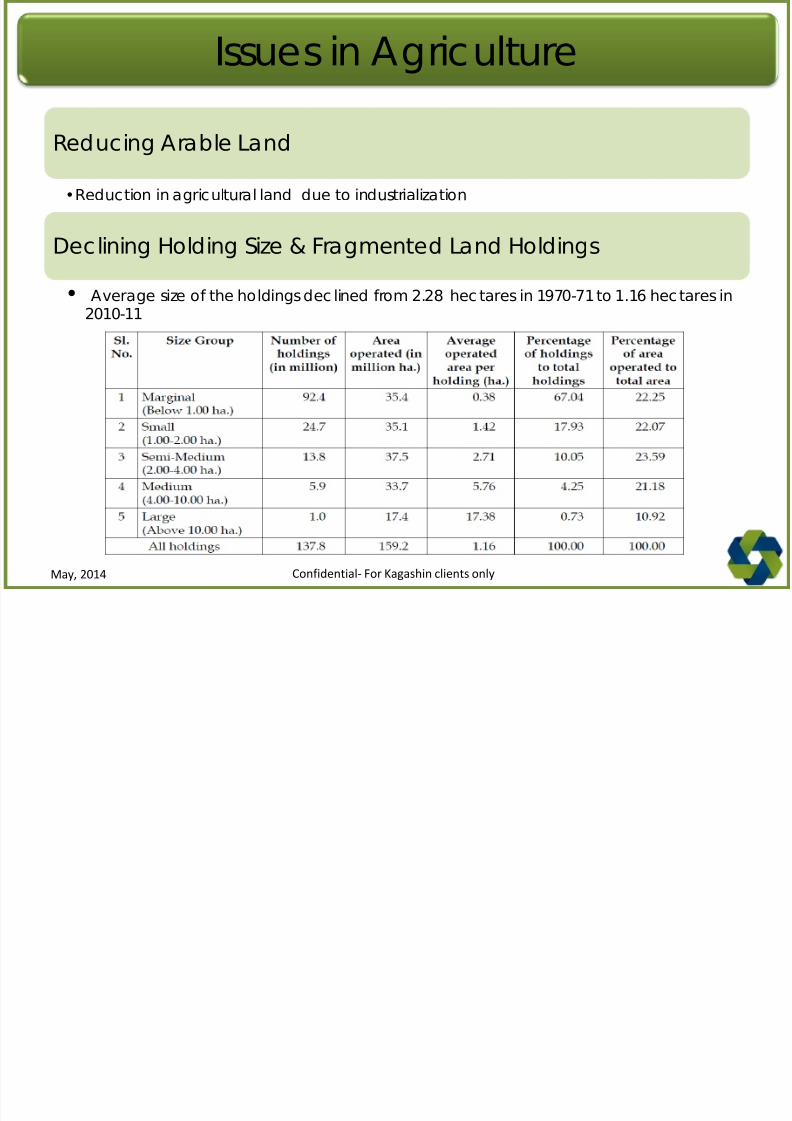
Issues in Agriculture..Cont’d
Confidential- For Kagashin clients onlyMay, 2014
8/11/2019 IndianAgriculture a Snapshot
http://slidepdf.com/reader/full/indianagriculture-a-snapshot 18/89
Rural Credit
•Inefficiencies in disbursement of rural credit to farmers undermine the development ofagriculture
Excessive Government intervention
•Government interventions in factor markets and in output markets has constrainedgrowth of the rural non-farm sec tor
Over-regulation of domestic agricultural trade
•Over- regulation has led to increased costs, price risks and uncertainty
Issues in Agriculture..Cont’d
Confidential- For Kagashin clients onlyMay, 2014
8/11/2019 IndianAgriculture a Snapshot
http://slidepdf.com/reader/full/indianagriculture-a-snapshot 19/89
8/11/2019 IndianAgriculture a Snapshot
http://slidepdf.com/reader/full/indianagriculture-a-snapshot 20/89
AGROCHEMICALS
Confidential- For Kagashin clients onlyMay, 2014
8/11/2019 IndianAgriculture a Snapshot
http://slidepdf.com/reader/full/indianagriculture-a-snapshot 21/89
Table of Contents
• Agriculture- Overview
- Size
- Major Acreages
- Major Crops
- Growth drivers
- Major Issues
• Insecticides, Fungicides &Herbicides
- Demand Pattern In Indian Market
- Insecticides Market Share
- Fungicides Market Share
- Herbicides Market Share
• Fertilizers- Overview
- Consumption
- Fertilizer – Indian Scenario
- Usage
- Efficiency
- Production- Imports
- Subsidy
- State Contribution
- Current Situation
- Growth Drivers
- Challenges
- Policies
• Seeds- Overview
- Growth Drivers
- Production
- Current Status
- Total Cropped Area
- Field Crops: Hybrid Seed Market
- Vegetable Crops: Hybrid Seed
Market
- Impact of new technology
- Regulatory Framework &
Challenges
- Productivity Challenges
- Biotechnology & its effect- Way Forward
- Summary
• Agrochemicals - Overview
- Segments
- Consumption
- Growth Drivers
- Top Companies- Key Challenges
Confidential- For Kagashin clients onlyMay, 2014
8/11/2019 IndianAgriculture a Snapshot
http://slidepdf.com/reader/full/indianagriculture-a-snapshot 22/89
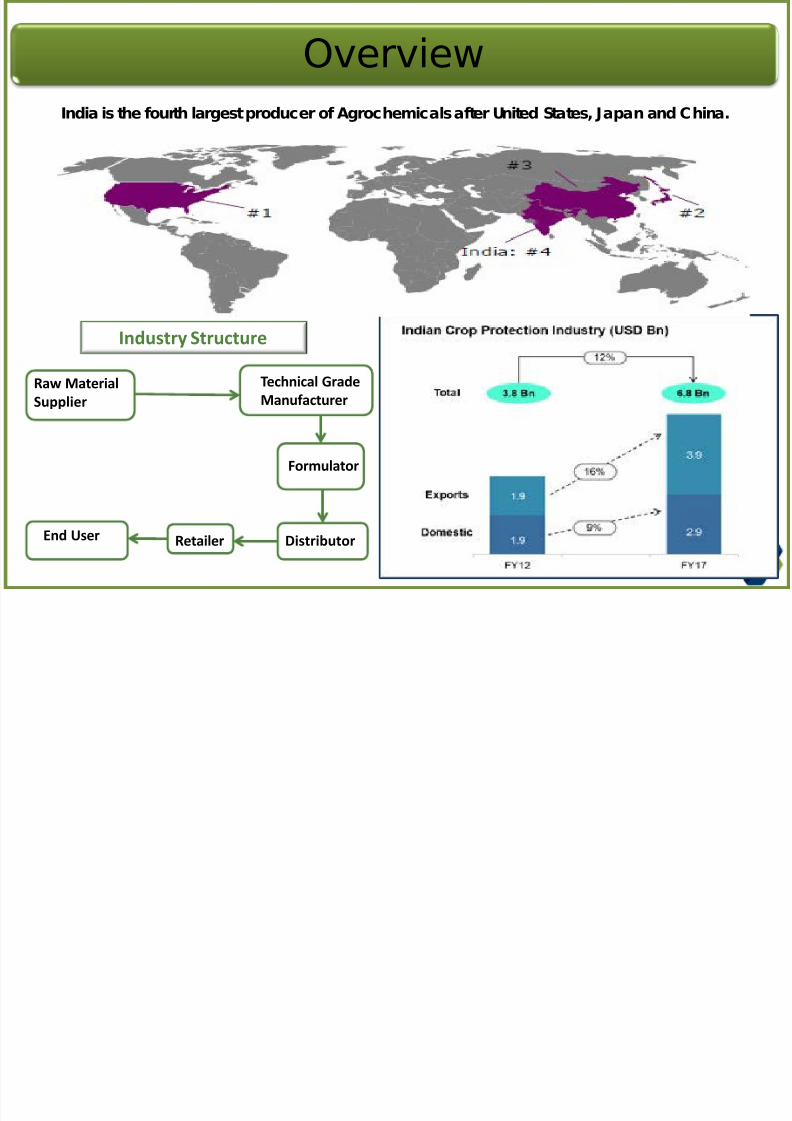
Overview
India is the fourth largest producer of Agrochemicals after United States, Japan and China.
Technical Grade
ManufacturerRaw Material
Supplier
Formulator
DistributorEnd User
Industry Structure
Retailer
8/11/2019 IndianAgriculture a Snapshot
http://slidepdf.com/reader/full/indianagriculture-a-snapshot 23/89
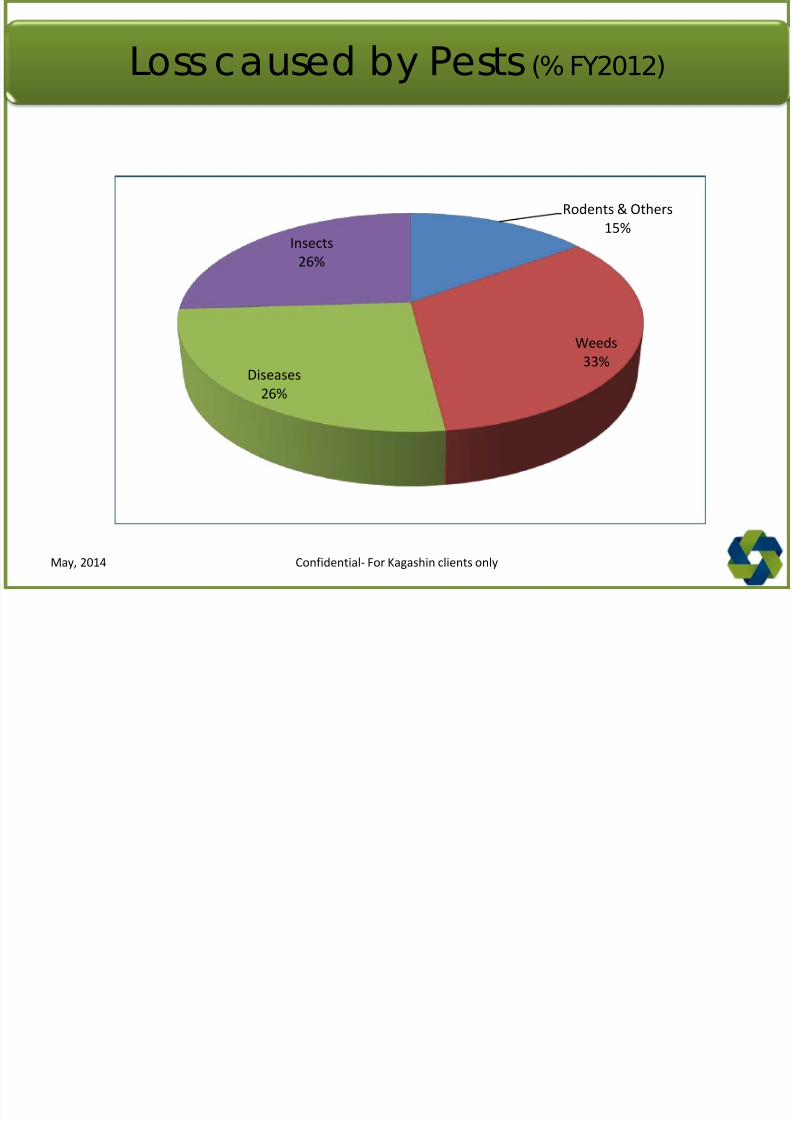
Loss caused by Pests (% FY2012)
Rodents & Others
15%
Weeds
33%Diseases
26%
Insects
26%
Confidential- For Kagashin clients onlyMay, 2014
8/11/2019 IndianAgriculture a Snapshot
http://slidepdf.com/reader/full/indianagriculture-a-snapshot 24/89
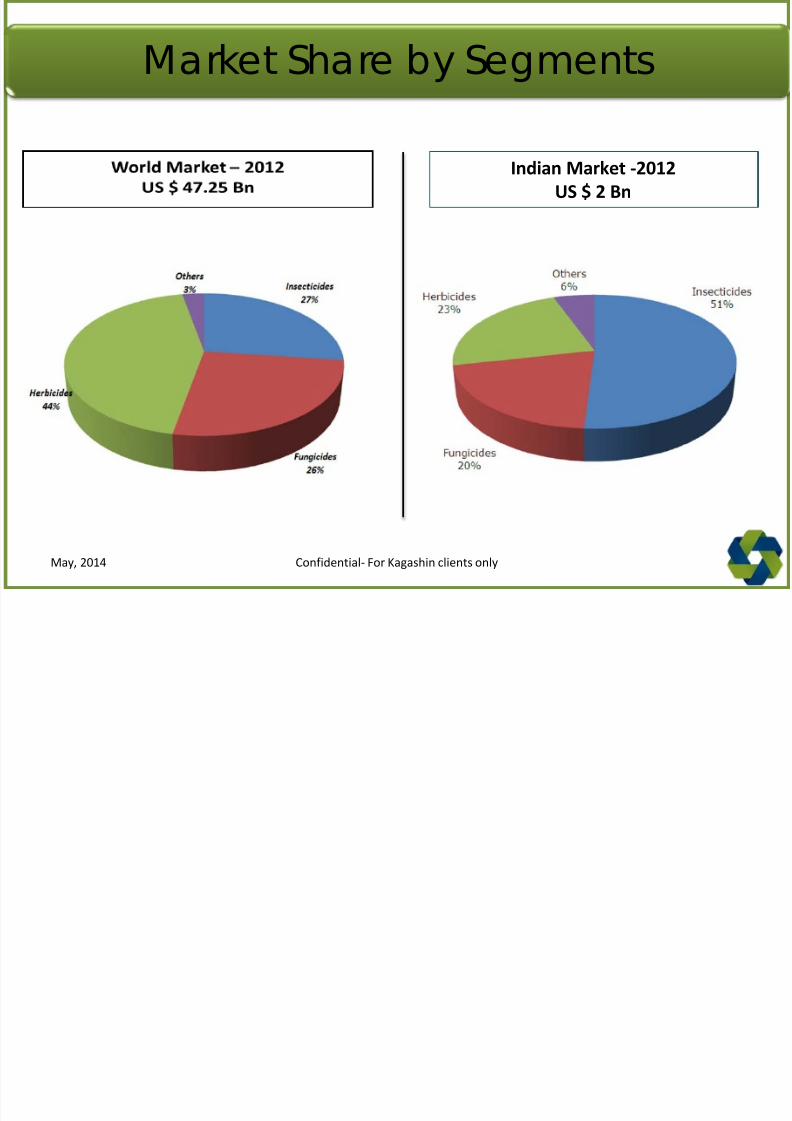
Market Share by Segments
Indian Market -2012
US $ 2 Bn
Confidential- For Kagashin clients onlyMay, 2014
8/11/2019 IndianAgriculture a Snapshot
http://slidepdf.com/reader/full/indianagriculture-a-snapshot 25/89
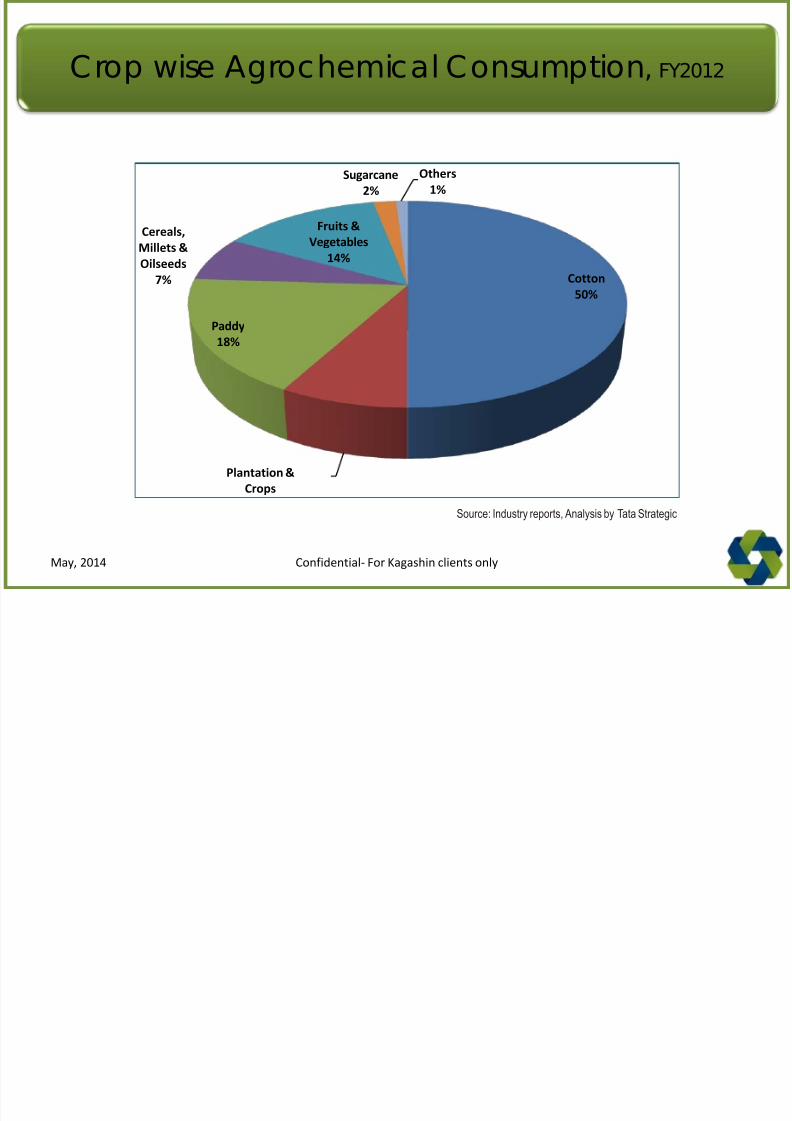
Crop wise Agrochemical Consumption, FY2012
Cotton50%
Plantation &
Crops
Paddy
18%
Cereals,
Millets &
Oilseeds
7%
Fruits &
Vegetables
14%
Sugarcane
2%
Others
1%
Source: Industry reports, Analysis by Tata Strategic
Confidential- For Kagashin clients onlyMay, 2014
8/11/2019 IndianAgriculture a Snapshot
http://slidepdf.com/reader/full/indianagriculture-a-snapshot 26/89
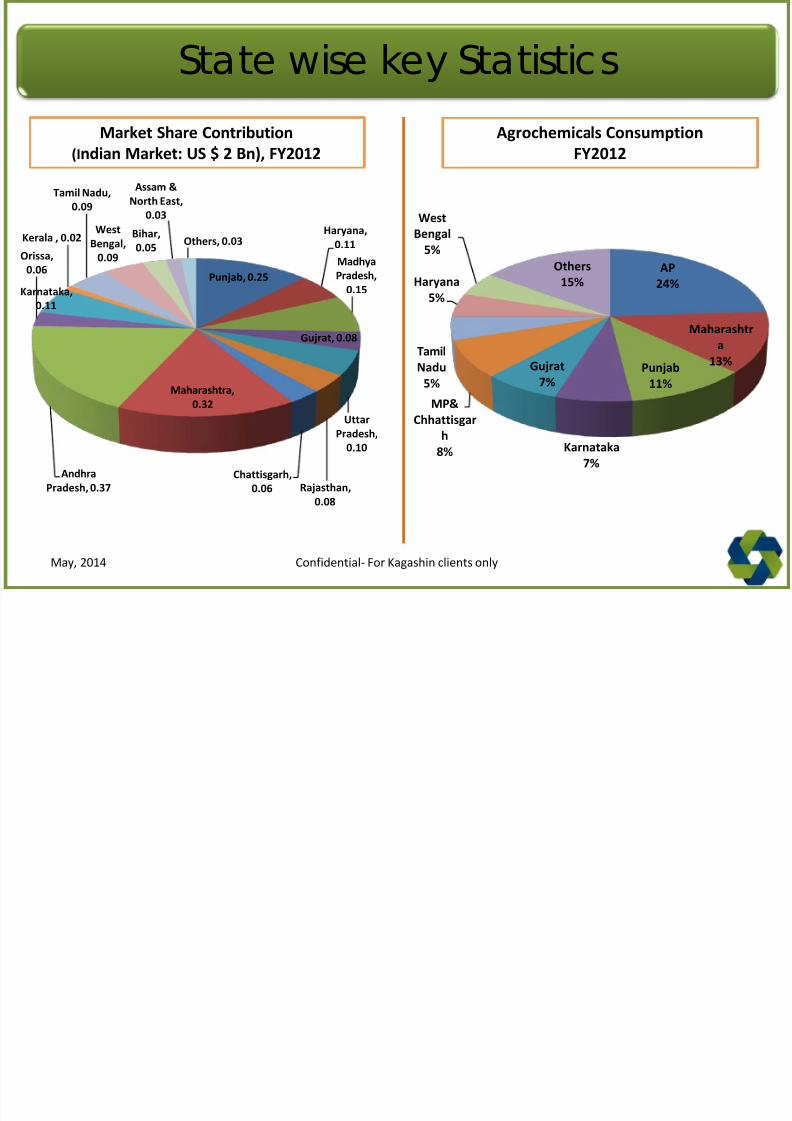
State wise key Statistics
Punjab, 0.25
Haryana,
0.11
Madhya
Pradesh,0.15
Gujrat, 0.08
UttarPradesh,
0.10
Rajasthan,
0.08
Chattisgarh,
0.06
Maharashtra,
0.32
Andhra
Pradesh, 0.37
Orissa,
0.06
Karnataka,
0.11
Kerala , 0.02
Tamil Nadu,
0.09
West
Bengal,
0.09
Bihar,
0.05
Assam &
North East,
0.03
Others, 0.03
AP
24%
Maharashtr
a
13%Punjab
11%
Karnataka
7%
Gujrat
7%
MP&
Chhattisgarh
8%
Tamil
Nadu
5%
Haryana5%
West
Bengal
5%
Others
15%
Agrochemicals Consumption
FY2012
Market Share Contribution
(Indian Market: US $ 2 Bn), FY2012
Confidential- For Kagashin clients onlyMay, 2014
8/11/2019 IndianAgriculture a Snapshot
http://slidepdf.com/reader/full/indianagriculture-a-snapshot 27/89
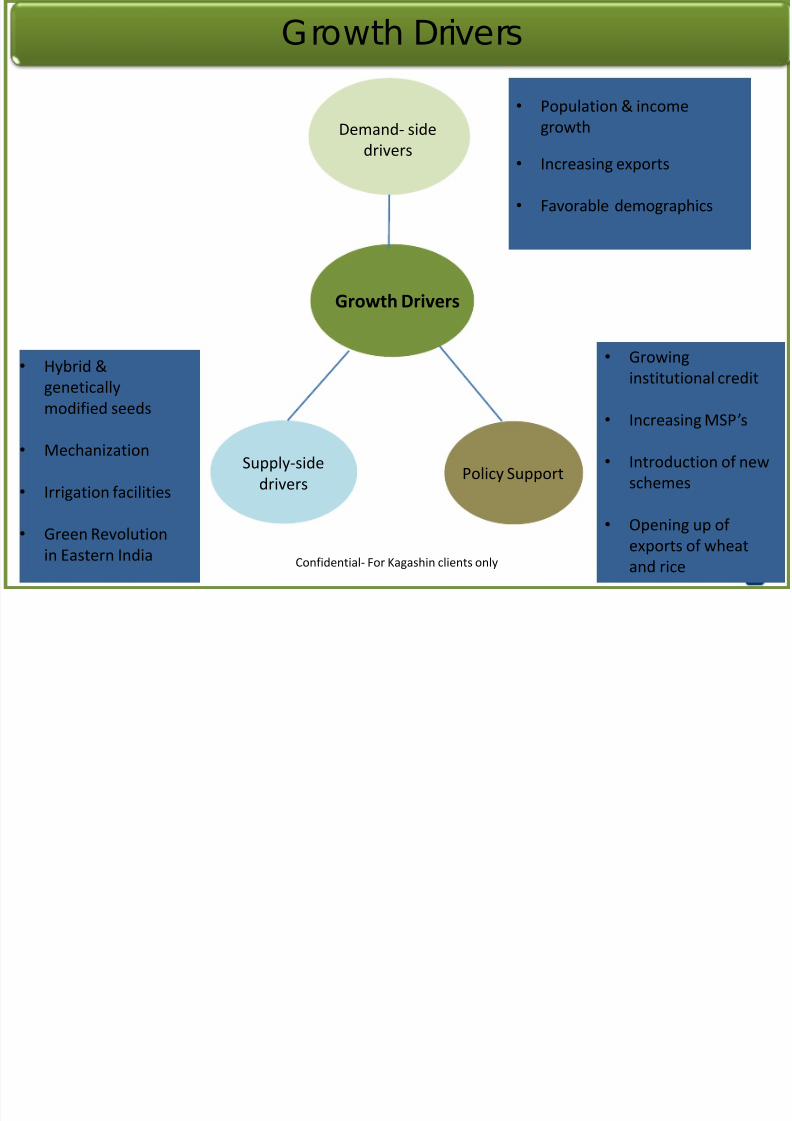
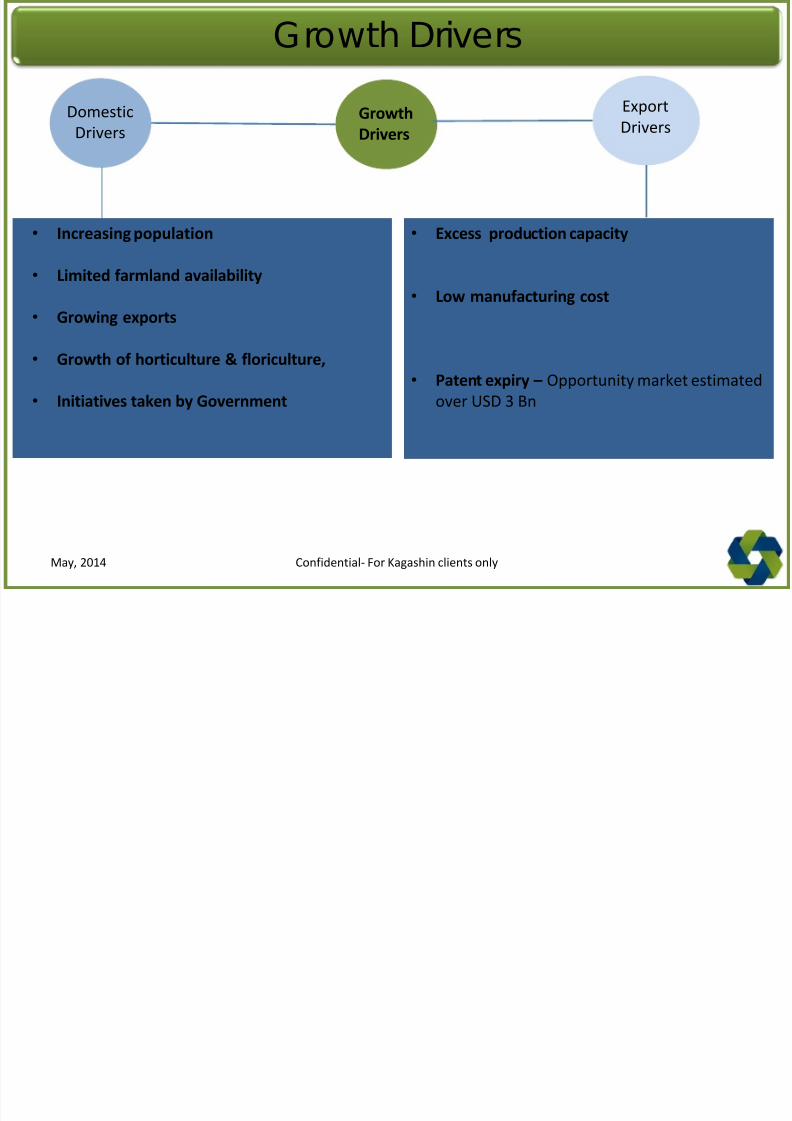
Growth Drivers
Growth
Drivers
Export
DriversDomestic
Drivers
• Excess production capacity
• Low manufacturing cost
• Patent expiry – Opportunity market estimated
over USD 3 Bn
• Increasing population
• Limited farmland availability
• Growing exports
• Growth of horticulture & floriculture,
• Initiatives taken by Government
Confidential- For Kagashin clients onlyMay, 2014
8/11/2019 IndianAgriculture a Snapshot
http://slidepdf.com/reader/full/indianagriculture-a-snapshot 28/89
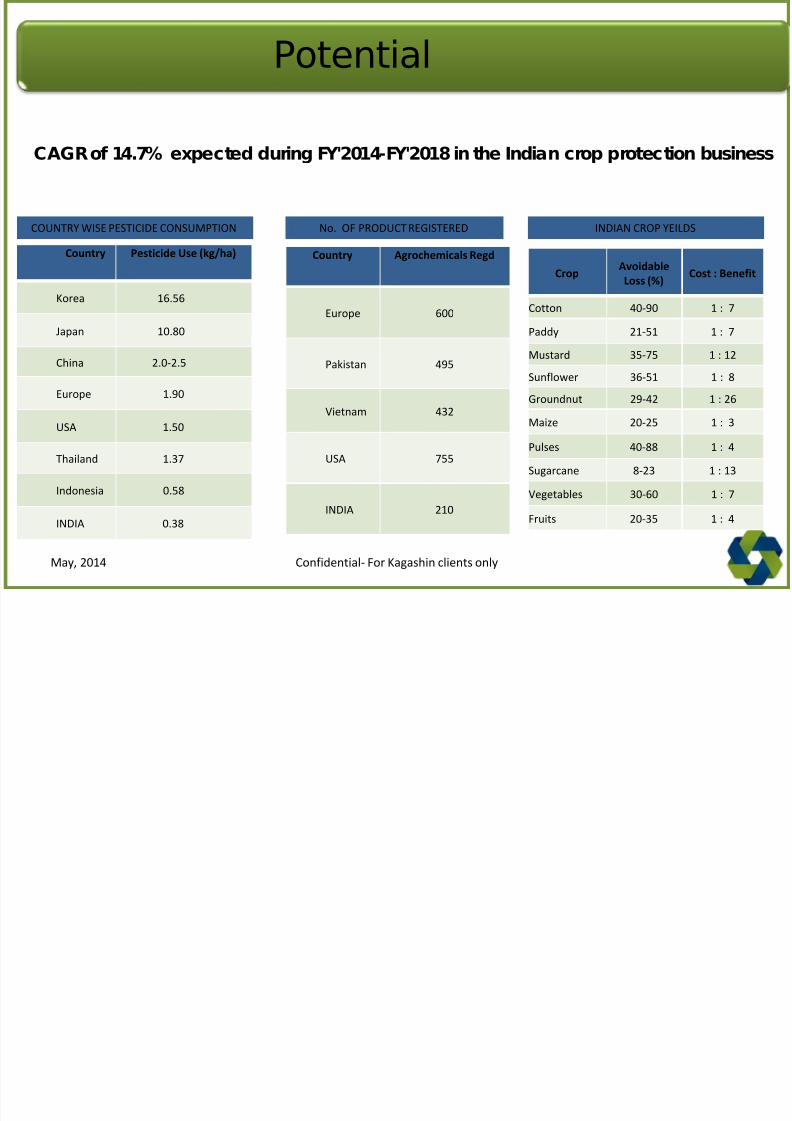
Potential
COUNTRY WISE PESTICIDE CONSUMPTION
Country Pesticide Use (kg/ha)
Korea 16.56
Japan 10.80
China 2.0-2.5
Europe 1.90
USA 1.50
Thailand 1.37
Indonesia 0.58
INDIA 0.38
Country Agrochemicals Regd
Europe 600
Pakistan 495
Vietnam 432
USA 755
INDIA 210
No. OF PRODUCT REGISTERED
CropAvoidable
Loss (%)Cost : Benefit
Cotton 40-90 1 : 7
Paddy 21-51 1 : 7
Mustard 35-75 1 : 12
Sunflower 36-51 1 : 8
Groundnut 29-42 1 : 26
Maize 20-25 1 : 3
Pulses 40-88 1 : 4
Sugarcane 8-23 1 : 13
Vegetables 30-60 1 : 7
Fruits 20-35 1 : 4
INDIAN CROP YEILDS
CAGR of 14.7% expected during FY'2014-FY'2018 in the Indian crop protection business
Confidential- For Kagashin clients onlyMay, 2014
8/11/2019 IndianAgriculture a Snapshot
http://slidepdf.com/reader/full/indianagriculture-a-snapshot 29/89
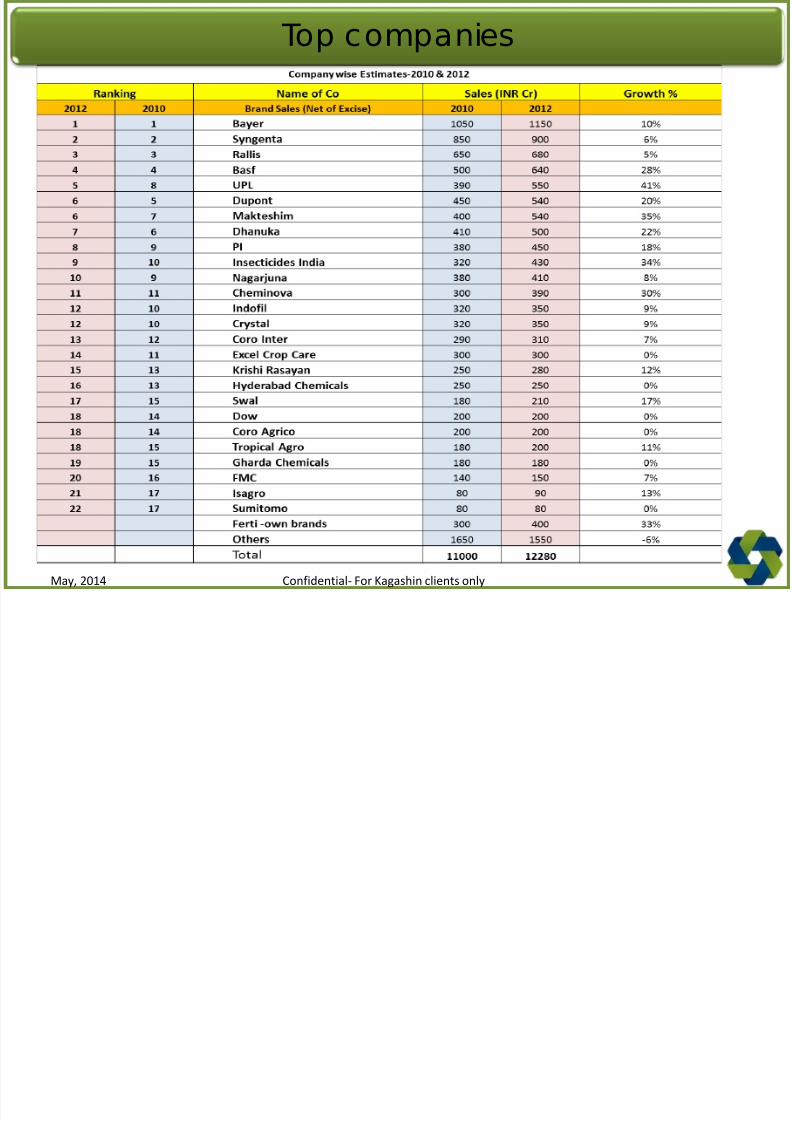
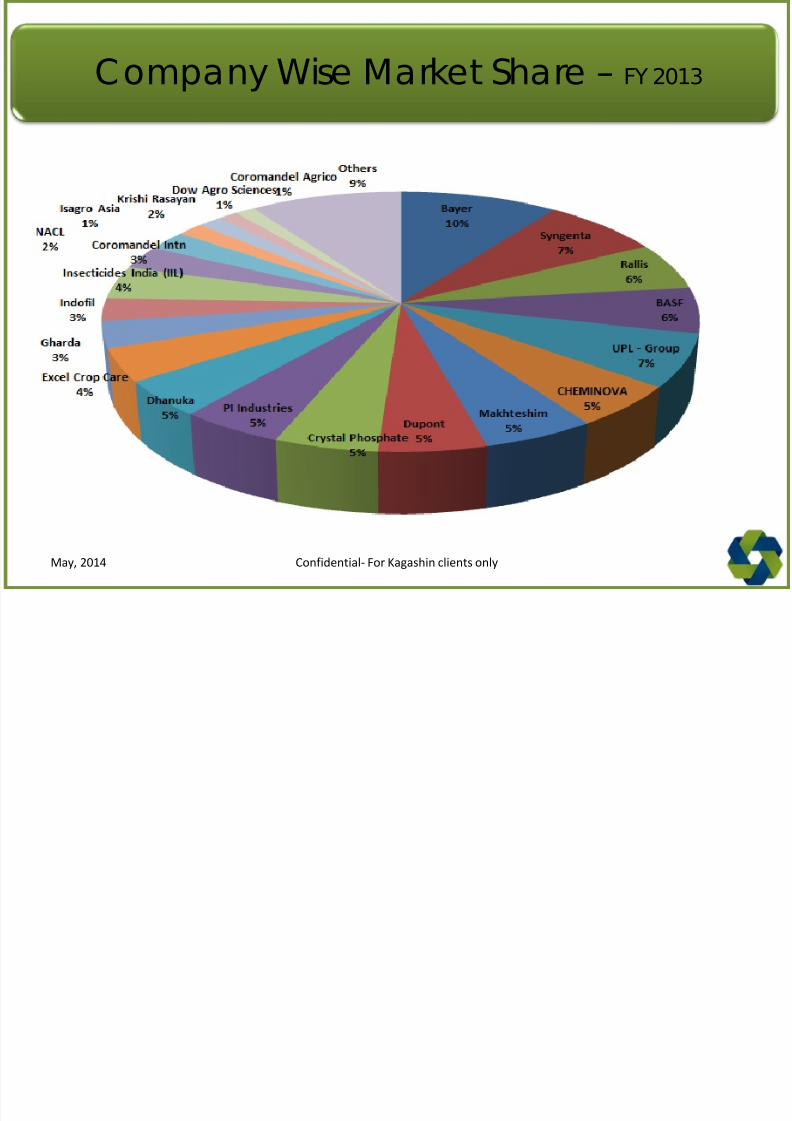
Top companies
Confidential- For Kagashin clients onlyMay, 2014
8/11/2019 IndianAgriculture a Snapshot
http://slidepdf.com/reader/full/indianagriculture-a-snapshot 30/89
8/11/2019 IndianAgriculture a Snapshot
http://slidepdf.com/reader/full/indianagriculture-a-snapshot 31/89
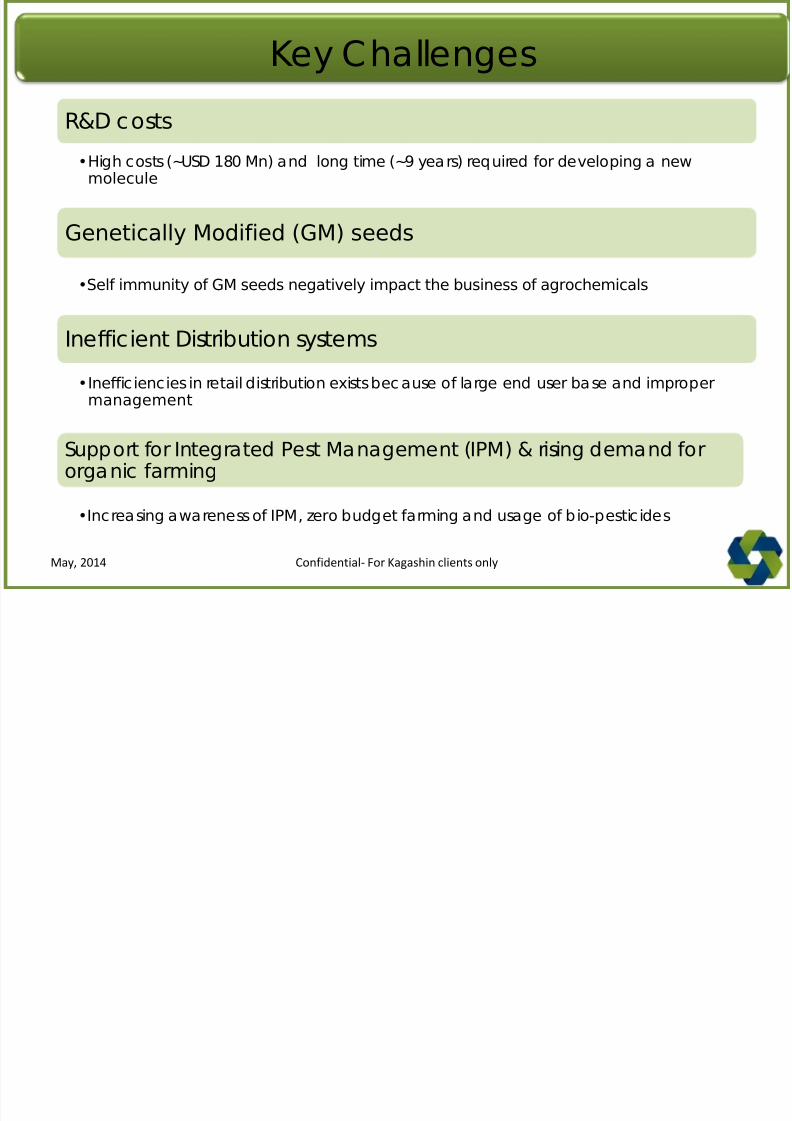
Key Challenges
R&D costs
•High costs (~USD 180 Mn) and long time (~9 years) required for developing a newmolecule
Genetically Modified (GM) seeds
•Self immunity of GM seeds negatively impact the business of agrochemicals
Inefficient Distribution systems
•Inefficiencies in retail distribution exists bec ause of large end user base and impropermanagement
Support for Integrated Pest Management (IPM) & rising demand fororganic farming
•Increasing awareness of IPM, zero budget farming and usage of bio-pesticides
Confidential- For Kagashin clients onlyMay, 2014
8/11/2019 IndianAgriculture a Snapshot
http://slidepdf.com/reader/full/indianagriculture-a-snapshot 32/89
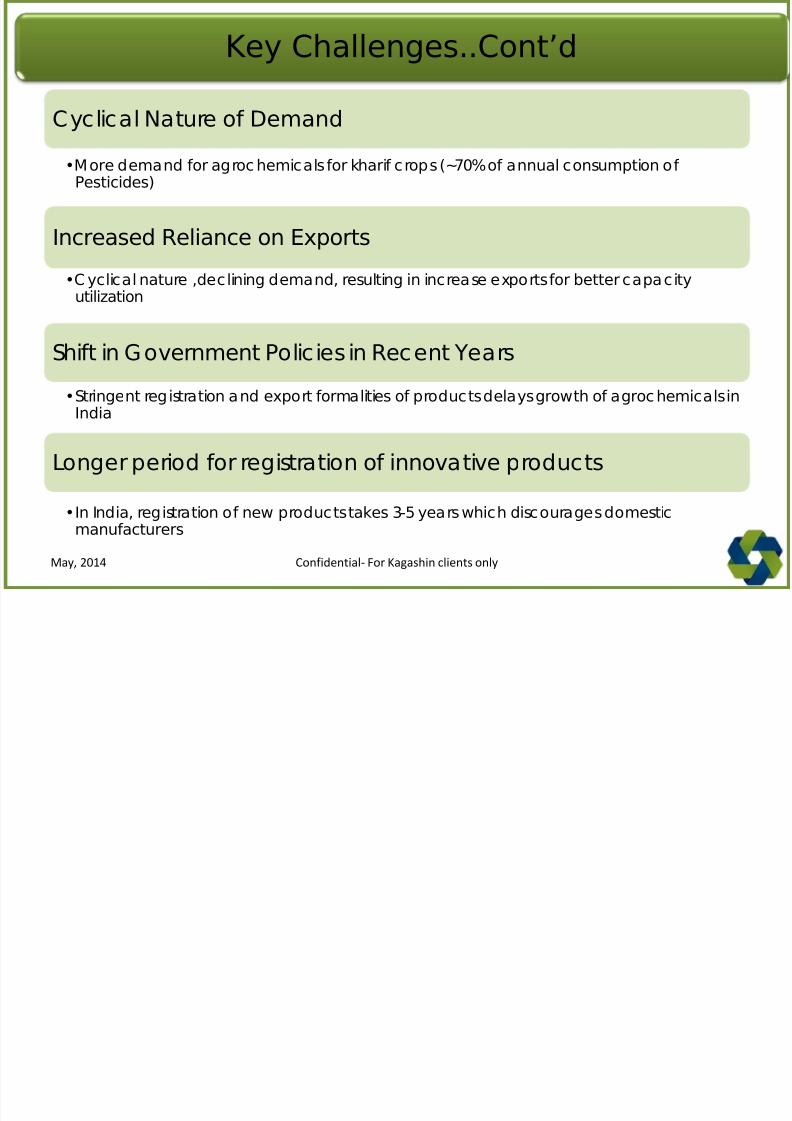
Cyclical Nature of Demand
•More demand for agroc hemicals for kharif crops (~70% of annual consumption ofPesticides)
Increased Reliance on Exports
•C yclical nature ,declining demand, resulting in increase exports for better capacityutilization
Shift in Government Policies in Recent Years
•Stringent registration and export formalities of products delays growth of agrochemicals in
India
Longer period for registration of innovative products
•In India, registration of new products takes 3-5 years which discourages domesticmanufacturers
Key Challenges..Cont’d
Confidential- For Kagashin clients onlyMay, 2014
8/11/2019 IndianAgriculture a Snapshot
http://slidepdf.com/reader/full/indianagriculture-a-snapshot 33/89
INSECTICIDES, FUNGICIDES & HERBICIDES
Confidential- For Kagashin clients onlyMay, 2014
8/11/2019 IndianAgriculture a Snapshot
http://slidepdf.com/reader/full/indianagriculture-a-snapshot 34/89
Table of Contents
• Agriculture
- Overview
- Size
- Major Acreages
- Major Crops
- Growth drivers
- Major Issues
• Agrochemicals
- Overview
- Segments
- Consumption
- Growth Drivers
- Top Companies
- Key Challenges
• Seeds
- Overview
- Growth Drivers
- Production
- Current Status
- Total Cropped Area
- Field Crops: Hybrid Seed Market
- Vegetable Crops: Hybrid Seed
Market
- Impact of new technology
- Regulatory Framework &
Challenges
- Productivity Challenges
- Biotechnology & its effect- Way Forward
- Summary
Fertilizers-Overview
-Consumption
-Fertilizer – Indian Scenario
-Usage
-Efficiency
-Production-Imports
-Subsidy
-State Contribution
-Current Situation
-Growth Drivers
-Challenges
-Policies
Insecticides, Fungicides &
Herbicides- Demand Pattern In Indian Market
- Insecticides Market Share
- Fungicides Market Share
- Herbicides Market Share
Confidential- For Kagashin clients onlyMay, 2014
8/11/2019 IndianAgriculture a Snapshot
http://slidepdf.com/reader/full/indianagriculture-a-snapshot 35/89
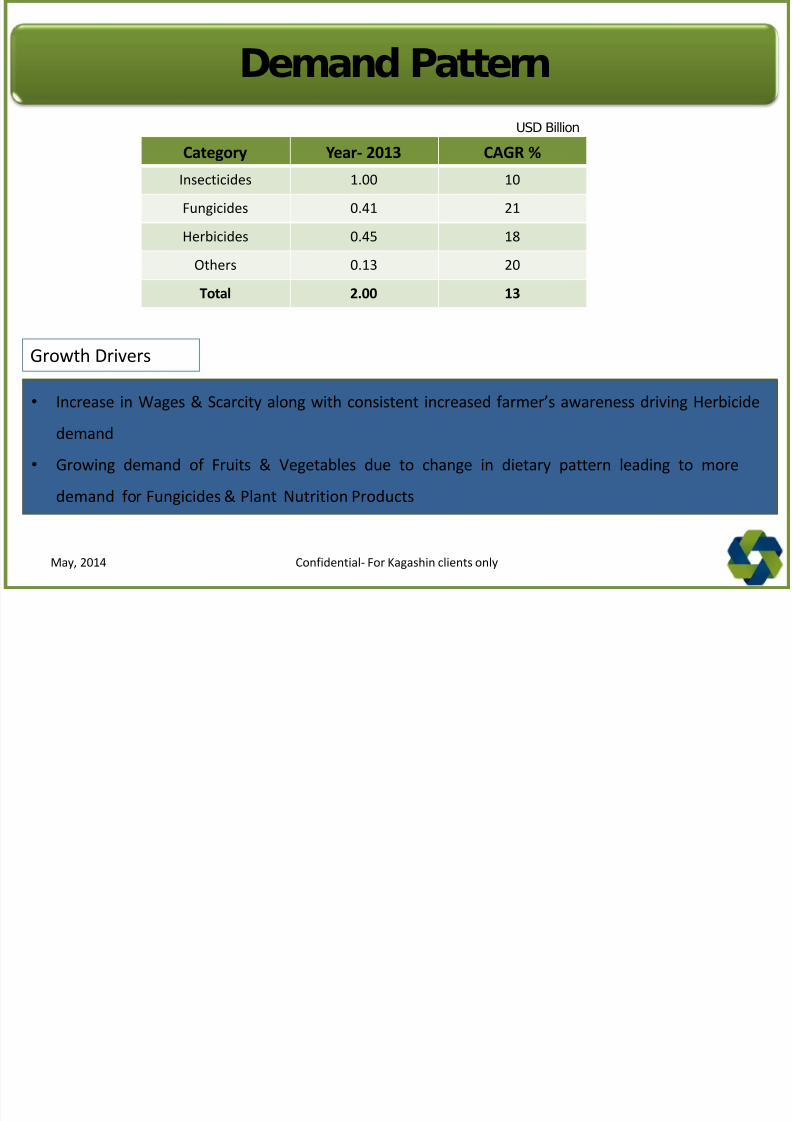
Demand Pattern
Category Year- 2013 CAGR %
Insecticides 1.00 10
Fungicides 0.41 21
Herbicides 0.45 18
Others 0.13 20
Total 2.00 13
USD Billion
• Increase in Wages & Scarcity along with consistent increased farmer’s awareness driving Herbicide
demand
• Growing demand of Fruits & Vegetables due to change in dietary pattern leading to more
demand for Fungicides & Plant Nutrition Products
Growth Drivers
Confidential- For Kagashin clients onlyMay, 2014
8/11/2019 IndianAgriculture a Snapshot
http://slidepdf.com/reader/full/indianagriculture-a-snapshot 36/89
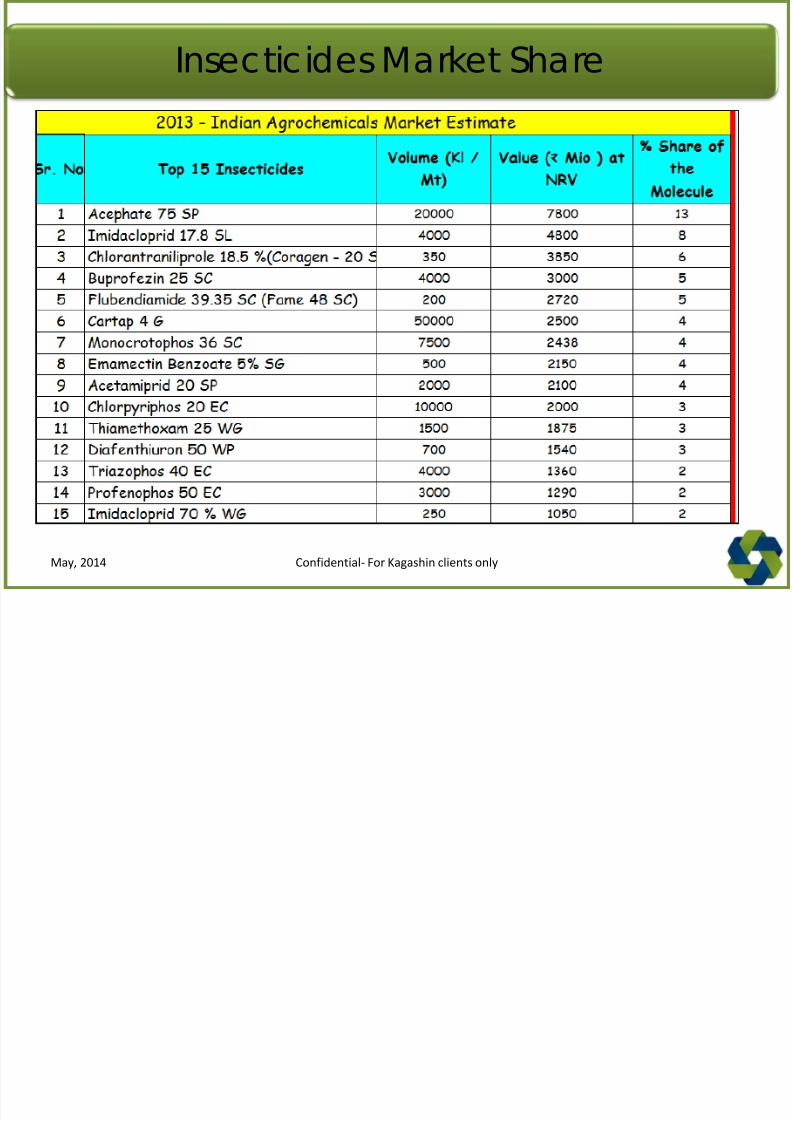
Insecticides Market Share
Confidential- For Kagashin clients onlyMay, 2014
8/11/2019 IndianAgriculture a Snapshot
http://slidepdf.com/reader/full/indianagriculture-a-snapshot 37/89
8/11/2019 IndianAgriculture a Snapshot
http://slidepdf.com/reader/full/indianagriculture-a-snapshot 38/89
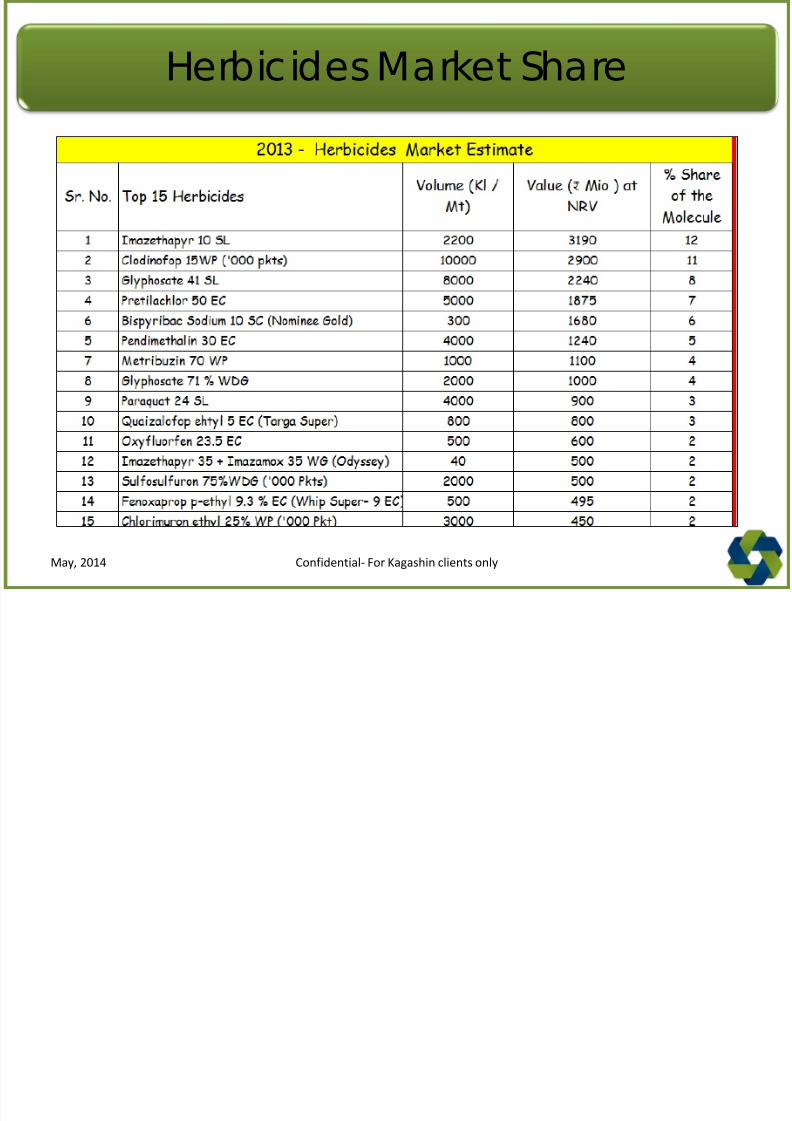
Herbicides Market Share
Confidential- For Kagashin clients onlyMay, 2014
8/11/2019 IndianAgriculture a Snapshot
http://slidepdf.com/reader/full/indianagriculture-a-snapshot 39/89
FERTILIZERS
Confidential- For Kagashin clients onlyMay, 2014
8/11/2019 IndianAgriculture a Snapshot
http://slidepdf.com/reader/full/indianagriculture-a-snapshot 40/89
8/11/2019 IndianAgriculture a Snapshot
http://slidepdf.com/reader/full/indianagriculture-a-snapshot 41/89
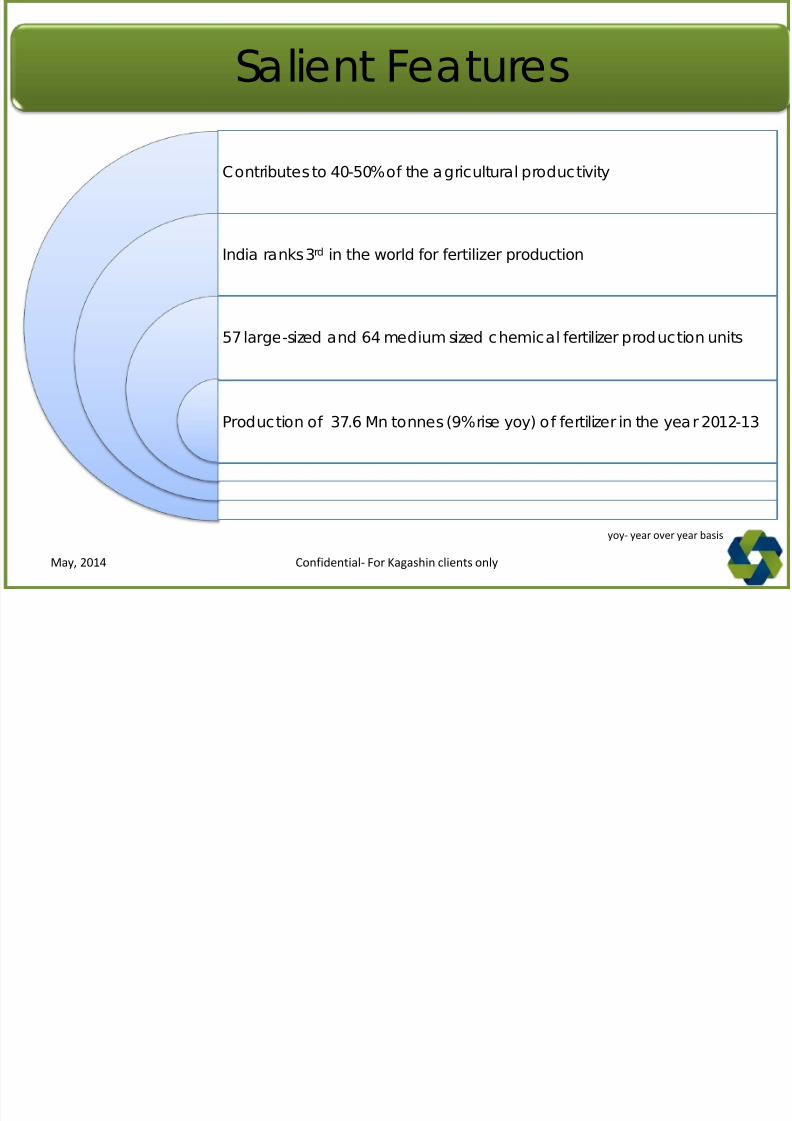
Salient Features
Contributes to 40-50% of the agricultural productivity
India ranks 3rd in the world for fertilizer production
57 large-sized and 64 medium sized chemical fertilizer production units
Production of 37.6 Mn tonnes (9% rise yoy) of fertilizer in the year 2012-13
yoy- year over year basis
Confidential- For Kagashin clients onlyMay, 2014
8/11/2019 IndianAgriculture a Snapshot
http://slidepdf.com/reader/full/indianagriculture-a-snapshot 42/89
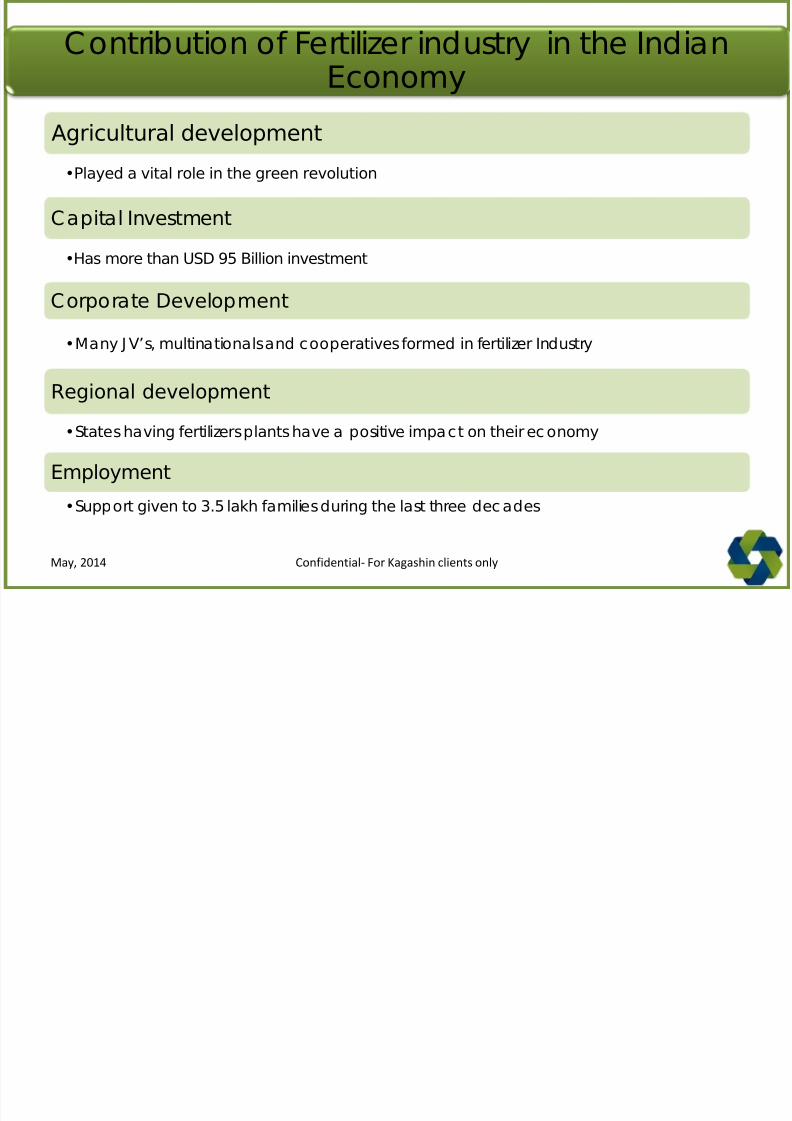
Contribution of Fertilizer industry in the IndianEconomy
Agricultural development•Played a vital role in the green revolution
Capital Investment
•Has more than USD 95 Billion investment
Corporate Development
•Many J V’s, multinationals and cooperatives formed in fertilizer Industry
Regional development
•States having fertilizers plants have a positive impact on their ec onomy
Employment
•Support given to 3.5 lakh families during the last three dec ades
Confidential- For Kagashin clients onlyMay, 2014
8/11/2019 IndianAgriculture a Snapshot
http://slidepdf.com/reader/full/indianagriculture-a-snapshot 43/89
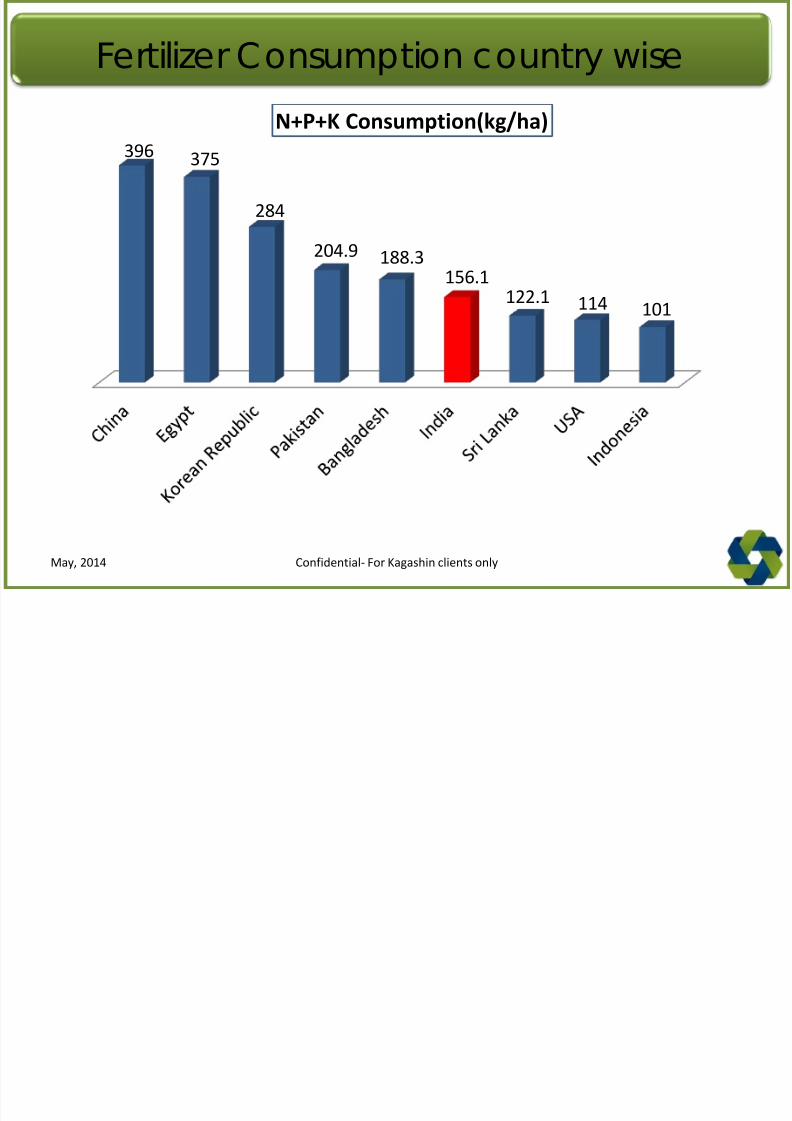
Fertilizer Consumption country wise
396 375
284
204.9 188.3
156.1 122.1 114 101
N+P+K Consumption(kg/ha)
Confidential- For Kagashin clients onlyMay, 2014
8/11/2019 IndianAgriculture a Snapshot
http://slidepdf.com/reader/full/indianagriculture-a-snapshot 44/89
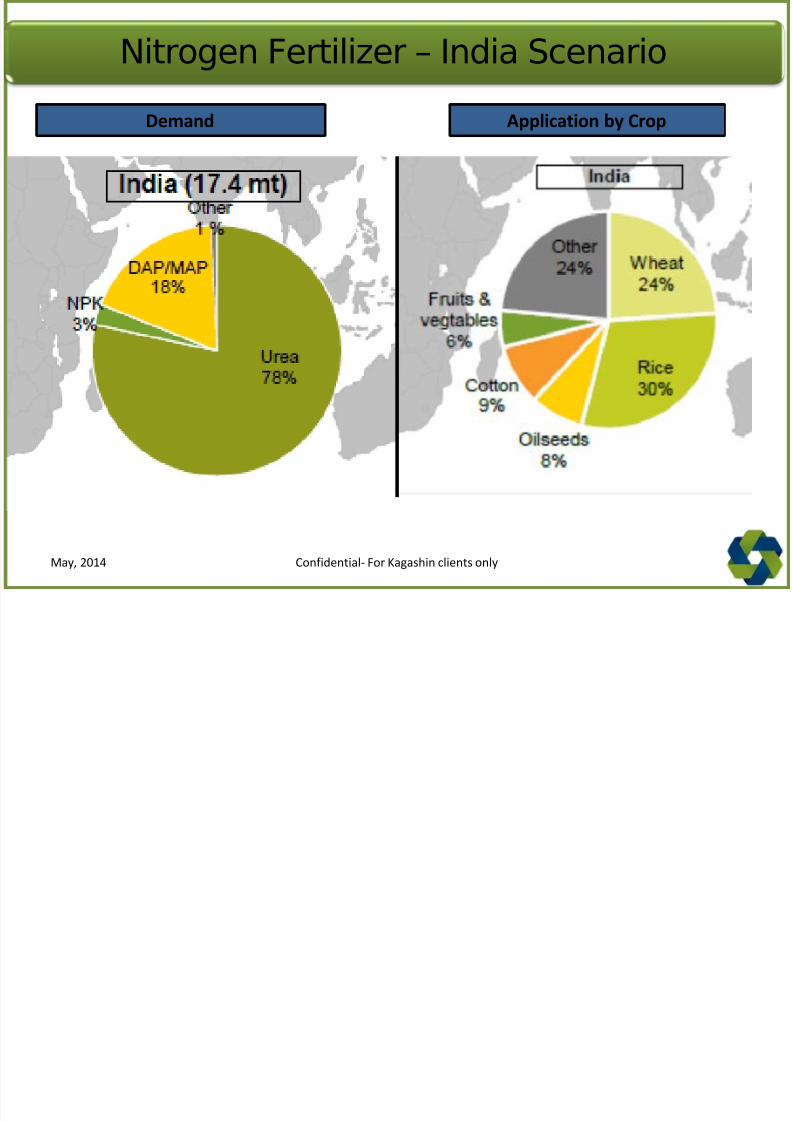
Nitrogen Fertilizer – India Scenario
Demand Application by Crop
Confidential- For Kagashin clients onlyMay, 2014
8/11/2019 IndianAgriculture a Snapshot
http://slidepdf.com/reader/full/indianagriculture-a-snapshot 45/89
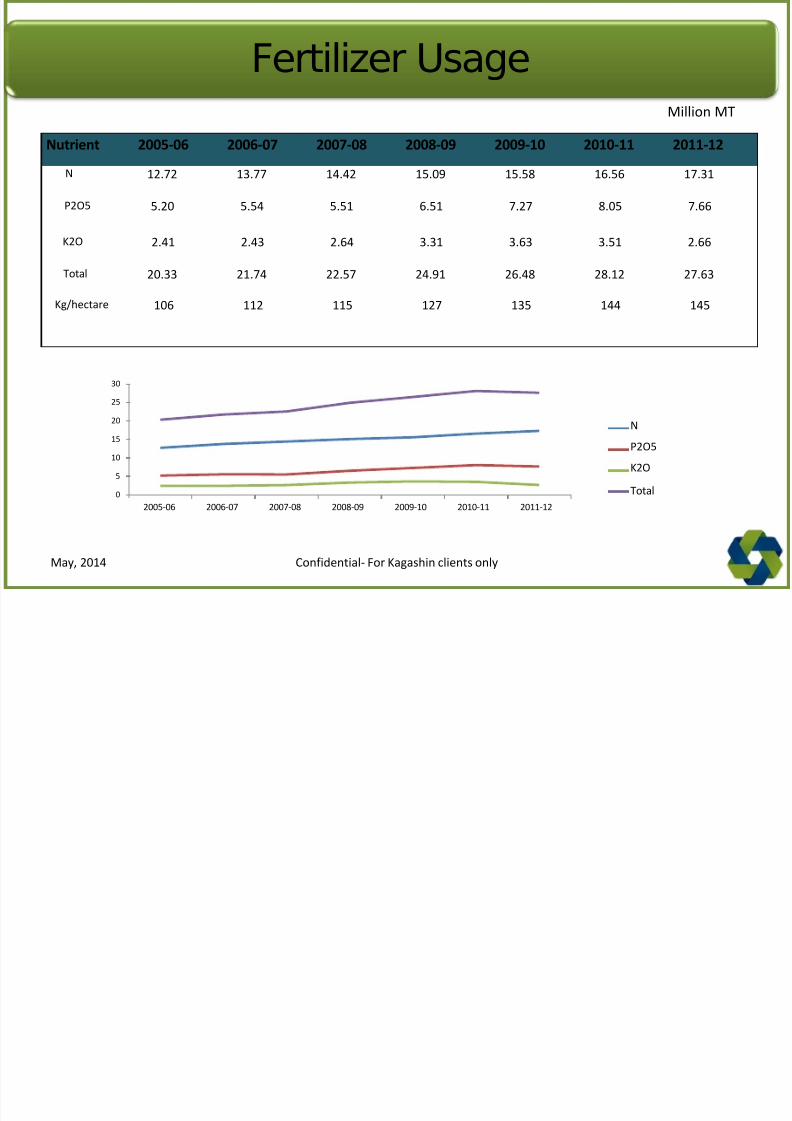
Fertilizer Usage
0
5
10
15
20
30
25
2005-06 2006-07 2007-08 2008-09 2009-10 2010-11 2011-12
N
P2O5
K2O
Total
Million MT
Nutrient 2005-06 2006-07 2007-08 2008-09 2009-10 2010-11 2011-12
N 12.72 13.77 14.42 15.09 15.58 16.56 17.31
P2O5 5.20 5.54 5.51 6.51 7.27 8.05 7.66
K2O 2.41 2.43 2.64 3.31 3.63 3.51 2.66
Total 20.33 21.74 22.57 24.91 26.48 28.12 27.63
Kg/hectare 106 112 115 127 135 144 145
Confidential- For Kagashin clients onlyMay, 2014
8/11/2019 IndianAgriculture a Snapshot
http://slidepdf.com/reader/full/indianagriculture-a-snapshot 46/89
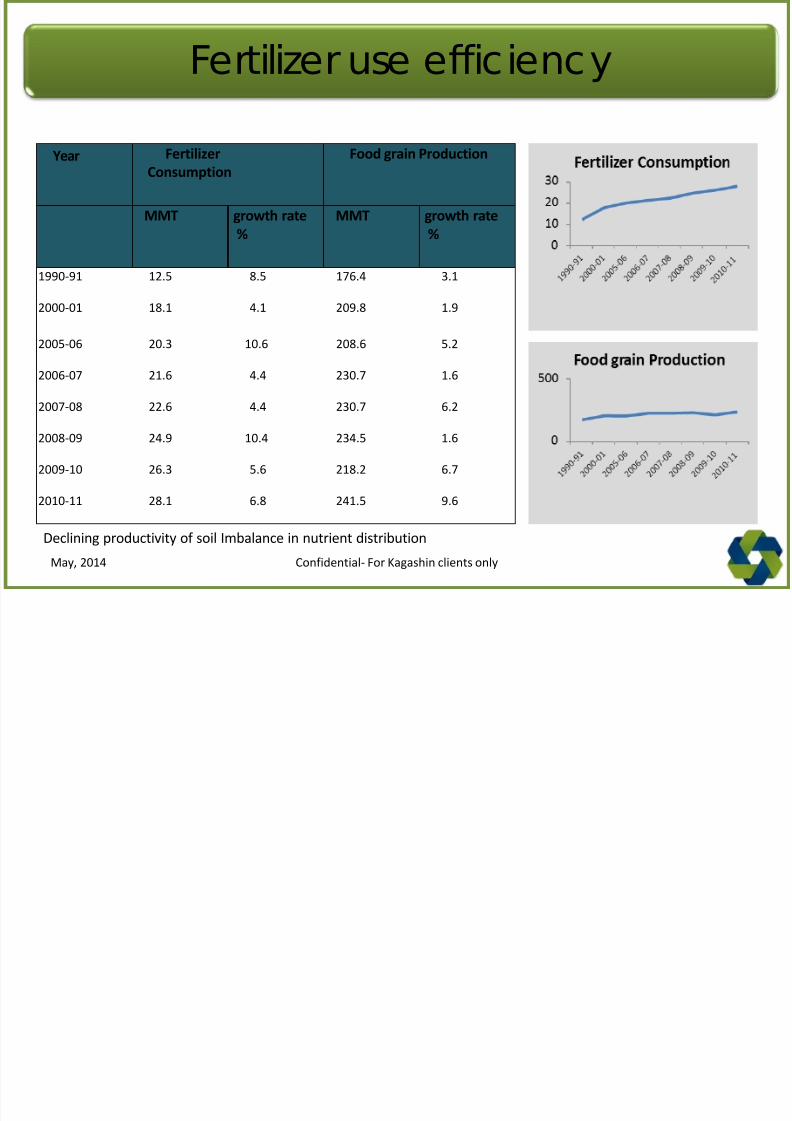
Fertilizer use efficiency
Year Fertilizer
Consumption
Food grain Production
MMT growth rate
%
MMT growth rate
%
1990-91 12.5 8.5 176.4 3.1
2000-01 18.1 4.1 209.8 1.9
2005-06 20.3 10.6 208.6 5.2
2006-07 21.6 4.4 230.7 1.6
2007-08 22.6 4.4 230.7 6.2
2008-09 24.9 10.4 234.5 1.6
2009-10 26.3 5.6 218.2 6.7
2010-11 28.1 6.8 241.5 9.6
Declining productivity of soil Imbalance in nutrient distribution
Confidential- For Kagashin clients onlyMay, 2014
8/11/2019 IndianAgriculture a Snapshot
http://slidepdf.com/reader/full/indianagriculture-a-snapshot 47/89
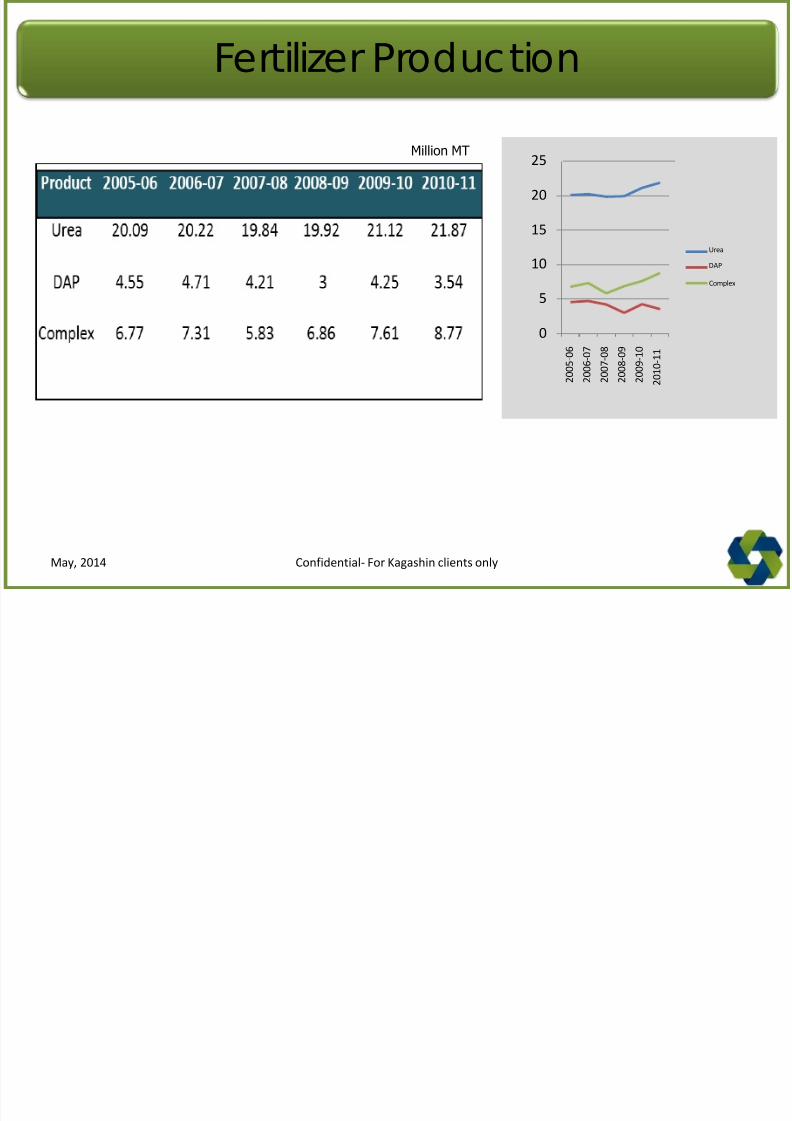
Fertilizer Production
Complex
5
0
10
25
20
15
2 0 0 5 - 0 6
2 0 0 6 - 0 7
2 0 0 7 - 0 8
2 0 0 8 - 0 9
2 0 0 9 - 1 0
2 0 1 0 - 1 1
Urea
DAP
Million MT
Confidential- For Kagashin clients onlyMay, 2014
I
8/11/2019 IndianAgriculture a Snapshot
http://slidepdf.com/reader/full/indianagriculture-a-snapshot 48/89
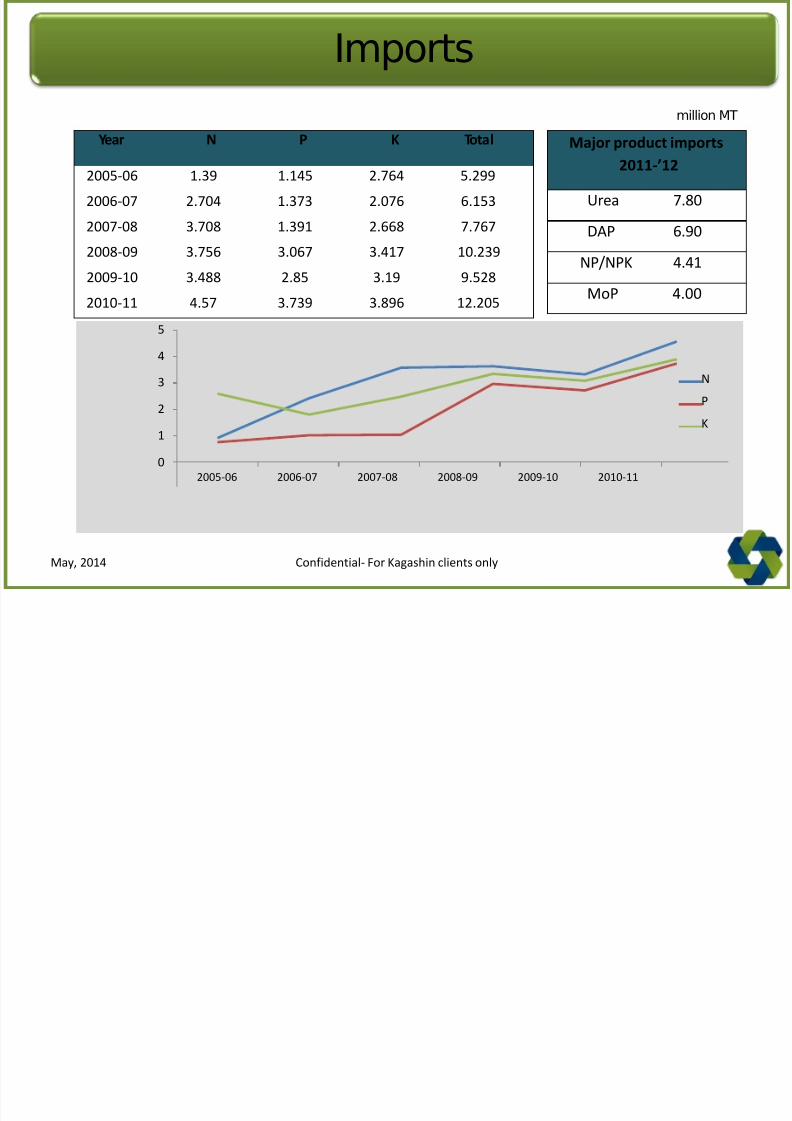
Imports
3
2
1
0
5
4
2005-06 2006-07 2007-08 2008-09 2009-10 2010-11
N
P
K
Year N P K Total
2005-06 1.39 1.145 2.764 5.299
2006-07 2.704 1.373 2.076 6.153
2007-08 3.708 1.391 2.668 7.767
2008-09 3.756 3.067 3.417 10.239
2009-10 3.488 2.85 3.19 9.5282010-11 4.57 3.739 3.896 12.205
Major product imports2011-’12
Urea 7.80
DAP 6.90
NP/NPK 4.41
MoP 4.00
million MT
Confidential- For Kagashin clients onlyMay, 2014
8/11/2019 IndianAgriculture a Snapshot
http://slidepdf.com/reader/full/indianagriculture-a-snapshot 49/89
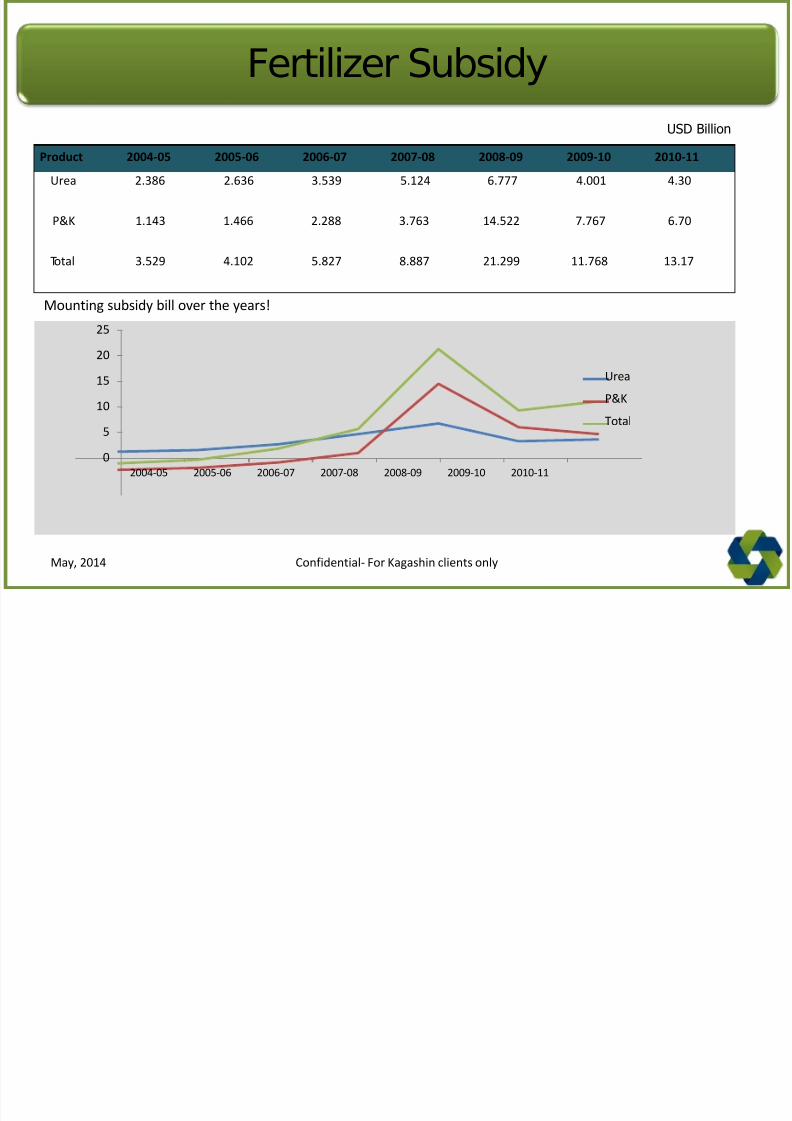
Fertilizer Subsidy
Mounting subsidy bill over the years!
25
20
15
10
5
0
2004-05 2005-06 2006-07 2007-08 2008-09 2009-10 2010-11
Urea
P&K
Total
Product 2004-05 2005-06 2006-07 2007-08 2008-09 2009-10 2010-11
Urea 2.386 2.636 3.539 5.124 6.777 4.001 4.30
P&K 1.143 1.466 2.288 3.763 14.522 7.767 6.70
Total 3.529 4.102 5.827 8.887 21.299 11.768 13.17
USD Billion
Confidential- For Kagashin clients onlyMay, 2014
8/11/2019 IndianAgriculture a Snapshot
http://slidepdf.com/reader/full/indianagriculture-a-snapshot 50/89
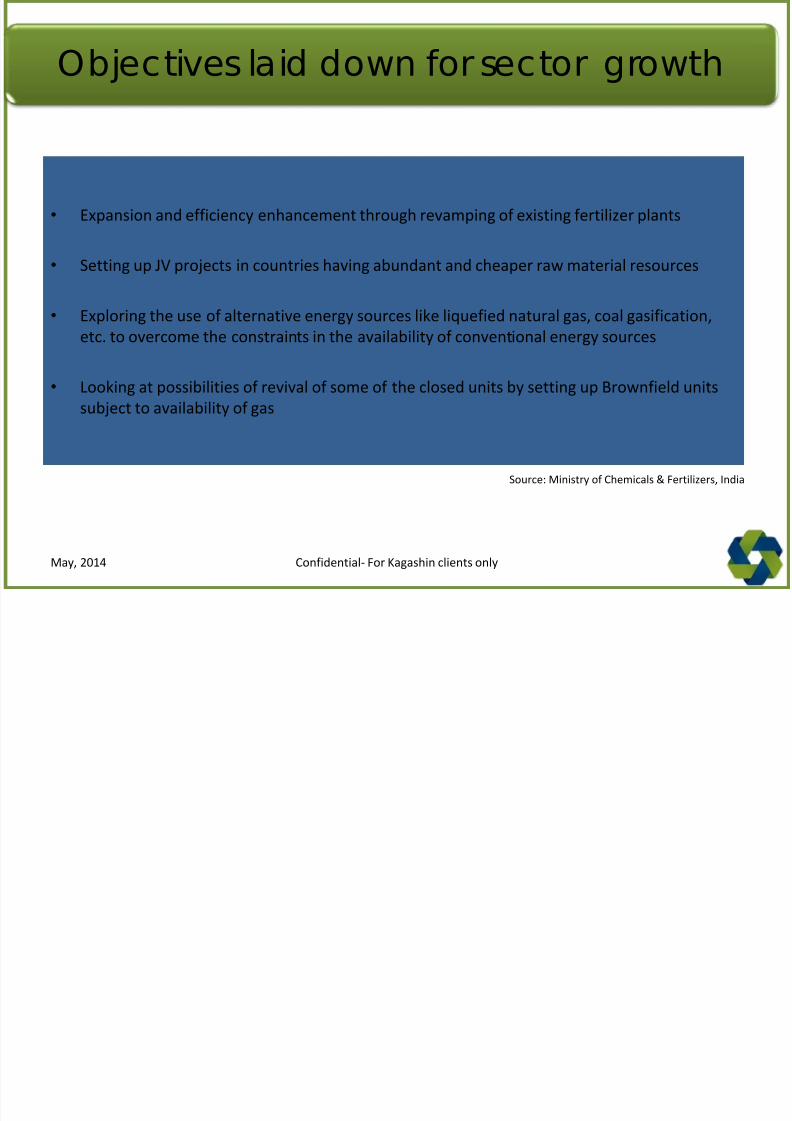
Objectives laid down for sector growth
• Expansion and efficiency enhancement through revamping of existing fertilizer plants
• Setting up JV projects in countries having abundant and cheaper raw material resources
• Exploring the use of alternative energy sources like liquefied natural gas, coal gasification,
etc. to overcome the constraints in the availability of conventional energy sources
• Looking at possibilities of revival of some of the closed units by setting up Brownfield units
subject to availability of gas
Source: Ministry of Chemicals & Fertilizers, India
Confidential- For Kagashin clients onlyMay, 2014
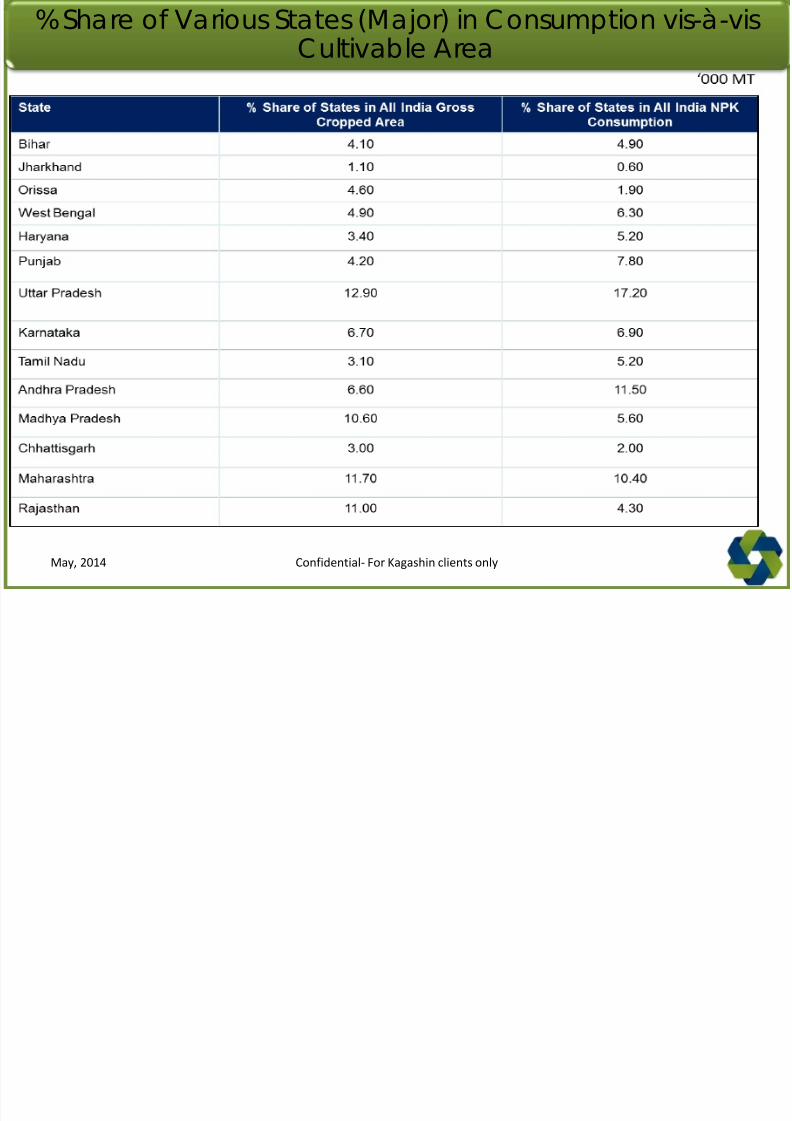
% Share of Various States (Major) in Consumption vis-à-vis
8/11/2019 IndianAgriculture a Snapshot
http://slidepdf.com/reader/full/indianagriculture-a-snapshot 51/89
Cultivable Area
Confidential- For Kagashin clients onlyMay, 2014
8/11/2019 IndianAgriculture a Snapshot
http://slidepdf.com/reader/full/indianagriculture-a-snapshot 52/89
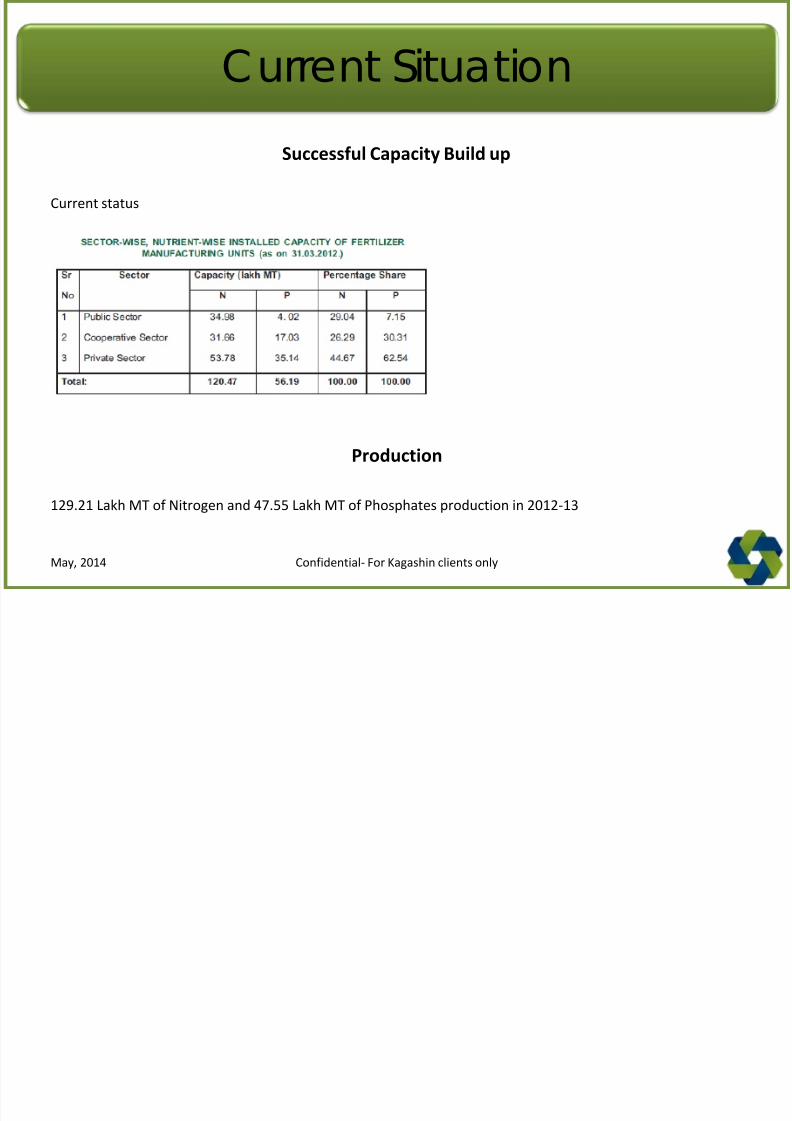
Current Situation
Successful Capacity Build up
Current status
Production
129.21 Lakh MT of Nitrogen and 47.55 Lakh MT of Phosphates production in 2012-13
Confidential- For Kagashin clients onlyMay, 2014
8/11/2019 IndianAgriculture a Snapshot
http://slidepdf.com/reader/full/indianagriculture-a-snapshot 53/89
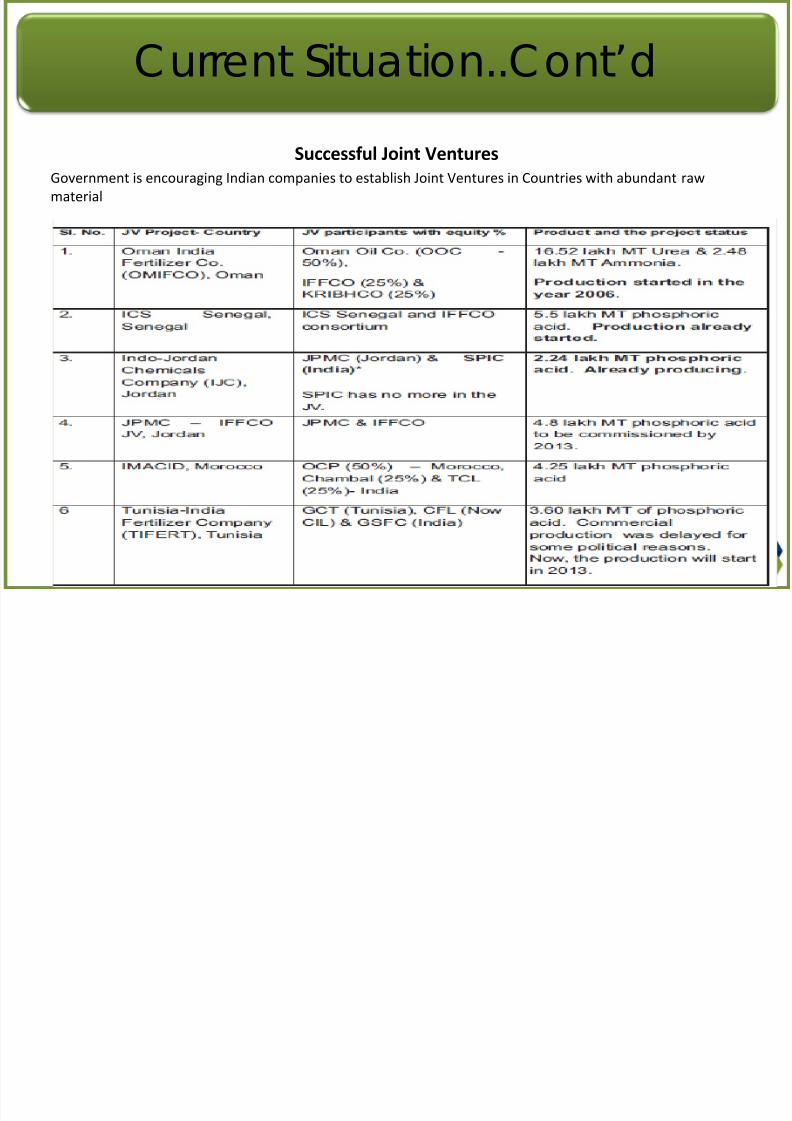
Successful Joint VenturesGovernment is encouraging Indian companies to establish Joint Ventures in Countries with abundant raw
material
Current Situation..Cont’d
Growth Drivers
8/11/2019 IndianAgriculture a Snapshot
http://slidepdf.com/reader/full/indianagriculture-a-snapshot 54/89
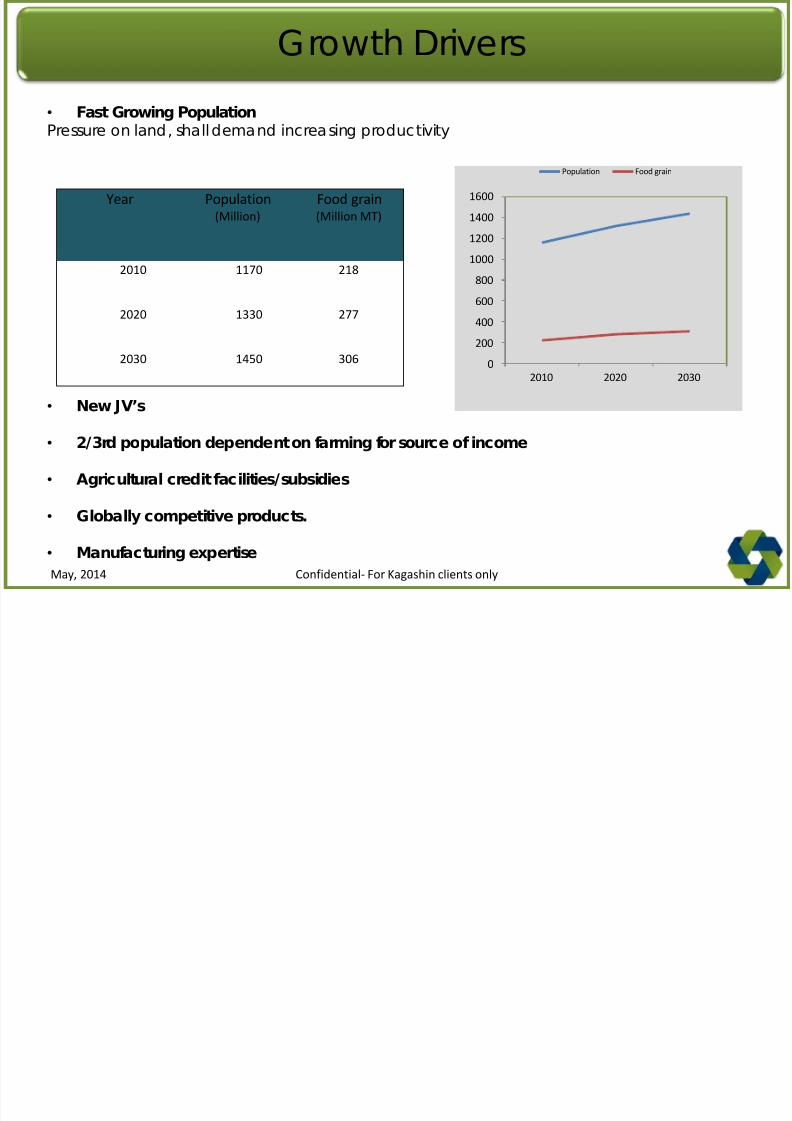
Growth Drivers
• Fast Growing PopulationPressure on land, shall demand increasing productivity
• New JV’s
• 2/3rd population dependent on farming for source of income
• Agricultural credit facilities/subsidies
• Globally competitive products.
• Manufacturing expertise
Year Population(Million)
Food grain(Million MT)
2010 1170 218
2020 1330 277
2030 1450 306
1600
1400
1200
1000
800600
400
200
02010 2020 2030
Population Food grain
Confidential- For Kagashin clients onlyMay, 2014
Challenges
8/11/2019 IndianAgriculture a Snapshot
http://slidepdf.com/reader/full/indianagriculture-a-snapshot 55/89
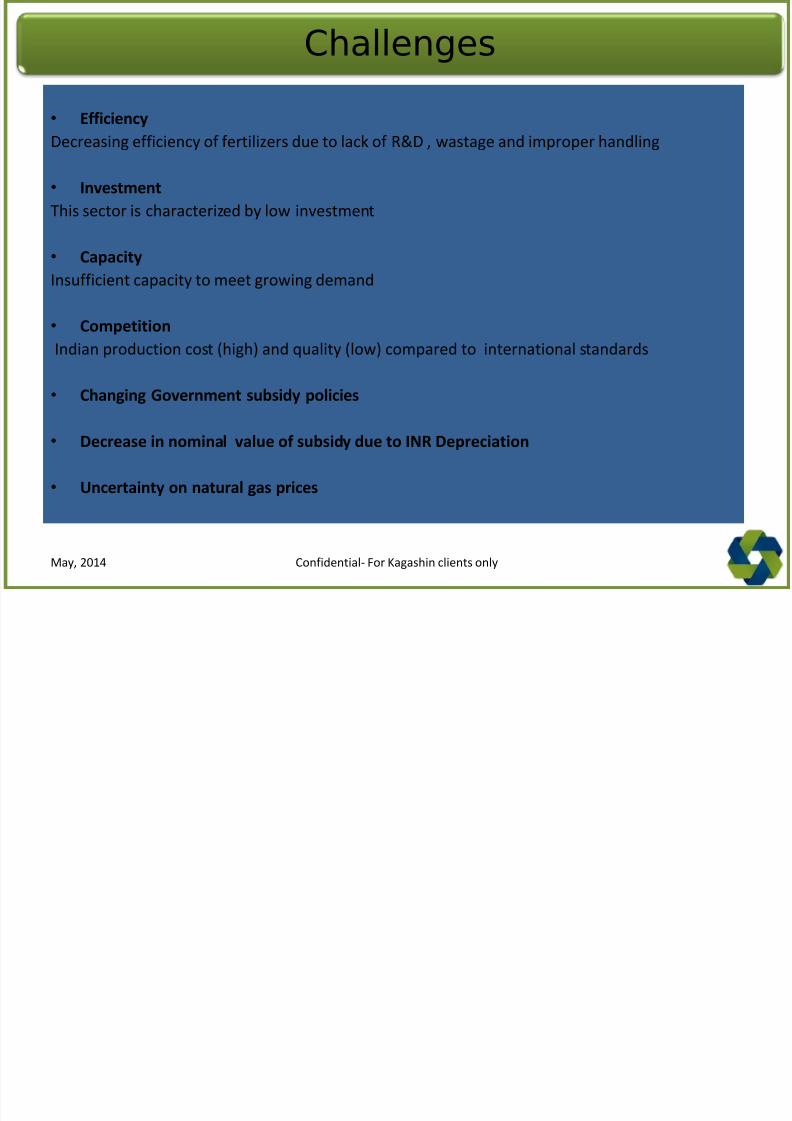
Challenges
• Efficiency
Decreasing efficiency of fertilizers due to lack of R&D , wastage and improper handling
• Investment
This sector is characterized by low investment
• Capacity
Insufficient capacity to meet growing demand
• Competition
Indian production cost (high) and quality (low) compared to international standards
• Changing Government subsidy policies
• Decrease in nominal value of subsidy due to INR Depreciation
• Uncertainty on natural gas prices
Confidential- For Kagashin clients onlyMay, 2014
8/11/2019 IndianAgriculture a Snapshot
http://slidepdf.com/reader/full/indianagriculture-a-snapshot 56/89
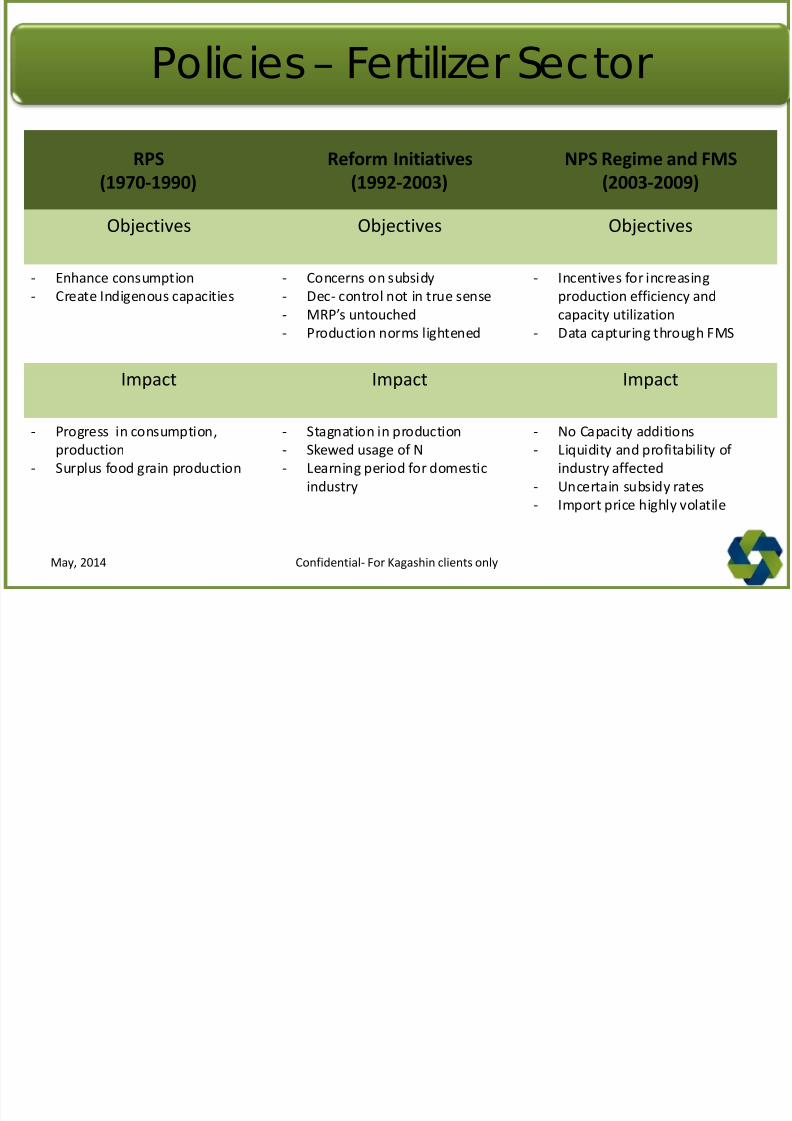
Policies – Fertilizer Sector
RPS
(1970-1990)
Reform Initiatives
(1992-2003)
NPS Regime and FMS
(2003-2009)
Objectives Objectives Objectives
- Enhance consumption- Create Indigenous capacities - Concerns on subsidy- Dec- control not in true sense
- MRP’s untouched
- Production norms lightened
- Incentives for increasingproduction efficiency and
capacity utilization
- Data capturing through FMS
Impact Impact Impact
- Progress in consumption,
production
- Surplus food grain production
- Stagnation in production
- Skewed usage of N
- Learning period for domestic
industry
- No Capacity additions
- Liquidity and profitability of
industry affected
- Uncertain subsidy rates
- Import price highly volatile
Confidential- For Kagashin clients onlyMay, 2014
8/11/2019 IndianAgriculture a Snapshot
http://slidepdf.com/reader/full/indianagriculture-a-snapshot 57/89
8/11/2019 IndianAgriculture a Snapshot
http://slidepdf.com/reader/full/indianagriculture-a-snapshot 58/89
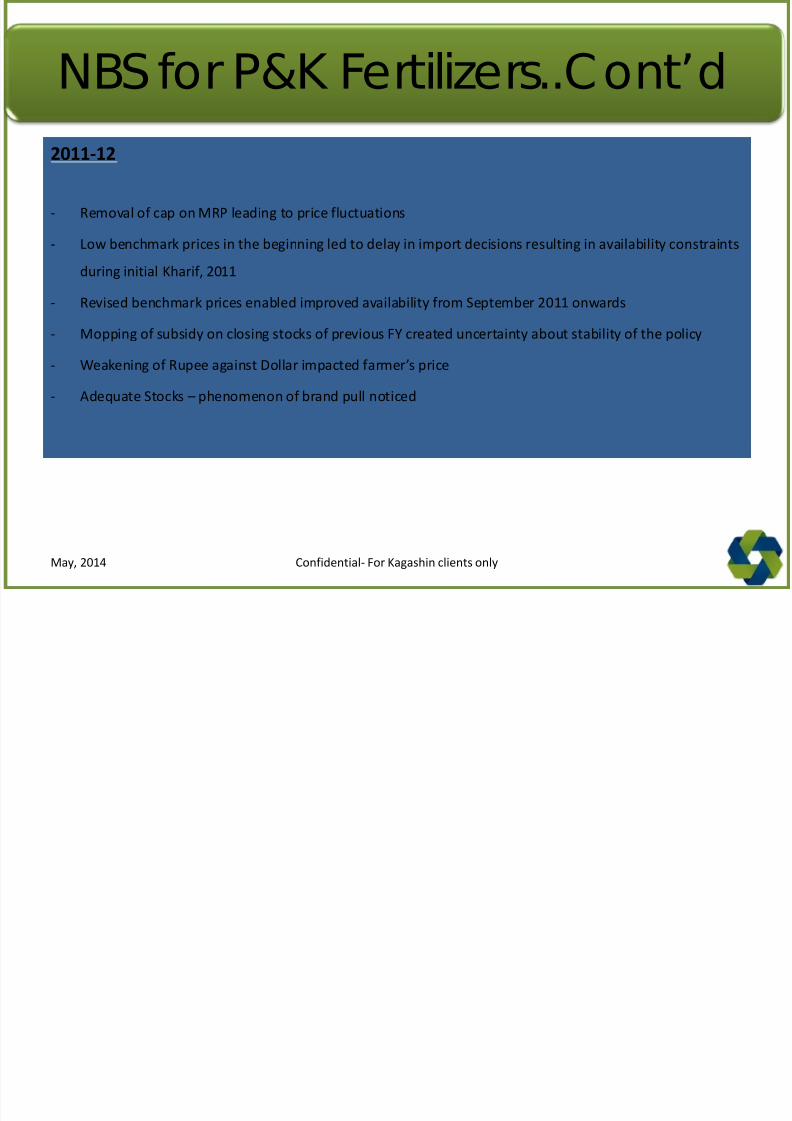
NBS for P&K Fertilizers..Cont’d
2011-12
- Removal of cap on MRP leading to price fluctuations
- Low benchmark prices in the beginning led to delay in import decisions resulting in availability constraints
during initial Kharif, 2011
- Revised benchmark prices enabled improved availability from September 2011 onwards
- Mopping of subsidy on closing stocks of previous FY created uncertainty about stability of the policy
- Weakening of Rupee against Dollar impacted farmer’s price
- Adequate Stocks – phenomenon of brand pull noticed
Confidential- For Kagashin clients onlyMay, 2014
Govt intention of extending NBSPolicy to
8/11/2019 IndianAgriculture a Snapshot
http://slidepdf.com/reader/full/indianagriculture-a-snapshot 59/89
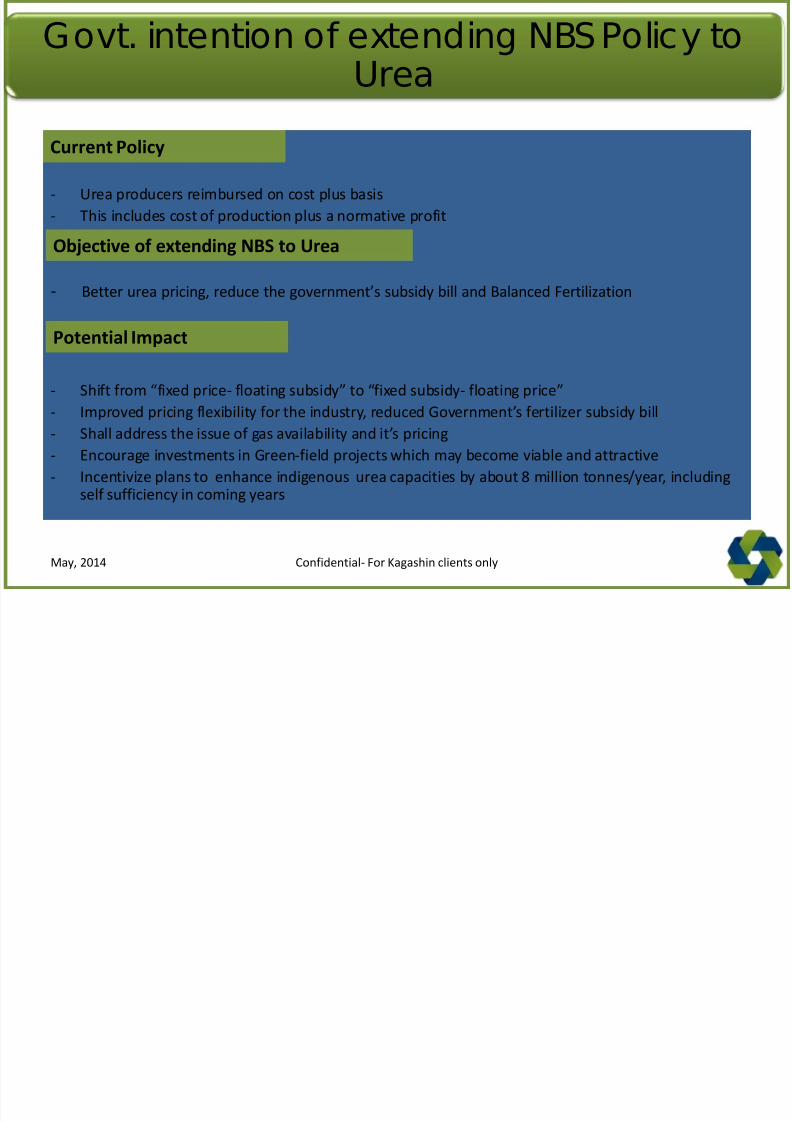
Govt. intention of extending NBS Policy toUrea
- Urea producers reimbursed on cost plus basis
- This includes cost of production plus a normative profit
- Better urea pricing, reduce the government’s subsidy bill and Balanced Fertilization
- Shift from “fixed price- floating subsidy” to “fixed subsidy- floating price”
- Improved pricing flexibility for the industry, reduced Government’s fertilizer subsidy bill
- Shall address the issue of gas availability and it’s pricing
- Encourage investments in Green-field projects which may become viable and attractive
- Incentivize plans to enhance indigenous urea capacities by about 8 million tonnes/year, includingself sufficiency in coming years
Objective of extending NBS to Urea
Current Policy
Potential Impact
Confidential- For Kagashin clients onlyMay, 2014
MobileFMS ( FMS) initiative moving towards
8/11/2019 IndianAgriculture a Snapshot
http://slidepdf.com/reader/full/indianagriculture-a-snapshot 60/89
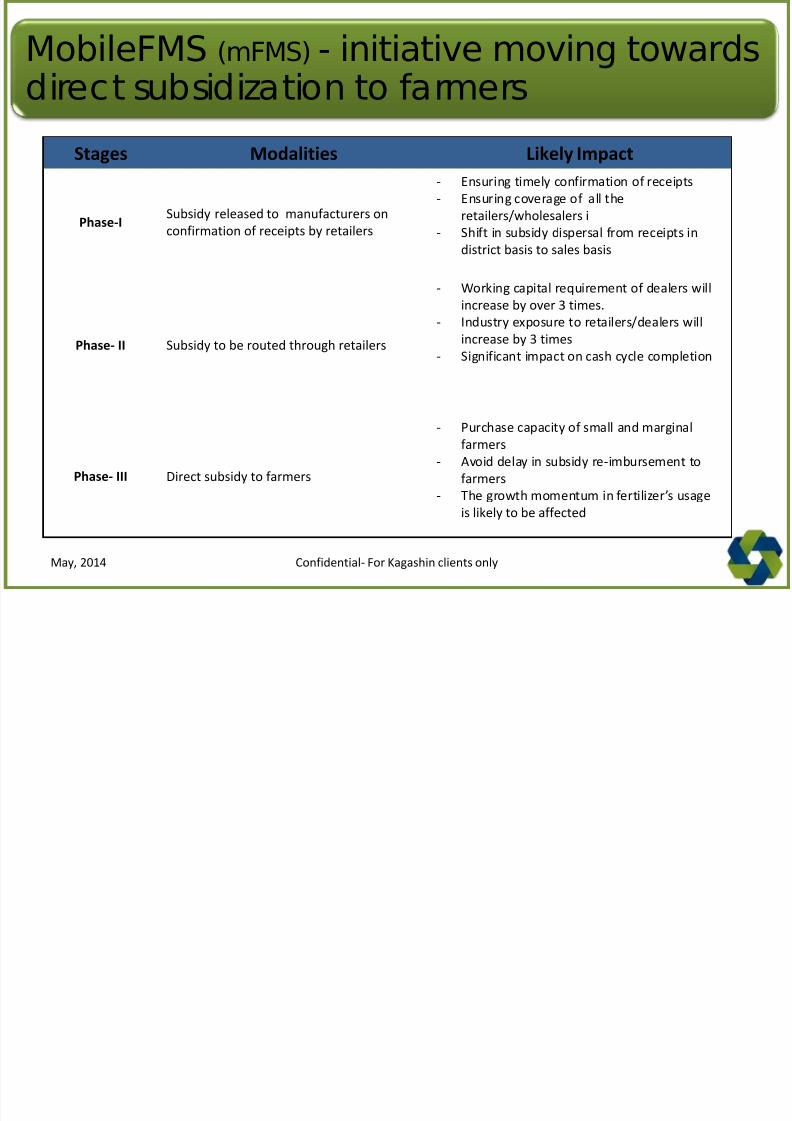
MobileFMS (mFMS) - initiative moving towardsdirect subsidization to farmers
Stages Modalities Likely Impact
Phase-ISubsidy released to manufacturers on
confirmation of receipts by retailers
- Ensuring timely confirmation of receipts
- Ensuring coverage of all the
retailers/wholesalers i
- Shift in subsidy dispersal from receipts in
district basis to sales basis
Phase- II Subsidy to be routed through retailers
- Working capital requirement of dealers willincrease by over 3 times.
- Industry exposure to retailers/dealers will
increase by 3 times
- Significant impact on cash cycle completion
Phase- III Direct subsidy to farmers
- Purchase capacity of small and marginalfarmers
- Avoid delay in subsidy re-imbursement to
farmers
- The growth momentum in fertilizer’s usage
is likely to be affected
Confidential- For Kagashin clients onlyMay, 2014
8/11/2019 IndianAgriculture a Snapshot
http://slidepdf.com/reader/full/indianagriculture-a-snapshot 61/89
Table of Contents
8/11/2019 IndianAgriculture a Snapshot
http://slidepdf.com/reader/full/indianagriculture-a-snapshot 62/89
Table of Contents
• Agriculture
- Overview
- Size
- Major Acreages
- Major Crops
- Growth drivers
- Major Issues
• Agrochemicals
- Overview
- Segments
- Consumption
- Growth Drivers
- Top Companies- Key Challenges
• Insecticides, Fungicides &
Herbicides- Demand Pattern In Indian Market
- Insecticides Market Share
- Fungicides Market Share
- Herbicides Market Share
• Fertilizers- Overview
- Consumption
- Fertilizer – Indian Scenario
- Usage
- Efficiency
- Production
- Imports
- Subsidy
- State Contribution
- Current Situation
- Growth Drivers
- Challenges
- Policies
• Seeds
- Overview
- Growth Drivers
- Production
- Current Status
- Total Cropped Area
- Field Crops: Hybrid Seed Market
- Vegetable Crops: Hybrid SeedMarket
- Impact of new technology
- Regulatory Framework &
Challenges
- Productivity Challenges
- Biotechnology & its effect
- Way Forward
- Summary
Confidential- For Kagashin clients onlyMay, 2014
8/11/2019 IndianAgriculture a Snapshot
http://slidepdf.com/reader/full/indianagriculture-a-snapshot 63/89
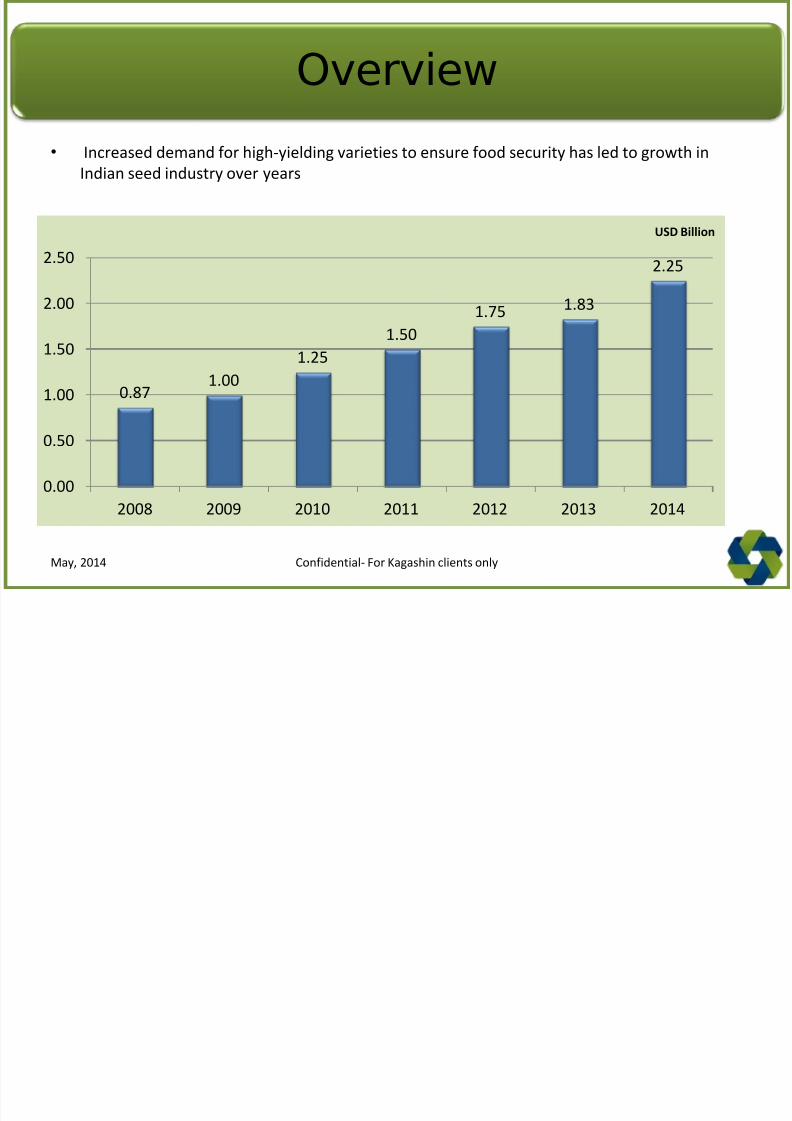
Overview
• Increased demand for high-yielding varieties to ensure food security has led to growth inIndian seed industry over years
0.871.00
1.25
1.50
1.75 1.83
2.25
0.00
0.50
1.00
1.50
2.00
2.50
2008 2009 2010 2011 2012 2013 2014
USD Billion
Confidential- For Kagashin clients onlyMay, 2014
8/11/2019 IndianAgriculture a Snapshot
http://slidepdf.com/reader/full/indianagriculture-a-snapshot 64/89
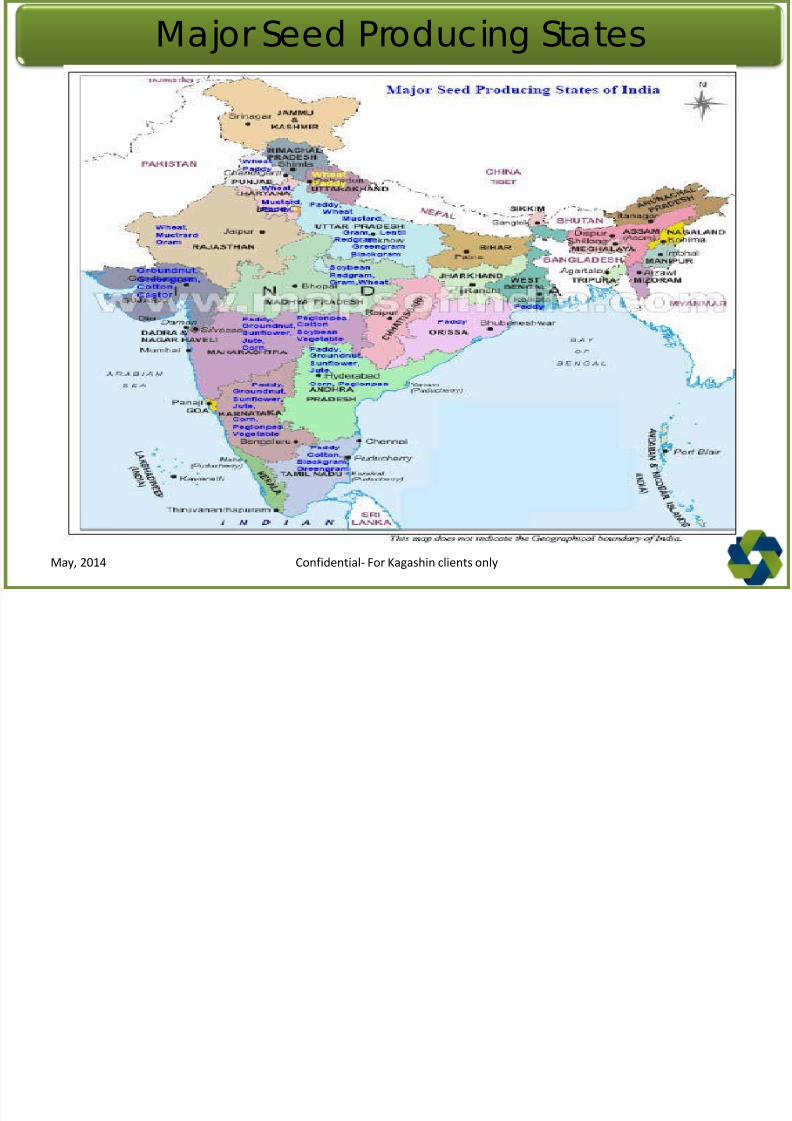
Major Seed Producing States
8/11/2019 IndianAgriculture a Snapshot
http://slidepdf.com/reader/full/indianagriculture-a-snapshot 65/89
Major Seed Producing States
Confidential- For Kagashin clients onlyMay, 2014
Growth Drivers
8/11/2019 IndianAgriculture a Snapshot
http://slidepdf.com/reader/full/indianagriculture-a-snapshot 66/89
Growth Drivers
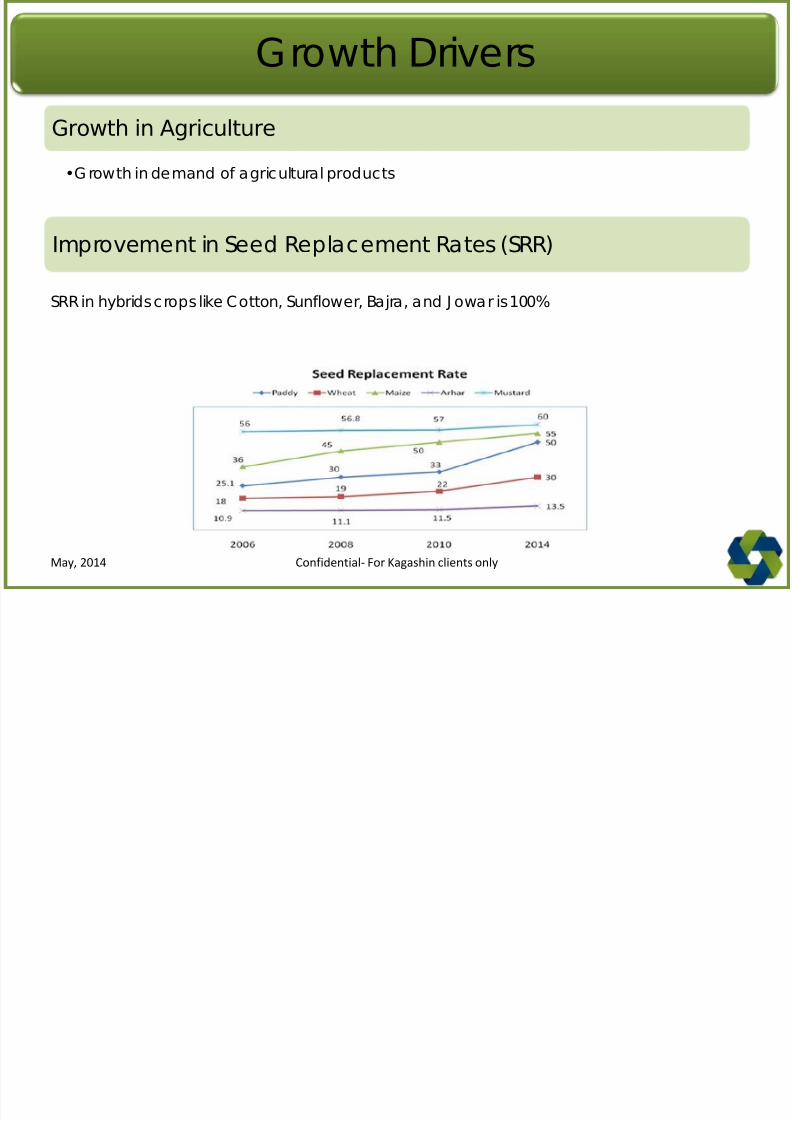
Growth in Agriculture
•Growth in demand of agricultural products
Improvement in Seed Replacement Rates (SRR)
SRR in hybrids crops like Cotton, Sunflower, Bajra, and J owar is 100%
Confidential- For Kagashin clients onlyMay, 2014
8/11/2019 IndianAgriculture a Snapshot
http://slidepdf.com/reader/full/indianagriculture-a-snapshot 67/89
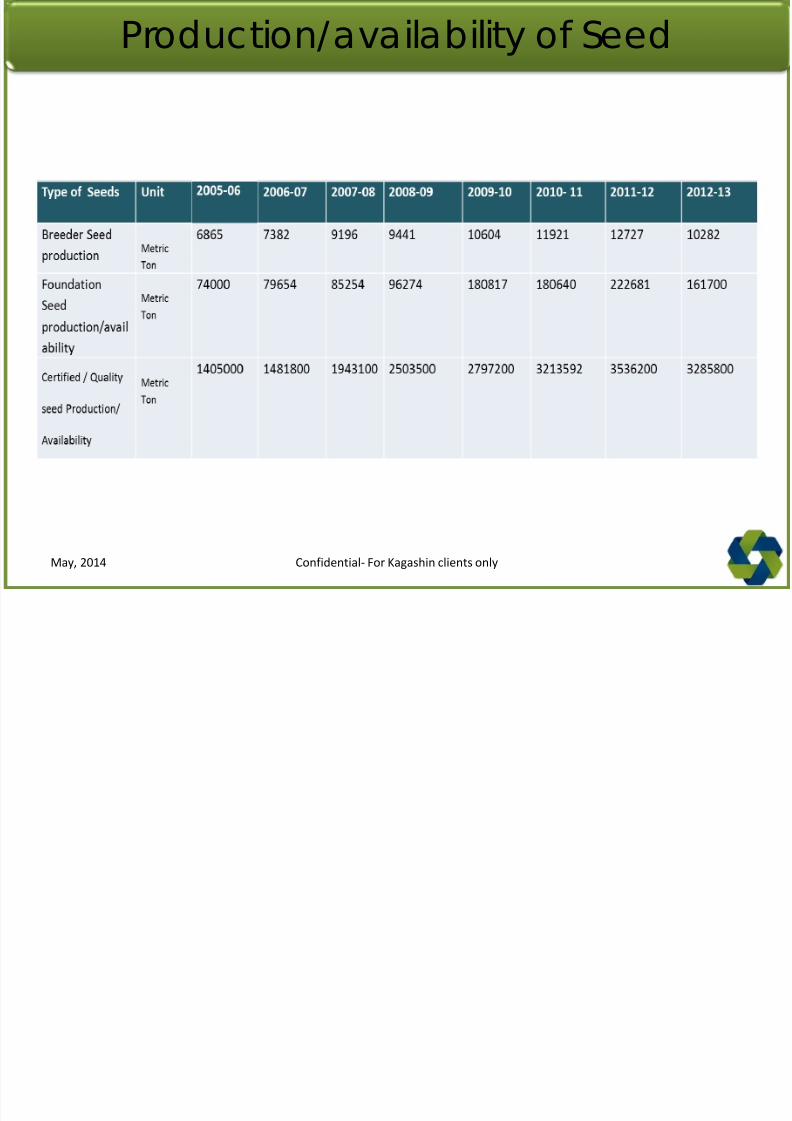
Production/availability of Seed
8/11/2019 IndianAgriculture a Snapshot
http://slidepdf.com/reader/full/indianagriculture-a-snapshot 68/89
oduc o /a a ab y o Seed
Confidential- For Kagashin clients onlyMay, 2014
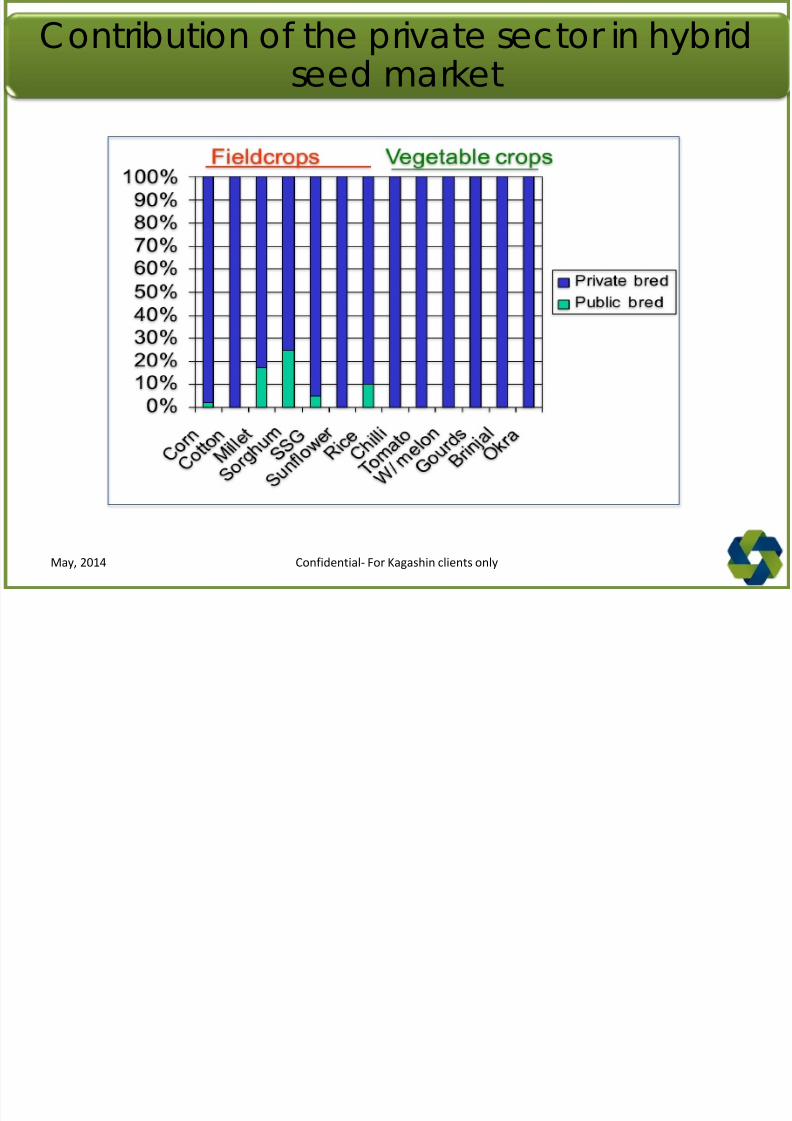
Contribution of the private sector in hybrid
8/11/2019 IndianAgriculture a Snapshot
http://slidepdf.com/reader/full/indianagriculture-a-snapshot 69/89
p yseed market
Confidential- For Kagashin clients onlyMay, 2014
E olution of the Indian Seed Industr
8/11/2019 IndianAgriculture a Snapshot
http://slidepdf.com/reader/full/indianagriculture-a-snapshot 70/89
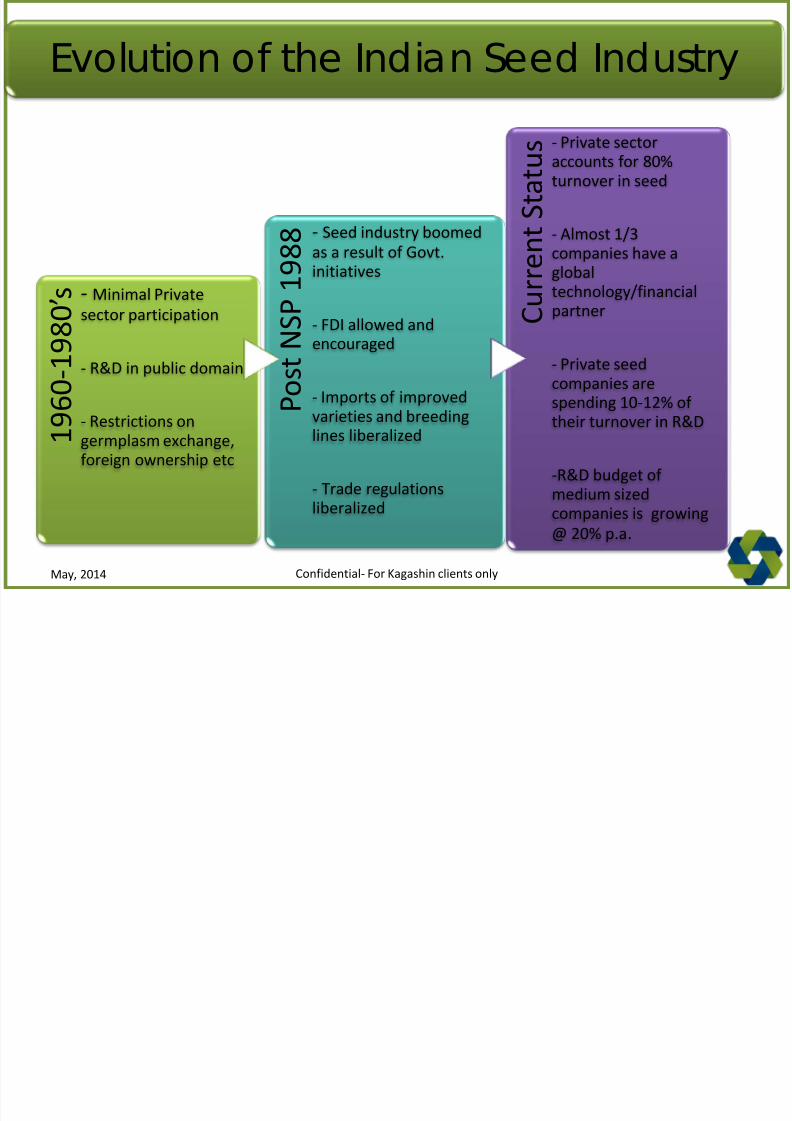
Evolution of the Indian Seed Industry
1 9
6 0 - 1 9 8 0 ’ s- Minimal Private
sector participation
- R&D in public domain
- Restrictions ongermplasm exchange,foreign ownership etc
P o s t N S P 1
9 8 8- Seed industry boomed
as a result of Govt.initiatives
- FDI allowed andencouraged
- Imports of improvedvarieties and breedinglines liberalized
- Trade regulationsliberalized
C u r
r e n t S t a t u s- Private sectoraccounts for 80%
turnover in seed
- Almost 1/3companies have aglobal
technology/financialpartner
- Private seedcompanies arespending 10-12% of
their turnover in R&D
-R&D budget ofmedium sizedcompanies is growing
@ 20% p.a.
Confidential- For Kagashin clients onlyMay, 2014
C
8/11/2019 IndianAgriculture a Snapshot
http://slidepdf.com/reader/full/indianagriculture-a-snapshot 71/89
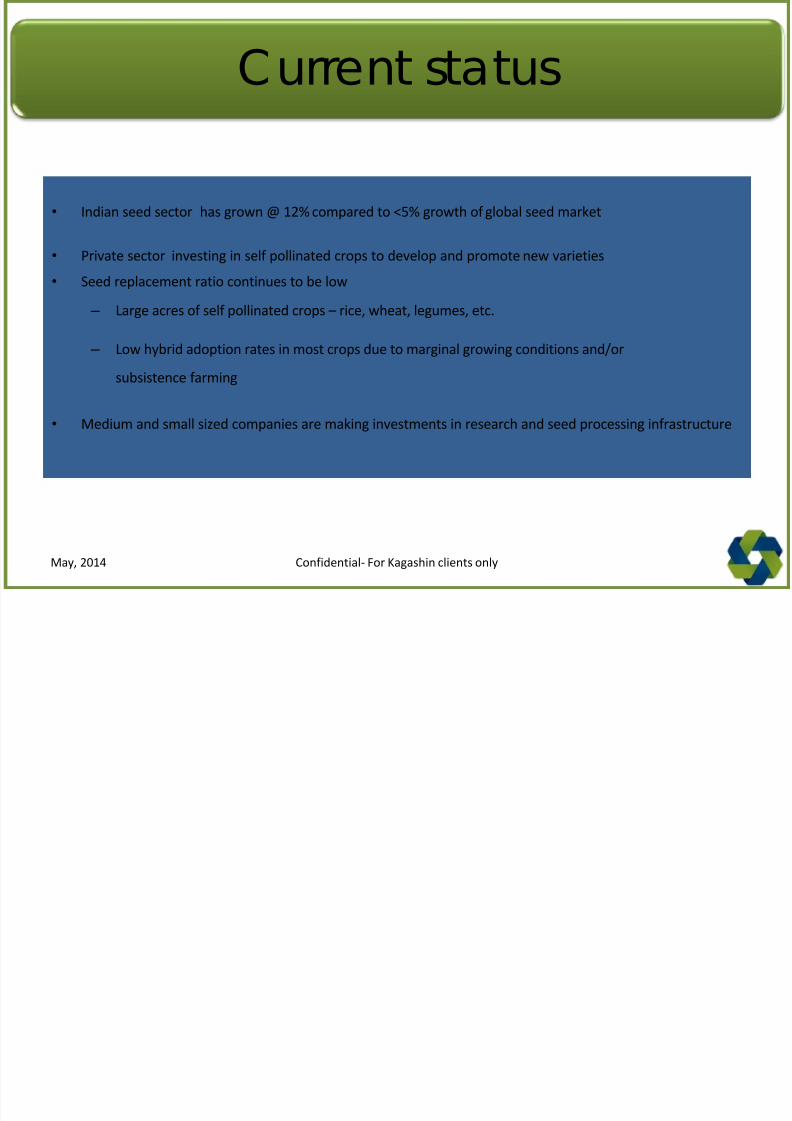
Current status
• Indian seed sector has grown @ 12% compared to <5% growth of global seed market
• Private sector investing in self pollinated crops to develop and promote new varieties
• Seed replacement ratio continues to be low – Large acres of self pollinated crops – rice, wheat, legumes, etc.
– Low hybrid adoption rates in most crops due to marginal growing conditions and/or
subsistence farming
• Medium and small sized companies are making investments in research and seed processing infrastructure
Confidential- For Kagashin clients onlyMay, 2014
Total Cropped Area
8/11/2019 IndianAgriculture a Snapshot
http://slidepdf.com/reader/full/indianagriculture-a-snapshot 72/89
Cotton
Cor
n Mille
t
Vegetables
Sunflower
Sorghum
(Kh)
Padd
y
Whea
t
Sugarcane
Potat
o Groundnu
t
Soyabean
Gram
Mustar
d
Tur Sorghum
(Rabi)
Other
s
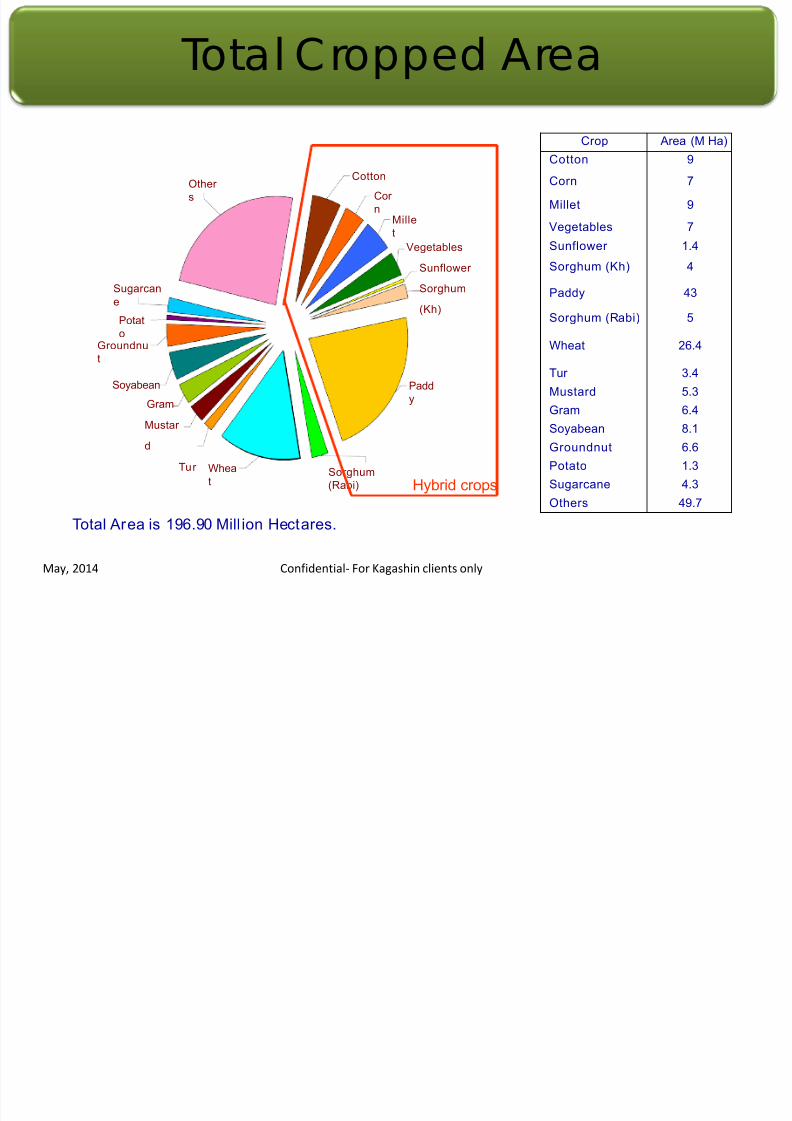
Total Area is 196.90 Mill ion Hectares.
Total Cropped Area
Hybrid crops
Crop Area (M Ha)
Cotton 9
Corn 7
Millet 9
Vegetables 7
Sunflower 1.4
Sorghum (Kh) 4
Paddy 43
Sorghum (Rabi) 5
Wheat 26.4
Tur 3.4
Mustard 5.3
Gram 6.4
Soyabean 8.1
Groundnut 6.6
Potato 1.3
Sugarcane 4.3
Others 49.7
Confidential- For Kagashin clients onlyMay, 2014
8/11/2019 IndianAgriculture a Snapshot
http://slidepdf.com/reader/full/indianagriculture-a-snapshot 73/89
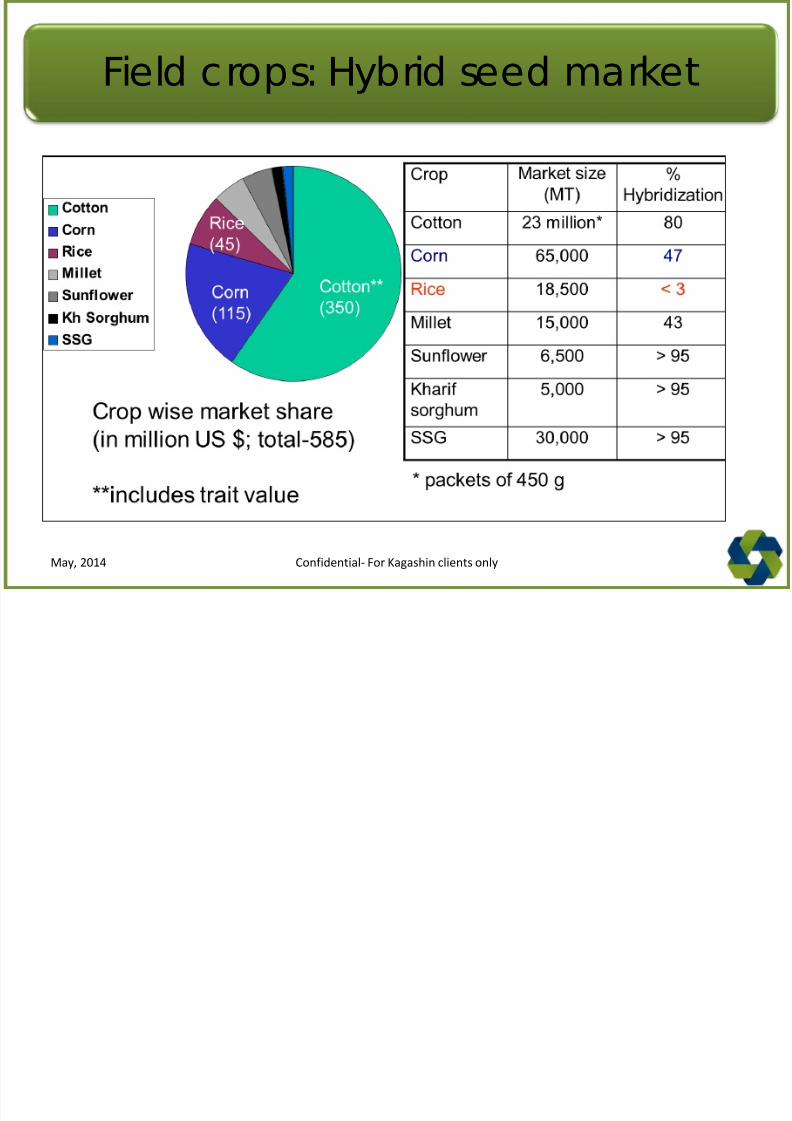
Field crops: Hybrid seed market
Confidential- For Kagashin clients onlyMay, 2014
Growth trend of key field crops’ hybrid seed
8/11/2019 IndianAgriculture a Snapshot
http://slidepdf.com/reader/full/indianagriculture-a-snapshot 74/89
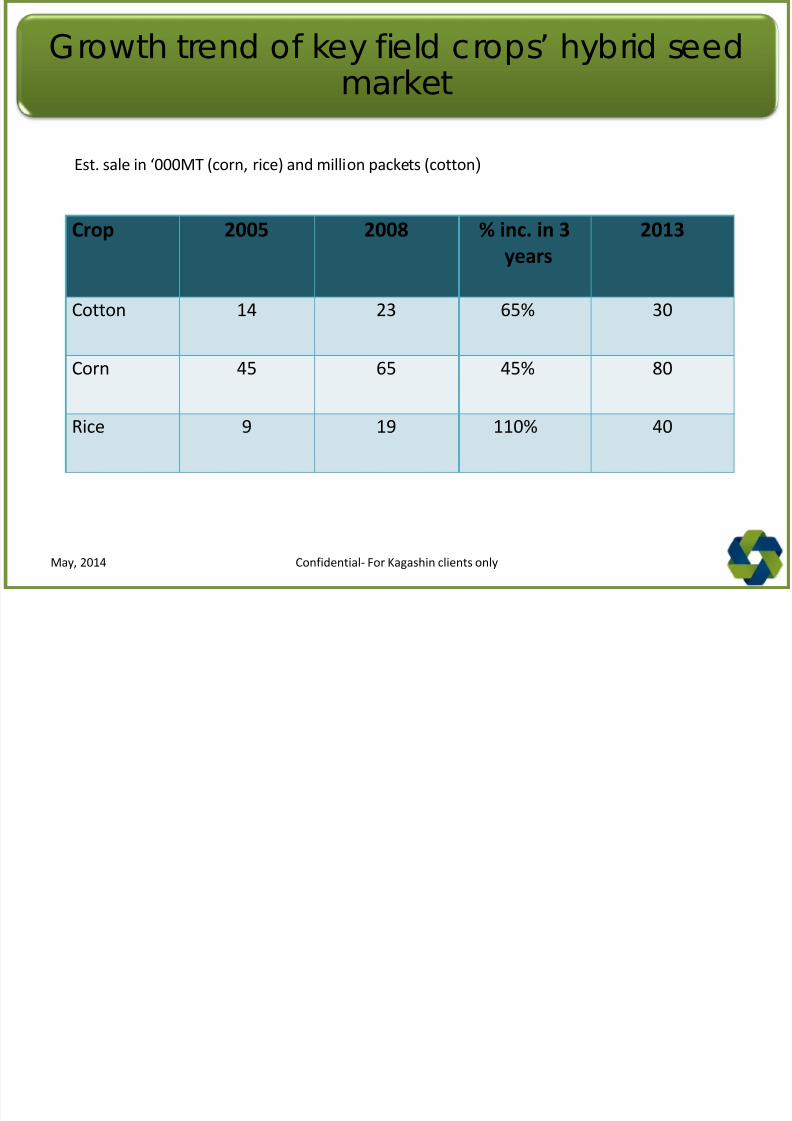
Growth trend of key field crops hybrid seedmarket
Est. sale in ‘000MT (corn, rice) and million packets (cotton)
Crop 2005 2008 % inc. in 3
years
2013
Cotton 14 23 65% 30
Corn 45 65 45% 80
Rice 9 19 110% 40
Confidential- For Kagashin clients onlyMay, 2014
V bl H b id d k
8/11/2019 IndianAgriculture a Snapshot
http://slidepdf.com/reader/full/indianagriculture-a-snapshot 75/89
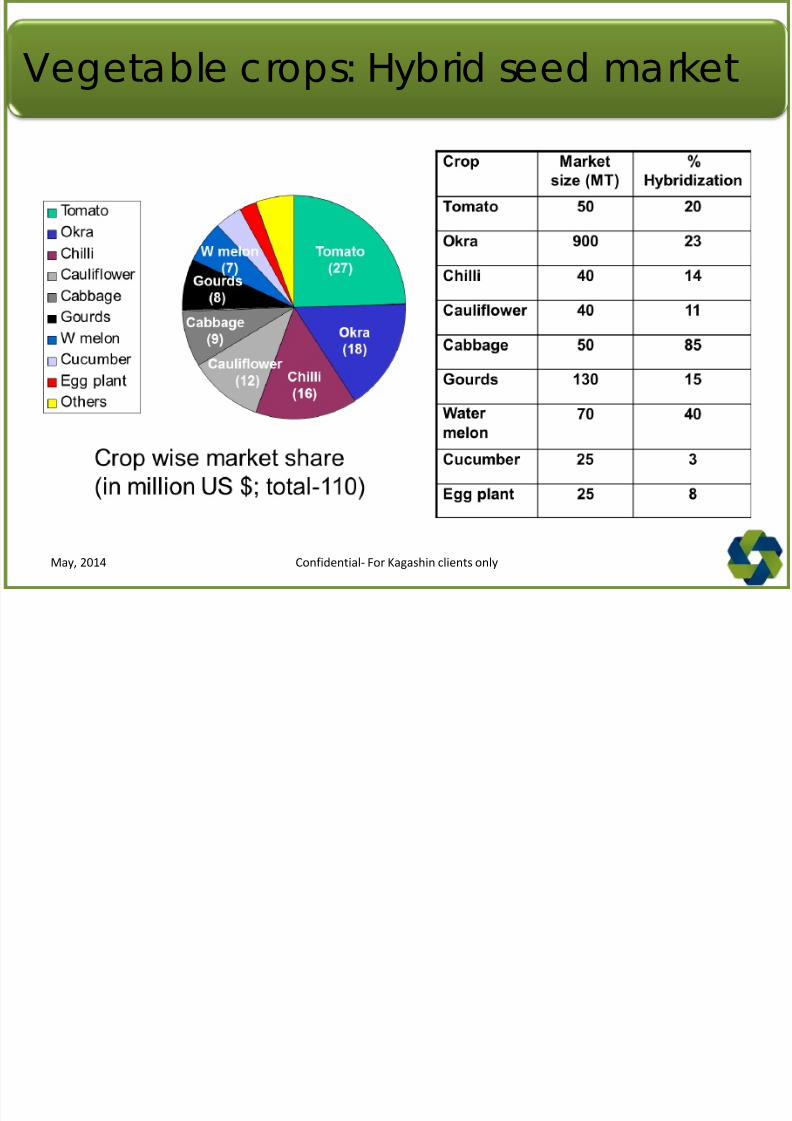
Vegetable crops: Hybrid seed market
Confidential- For Kagashin clients onlyMay, 2014
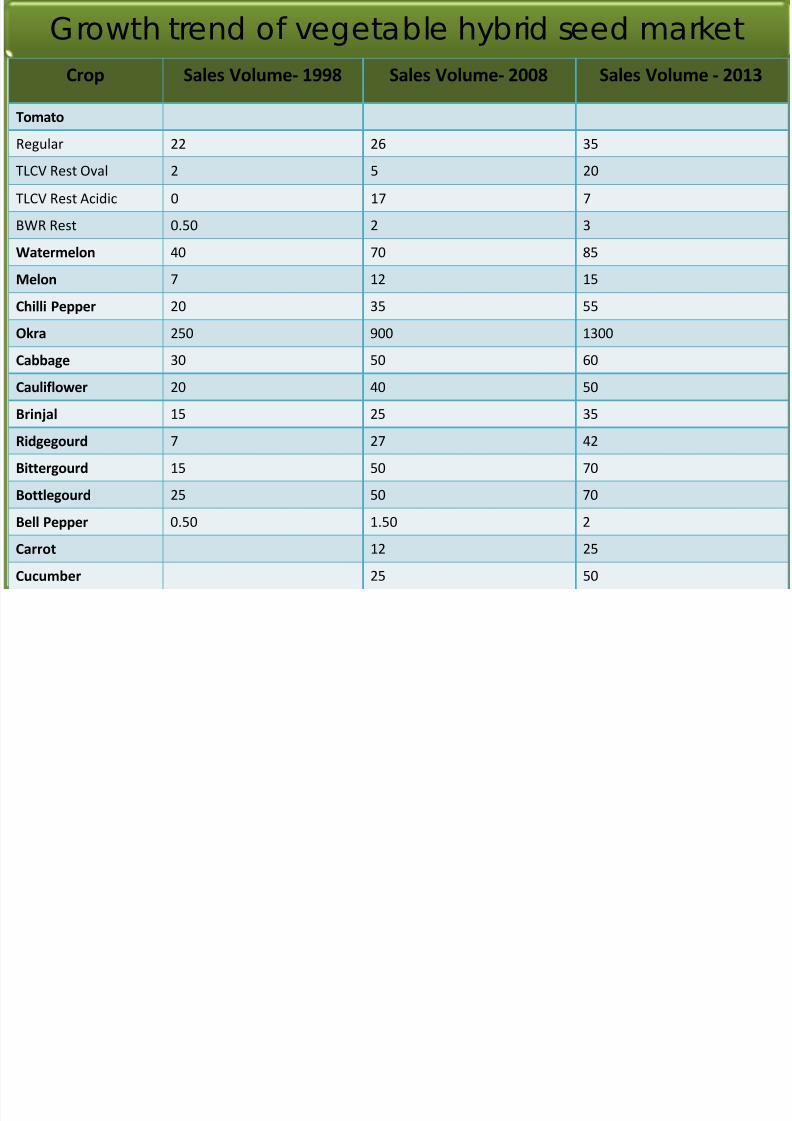
Growth trend of vegetable hybrid seed market
8/11/2019 IndianAgriculture a Snapshot
http://slidepdf.com/reader/full/indianagriculture-a-snapshot 76/89
Crop Sales Volume- 1998 Sales Volume- 2008 Sales Volume - 2013
Tomato
Regular 22 26 35TLCV Rest Oval 2 5 20
TLCV Rest Acidic 0 17 7
BWR Rest 0.50 2 3
Watermelon 40 70 85
Melon 7 12 15
Chilli Pepper 20 35 55
Okra 250 900 1300
Cabbage 30 50 60
Cauliflower 20 40 50
Brinjal 15 25 35
Ridgegourd 7 27 42
Bittergourd 15 50 70
Bottlegourd 25 50 70
Bell Pepper 0.50 1.50 2
Carrot 12 25
Cucumber 25 50
Impact of new technology on Cotton
8/11/2019 IndianAgriculture a Snapshot
http://slidepdf.com/reader/full/indianagriculture-a-snapshot 77/89
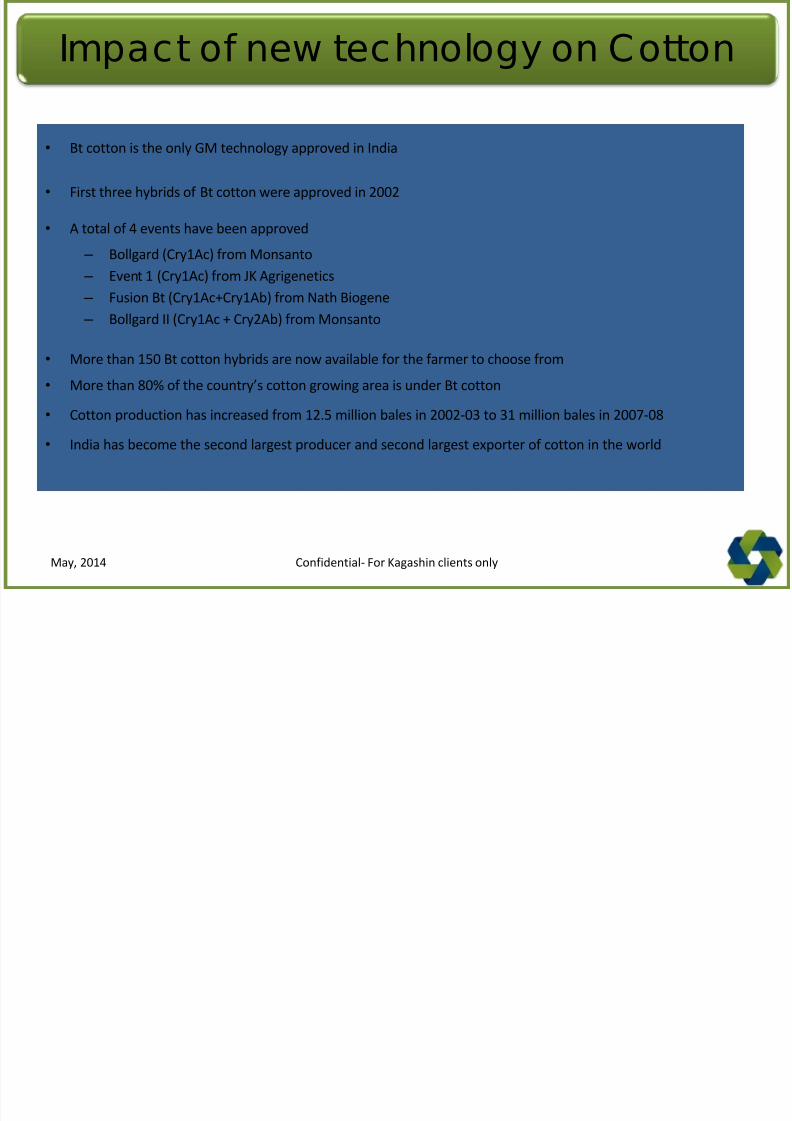
Impact of new technology on Cotton
• Bt cotton is the only GM technology approved in India
• First three hybrids of Bt cotton were approved in 2002
• A total of 4 events have been approved
– Bollgard (Cry1Ac) from Monsanto
– Event 1 (Cry1Ac) from JK Agrigenetics
– Fusion Bt (Cry1Ac+Cry1Ab) from Nath Biogene
– Bollgard II (Cry1Ac + Cry2Ab) from Monsanto
• More than 150 Bt cotton hybrids are now available for the farmer to choose from
• More than 80% of the country’s cotton growing area is under Bt cotton
• Cotton production has increased from 12.5 million bales in 2002-03 to 31 million bales in 2007-08
• India has become the second largest producer and second largest exporter of cotton in the world
Confidential- For Kagashin clients onlyMay, 2014
l f k
8/11/2019 IndianAgriculture a Snapshot
http://slidepdf.com/reader/full/indianagriculture-a-snapshot 78/89
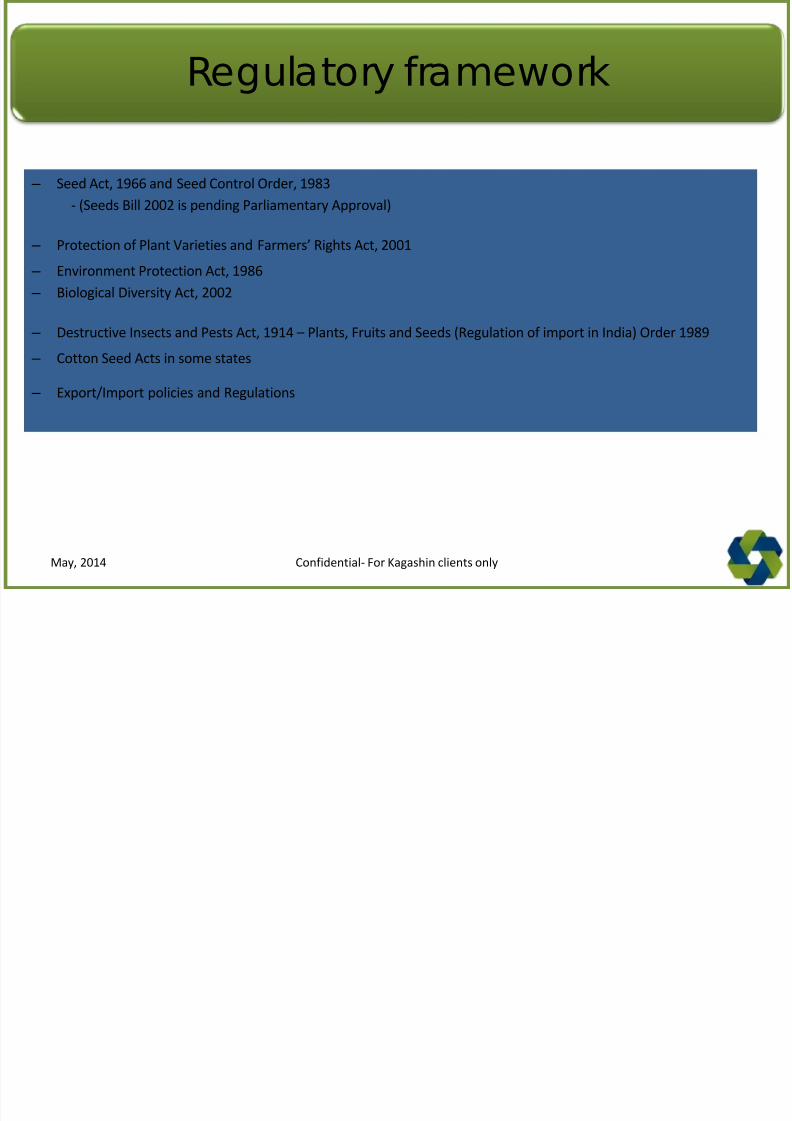
Regulatory framework
– Seed Act, 1966 and Seed Control Order, 1983
- (Seeds Bill 2002 is pending Parliamentary Approval)
– Protection of Plant Varieties and Farmers’ Rights Act, 2001
– Environment Protection Act, 1986
– Biological Diversity Act, 2002
– Destructive Insects and Pests Act, 1914 – Plants, Fruits and Seeds (Regulation of import in India) Order 1989
– Cotton Seed Acts in some states
– Export/Import policies and Regulations
Confidential- For Kagashin clients onlyMay, 2014
Regulatory Challenges
8/11/2019 IndianAgriculture a Snapshot
http://slidepdf.com/reader/full/indianagriculture-a-snapshot 79/89
g y g
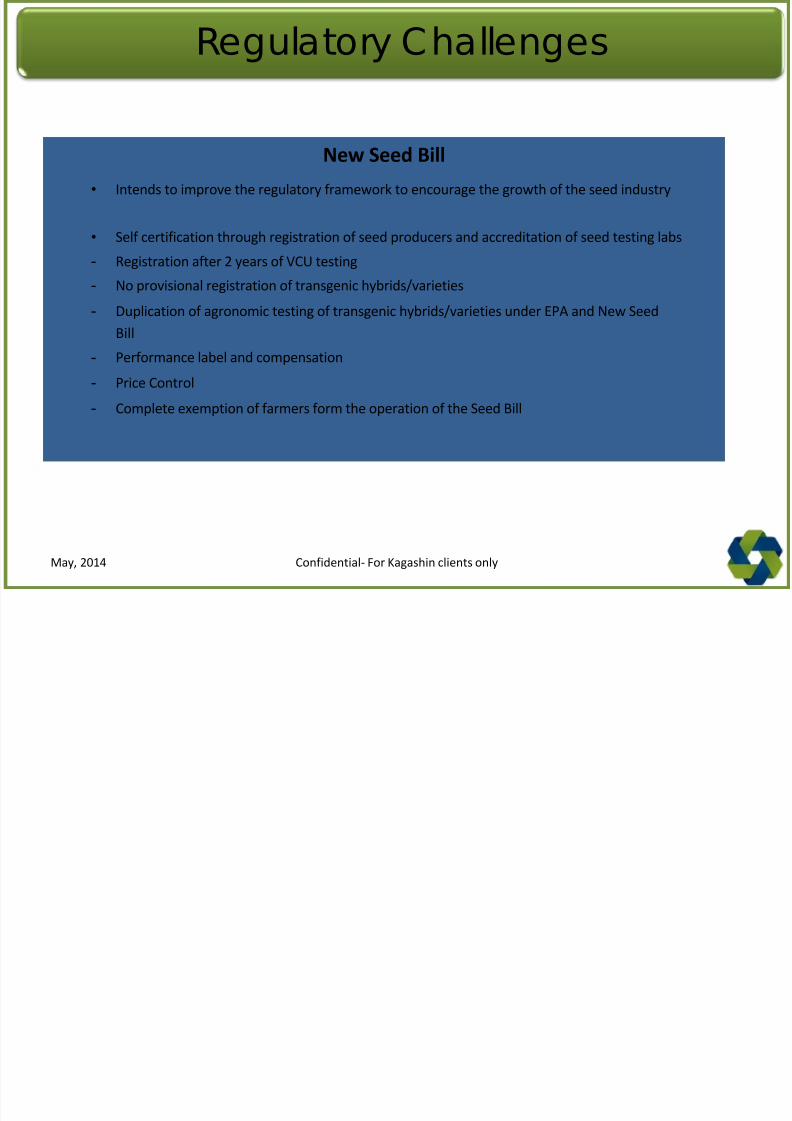
New Seed Bill
• Intends to improve the regulatory framework to encourage the growth of the seed industry
• Self certification through registration of seed producers and accreditation of seed testing labs
- Registration after 2 years of VCU testing
- No provisional registration of transgenic hybrids/varieties- Duplication of agronomic testing of transgenic hybrids/varieties under EPA and New Seed
Bill
- Performance label and compensation
- Price Control
- Complete exemption of farmers form the operation of the Seed Bill
Confidential- For Kagashin clients onlyMay, 2014
R l Ch ll C ’d
8/11/2019 IndianAgriculture a Snapshot
http://slidepdf.com/reader/full/indianagriculture-a-snapshot 80/89
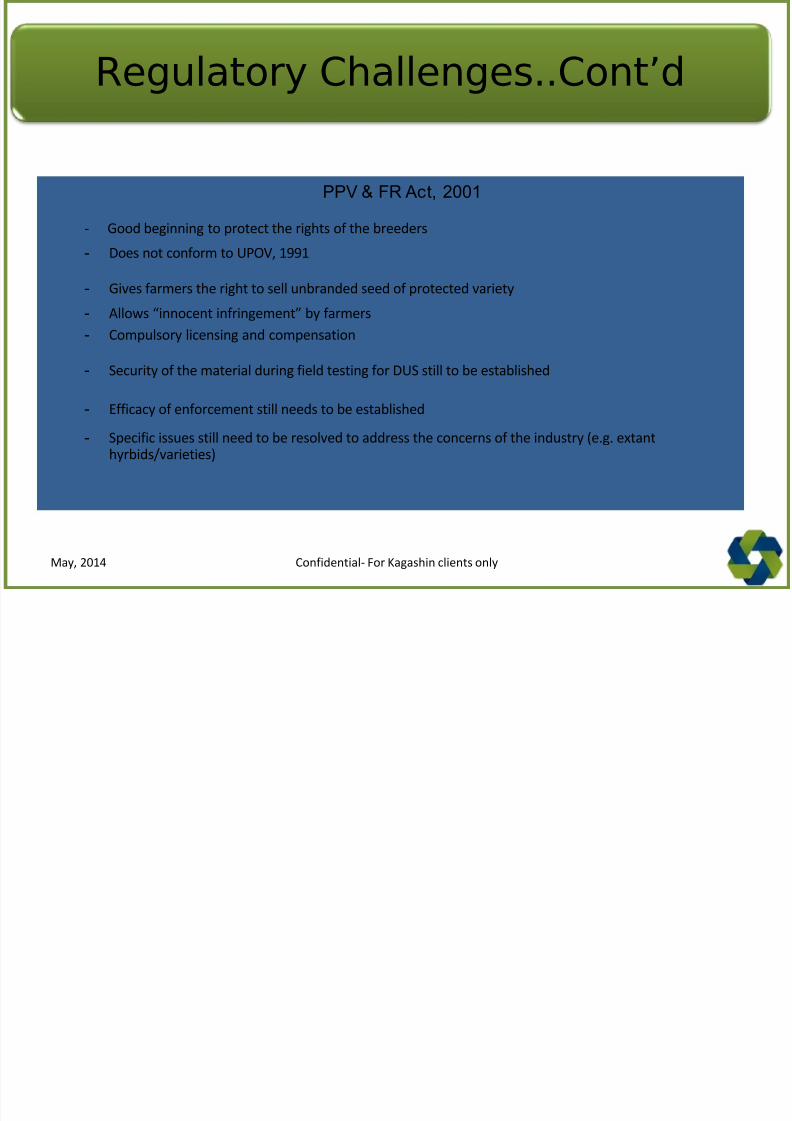
PPV & FR Act, 2001
- Good beginning to protect the rights of the breeders
- Does not conform to UPOV, 1991
- Gives farmers the right to sell unbranded seed of protected variety
- Allows “innocent infringement” by farmers
- Compulsory licensing and compensation
- Security of the material during field testing for DUS still to be established
- Efficacy of enforcement still needs to be established
- Specific issues still need to be resolved to address the concerns of the industry (e.g. extanthyrbids/varieties)
Regulatory Challenges..Cont’d
Confidential- For Kagashin clients onlyMay, 2014
Regulatory Challenges..Cont’d
8/11/2019 IndianAgriculture a Snapshot
http://slidepdf.com/reader/full/indianagriculture-a-snapshot 81/89
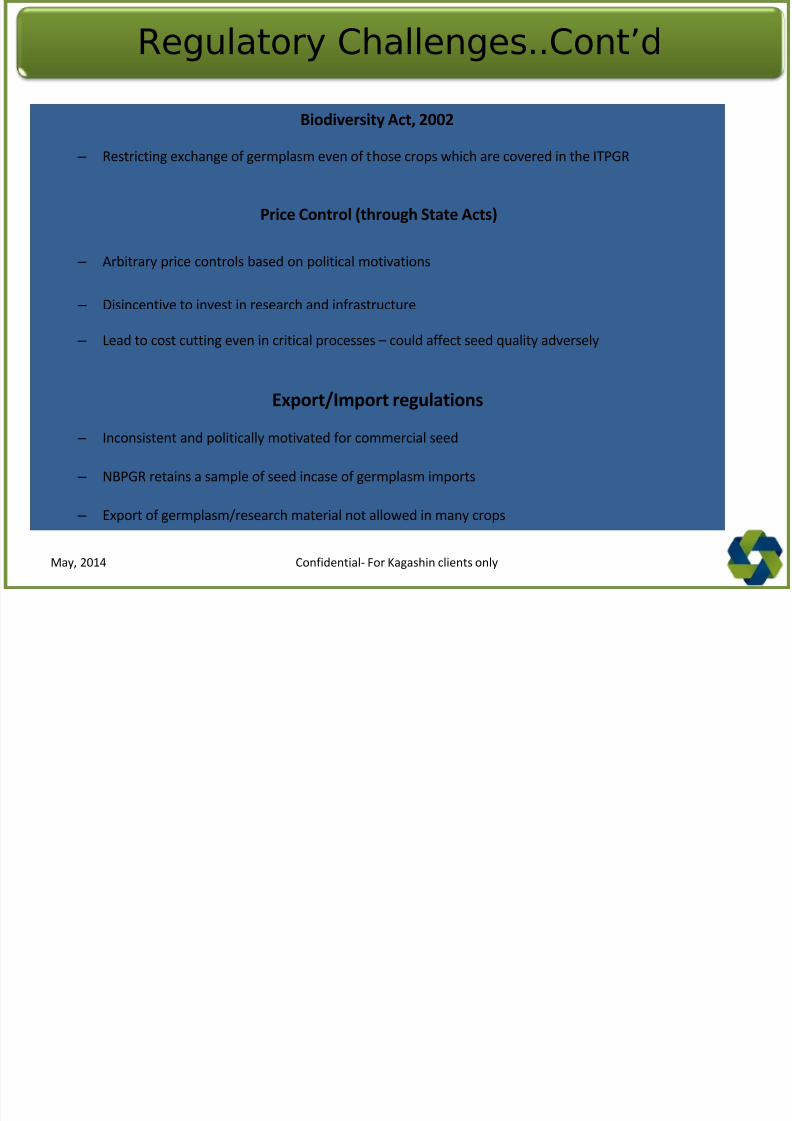
Biodiversity Act, 2002
– Restricting exchange of germplasm even of those crops which are covered in the ITPGR
Price Control (through State Acts)
– Arbitrary price controls based on political motivations
– Disincentive to invest in research and infrastructure
– Lead to cost cutting even in critical processes – could affect seed quality adversely
Export/Import regulations
– Inconsistent and politically motivated for commercial seed
– NBPGR retains a sample of seed incase of germplasm imports
– Export of germplasm/research material not allowed in many crops
g y g
Confidential- For Kagashin clients onlyMay, 2014
Productivity challenges
8/11/2019 IndianAgriculture a Snapshot
http://slidepdf.com/reader/full/indianagriculture-a-snapshot 82/89
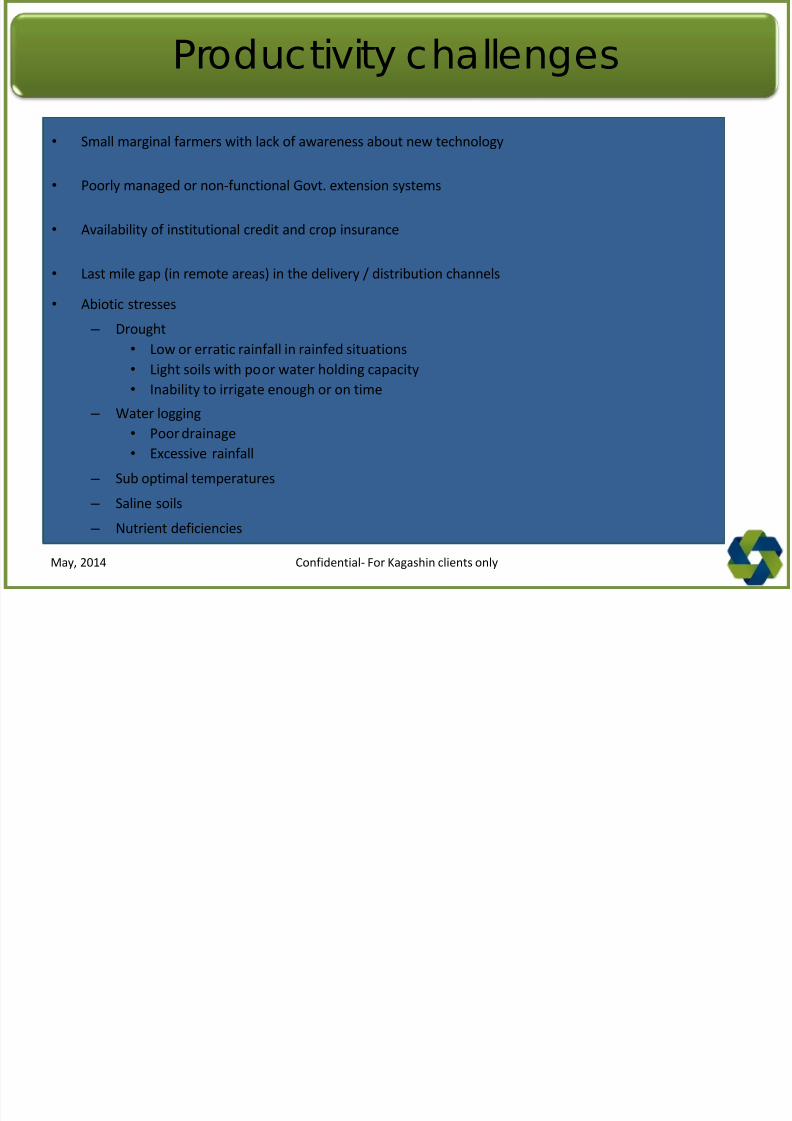
Productivity challenges
• Small marginal farmers with lack of awareness about new technology
• Poorly managed or non-functional Govt. extension systems
• Availability of institutional credit and crop insurance
• Last mile gap (in remote areas) in the delivery / distribution channels
• Abiotic stresses
– Drought
• Low or erratic rainfall in rainfed situations
• Light soils with poor water holding capacity
• Inability to irrigate enough or on time
– Water logging
• Poor drainage
• Excessive rainfall
– Sub optimal temperatures
– Saline soils
– Nutrient deficiencies
Confidential- For Kagashin clients onlyMay, 2014
P d ti it h ll C t’d
8/11/2019 IndianAgriculture a Snapshot
http://slidepdf.com/reader/full/indianagriculture-a-snapshot 83/89
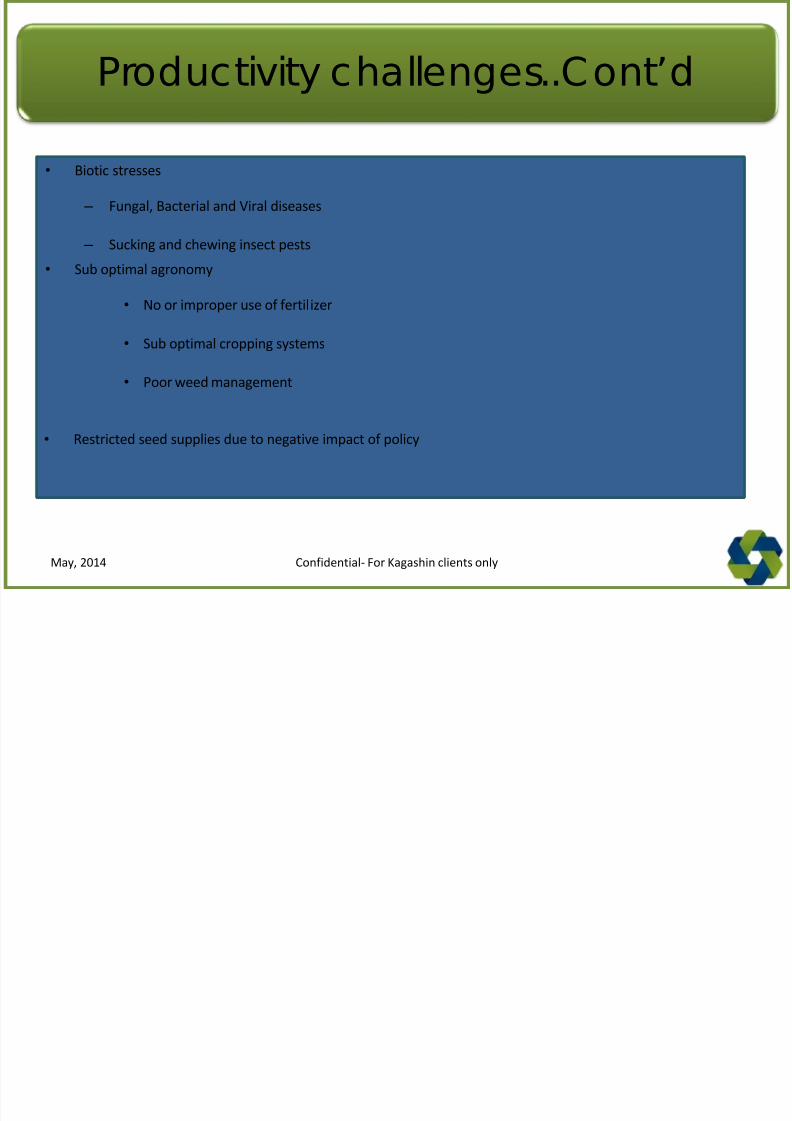
Productivity challenges..Cont’d
• Biotic stresses
– Fungal, Bacterial and Viral diseases
– Sucking and chewing insect pests
• Sub optimal agronomy
• No or improper use of fertilizer
• Sub optimal cropping systems
• Poor weed management
• Restricted seed supplies due to negative impact of policy
Confidential- For Kagashin clients onlyMay, 2014
Biotechnology and its effects
8/11/2019 IndianAgriculture a Snapshot
http://slidepdf.com/reader/full/indianagriculture-a-snapshot 84/89
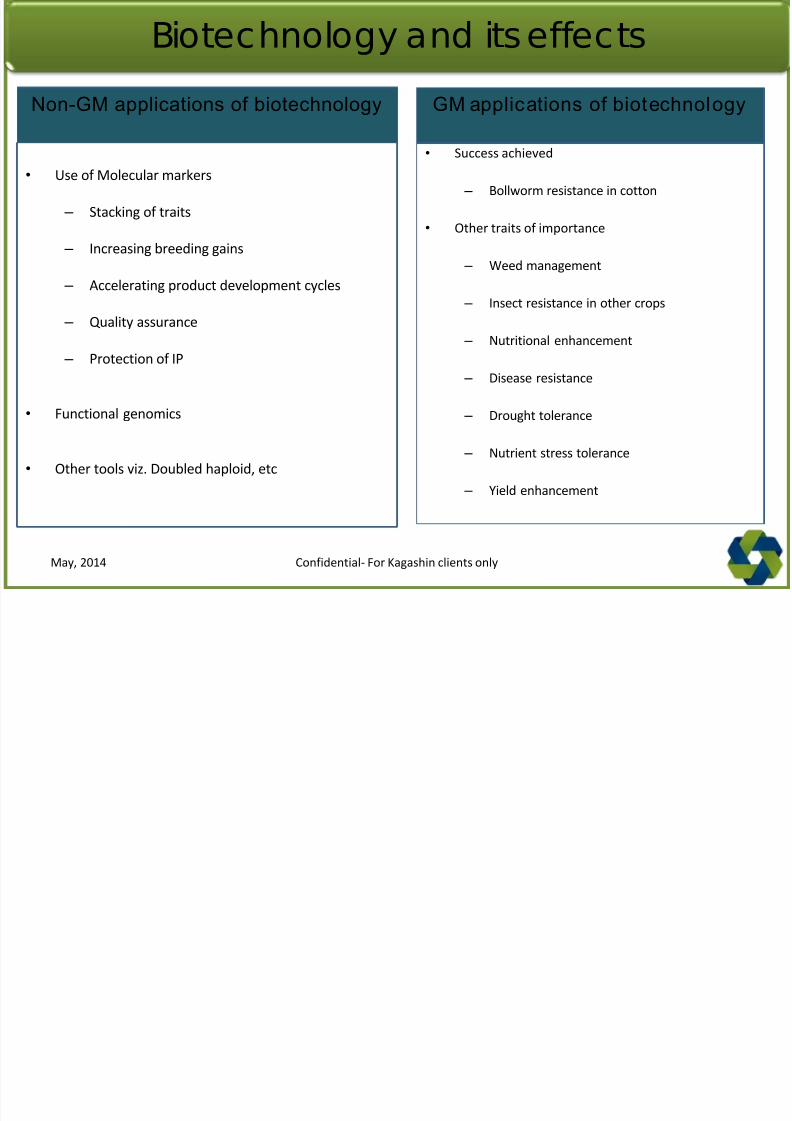
• Use of Molecular markers
– Stacking of traits
– Increasing breeding gains
– Accelerating product development cycles
– Quality assurance
– Protection of IP
• Functional genomics
• Other tools viz. Doubled haploid, etc
• Success achieved
– Bollworm resistance in cotton
• Other traits of importance
– Weed management
– Insect resistance in other crops
– Nutritional enhancement
– Disease resistance
– Drought tolerance
– Nutrient stress tolerance
– Yield enhancement
GM applications of biotechnologyNon-GM applications of biotechnology
Confidential- For Kagashin clients onlyMay, 2014
Technologiesunder development in India
8/11/2019 IndianAgriculture a Snapshot
http://slidepdf.com/reader/full/indianagriculture-a-snapshot 85/89
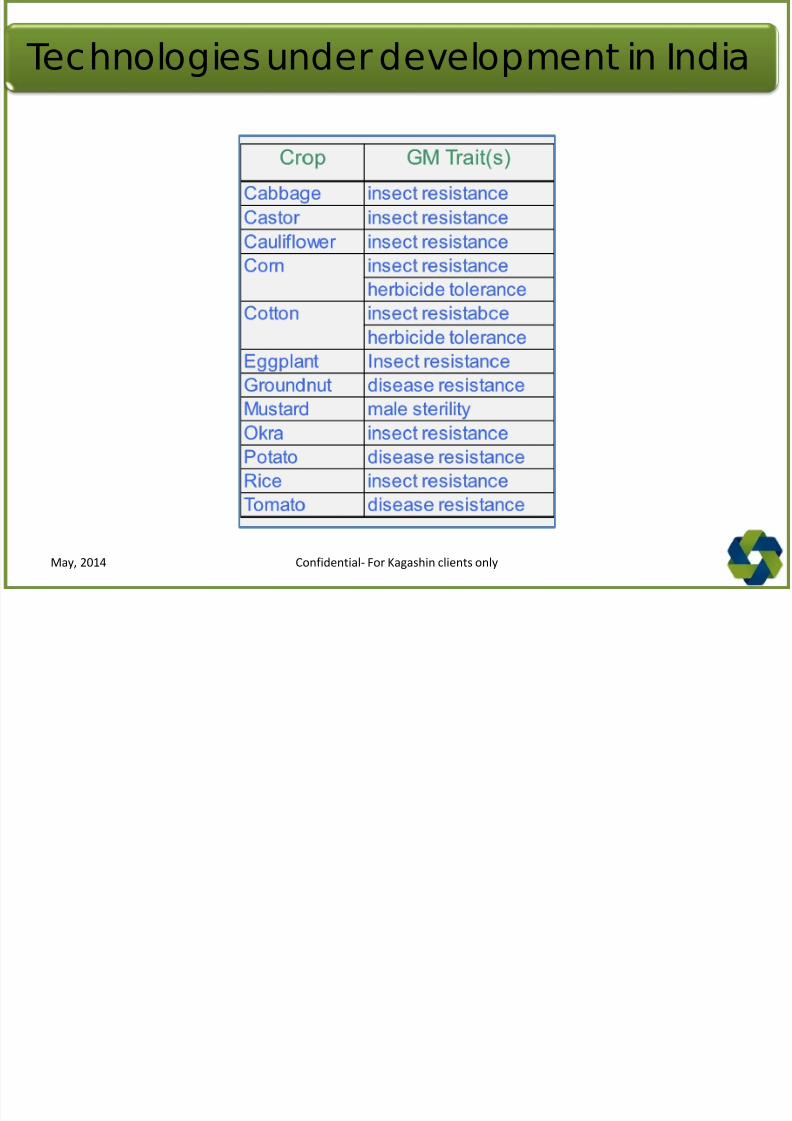
Technologies under development in India
Confidential- For Kagashin clients onlyMay, 2014
Way Forward
8/11/2019 IndianAgriculture a Snapshot
http://slidepdf.com/reader/full/indianagriculture-a-snapshot 86/89
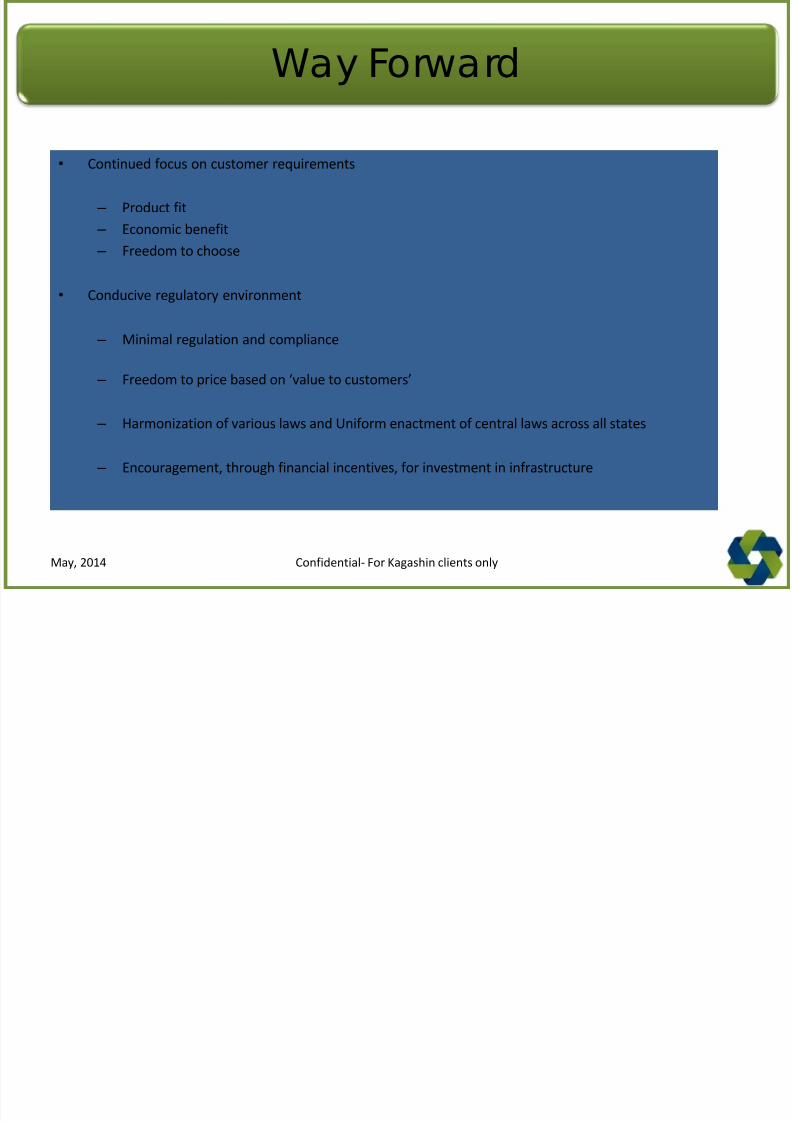
Way Forward
• Continued focus on customer requirements
– Product fit
– Economic benefit
– Freedom to choose
• Conducive regulatory environment
– Minimal regulation and compliance
– Freedom to price based on ‘value to customers’
– Harmonization of various laws and Uniform enactment of central laws across all states
– Encouragement, through financial incentives, for investment in infrastructure
Confidential- For Kagashin clients onlyMay, 2014
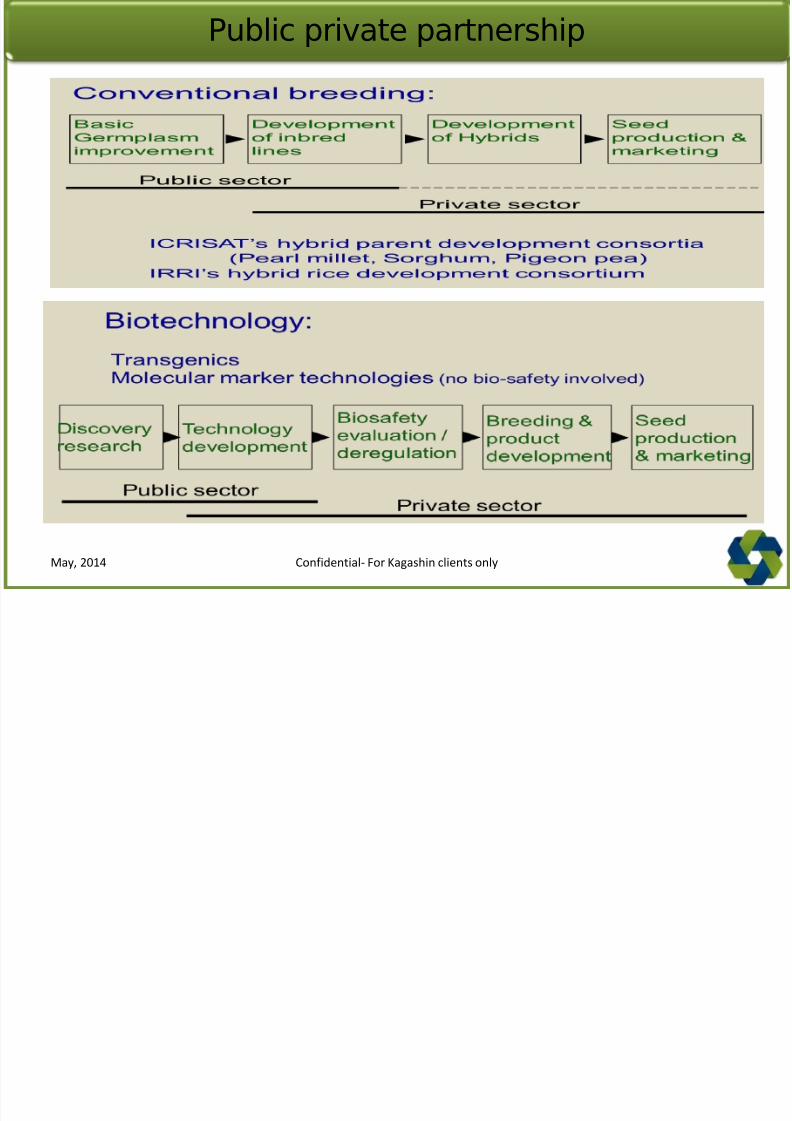
Public private partnership
8/11/2019 IndianAgriculture a Snapshot
http://slidepdf.com/reader/full/indianagriculture-a-snapshot 87/89
Confidential- For Kagashin clients onlyMay, 2014
Summary
8/11/2019 IndianAgriculture a Snapshot
http://slidepdf.com/reader/full/indianagriculture-a-snapshot 88/89
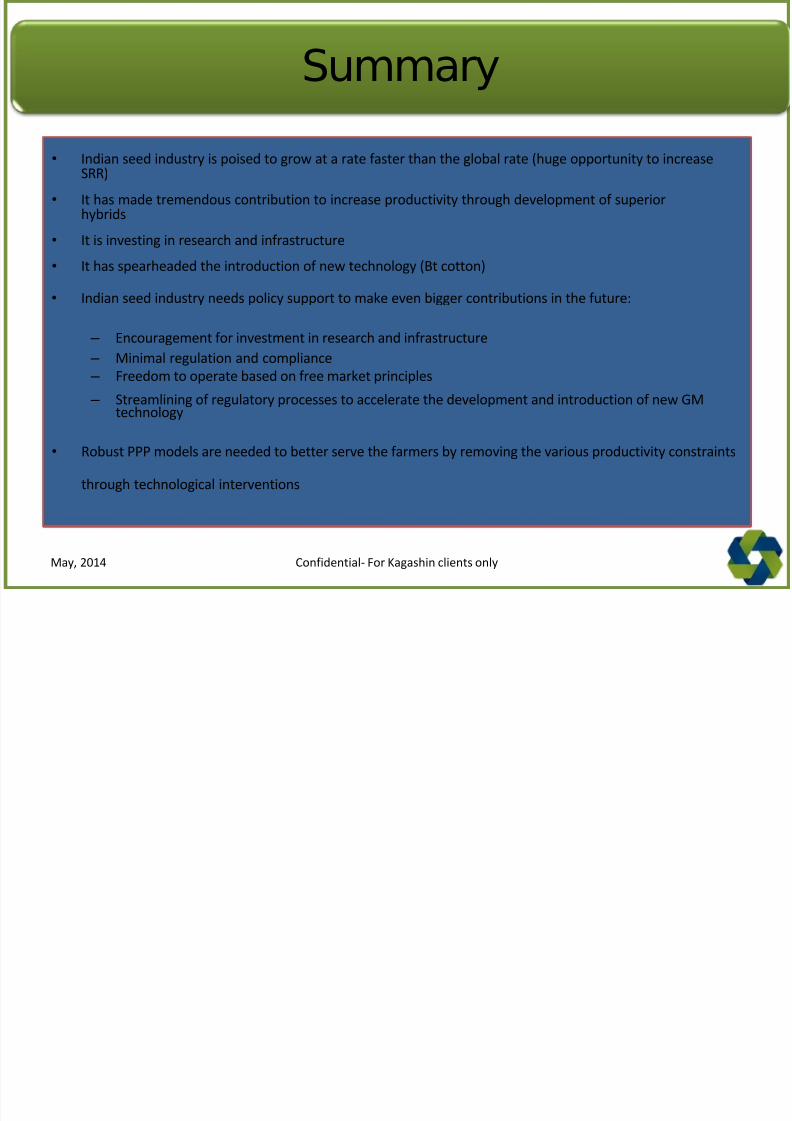
Summary
• Indian seed industry is poised to grow at a rate faster than the global rate (huge opportunity to increaseSRR)
• It has made tremendous contribution to increase productivity through development of superiorhybrids
• It is investing in research and infrastructure
• It has spearheaded the introduction of new technology (Bt cotton)
• Indian seed industry needs policy support to make even bigger contributions in the future:
– Encouragement for investment in research and infrastructure
– Minimal regulation and compliance
– Freedom to operate based on free market principles
– Streamlining of regulatory processes to accelerate the development and introduction of new GMtechnology
• Robust PPP models are needed to better serve the farmers by removing the various productivity constraints
through technological interventions
Confidential- For Kagashin clients onlyMay, 2014

8/11/2019 IndianAgriculture a Snapshot
http://slidepdf.com/reader/full/indianagriculture-a-snapshot 89/89
Thank You
Office No 339, Regus Business Centre3rd Floor Neo Vikram
New Link Road, Andheri (W)Mumbai 400 053Email: [email protected]