prof p mahanta
TRANSCRIPT
8/13/2019 Prof P Mahanta
http://slidepdf.com/reader/full/prof-p-mahanta 1/41
Heat Transfer Characteristicsin Cyclone Separator of a
Circulating Fluidized BedUnit
DR. P. MAHANTA
IIT GUWAHATI
8/13/2019 Prof P Mahanta
http://slidepdf.com/reader/full/prof-p-mahanta 2/41
2
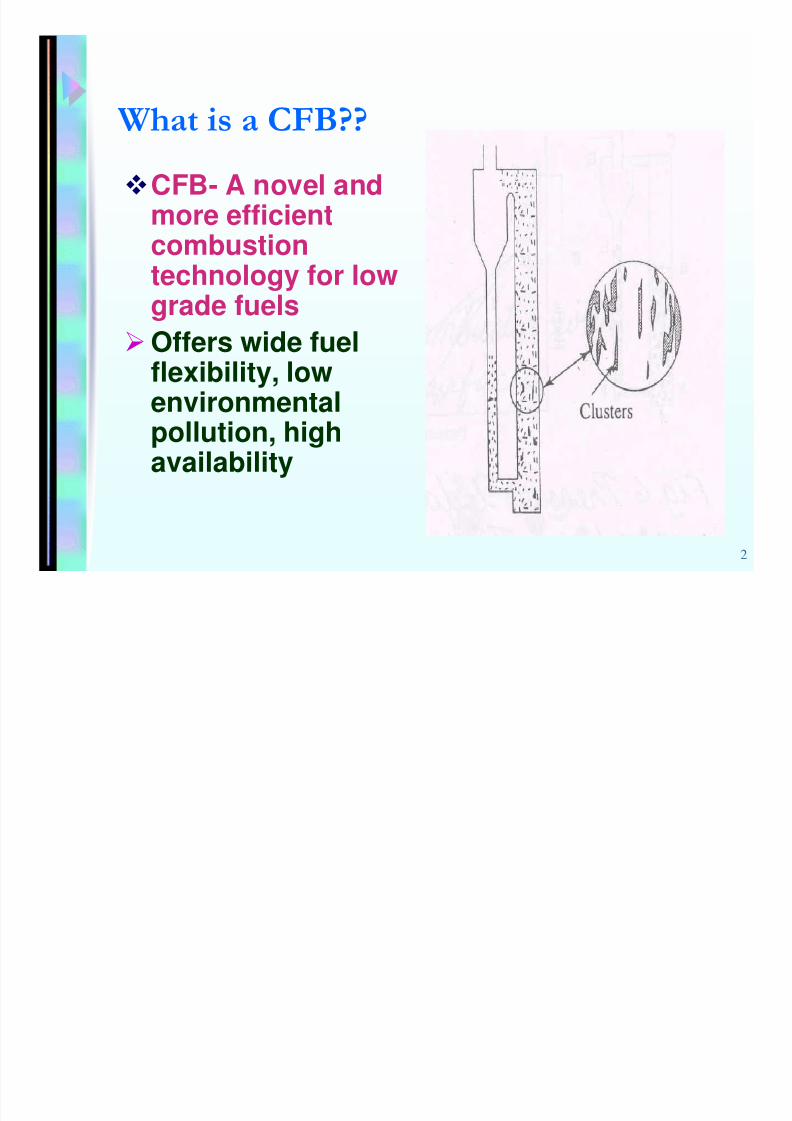
CFB- A novel and
more efficientcombustiontechnology for low
grade fuelsOffers wide fuel
flexibility, lowenvironmental
pollution, highavailability
8/13/2019 Prof P Mahanta
http://slidepdf.com/reader/full/prof-p-mahanta 3/41
3
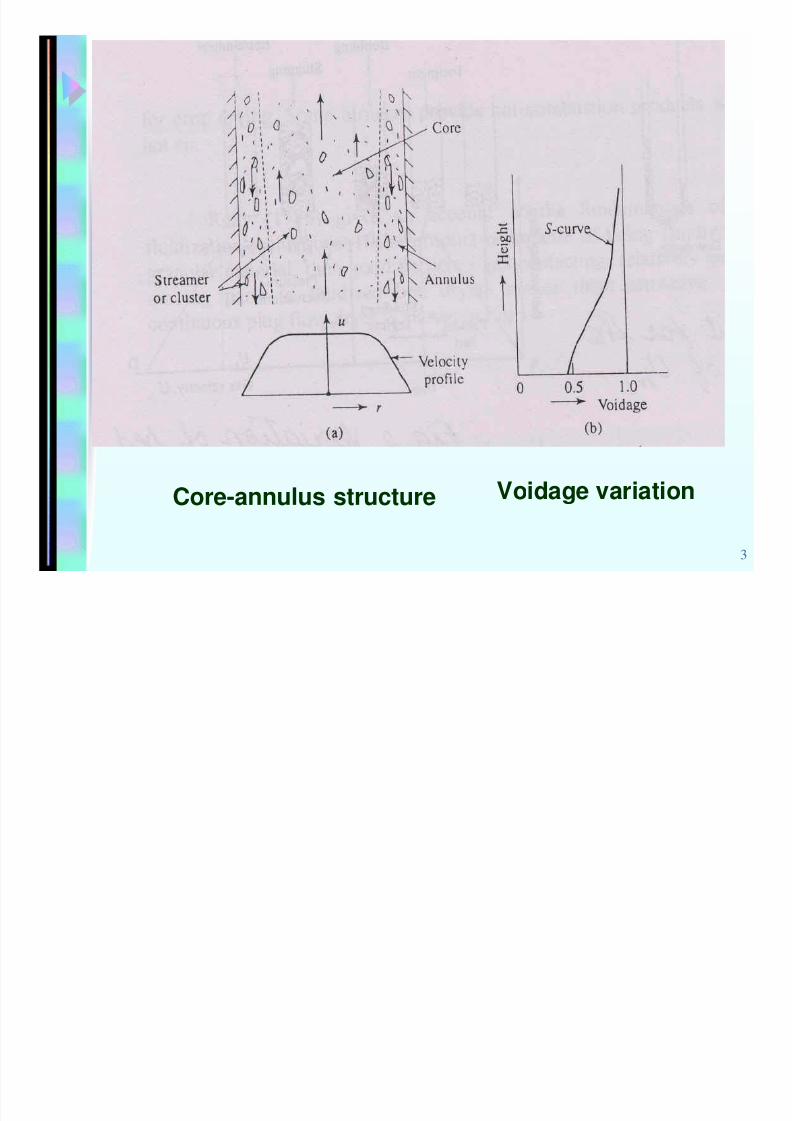
Core-annulus structure Voidage variation
8/13/2019 Prof P Mahanta
http://slidepdf.com/reader/full/prof-p-mahanta 4/41
4
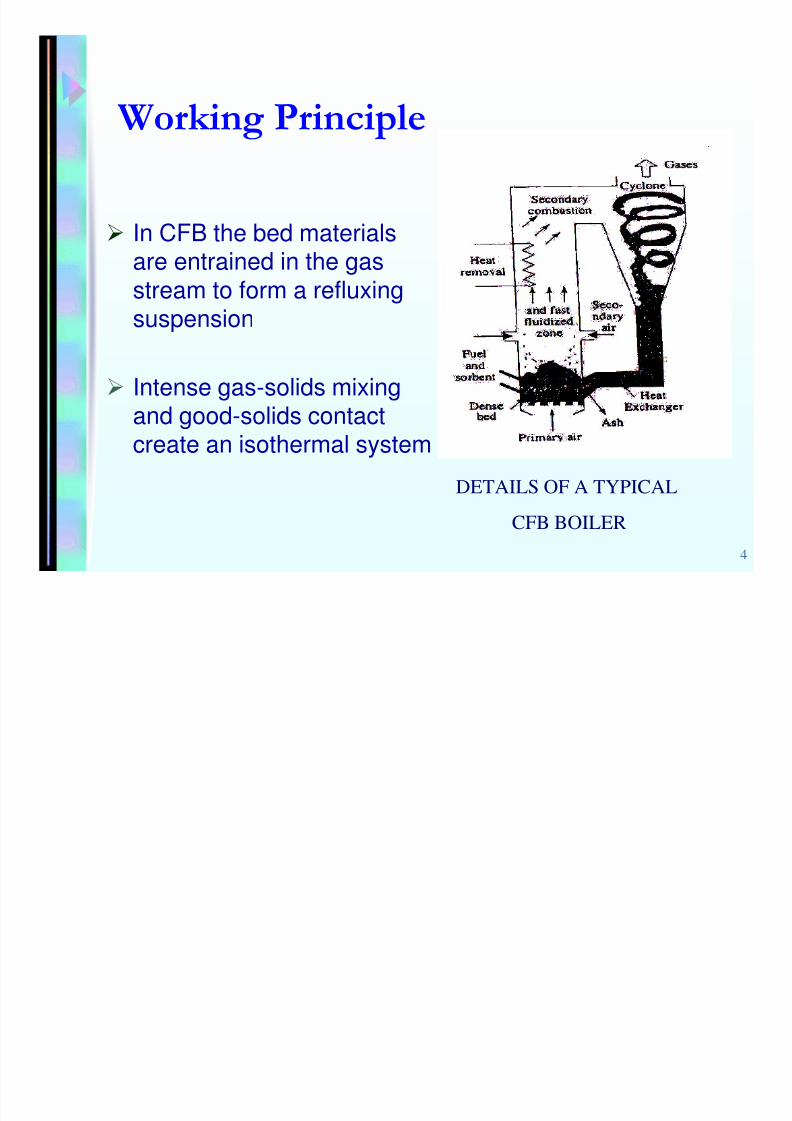
In CFB the bed materialsare entrained in the gasstream to form a refluxing
suspension
Intense gas-solids mixing
and good-solids contactcreate an isothermal system
DETAILS OF A TYPICAL
CFB BOILER
8/13/2019 Prof P Mahanta
http://slidepdf.com/reader/full/prof-p-mahanta 5/41
5
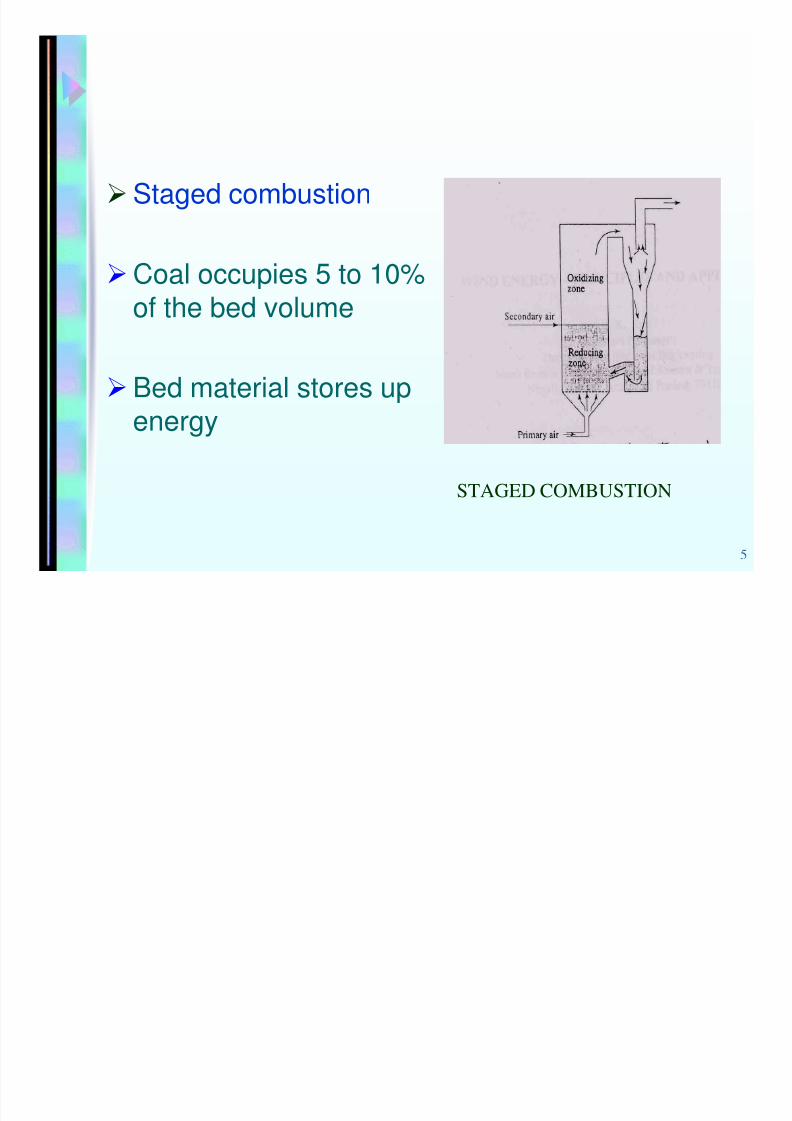
Staged combustion
Coal occupies 5 to 10%
of the bed volume
Bed material stores up
energy
STAGED COMBUSTION
8/13/2019 Prof P Mahanta
http://slidepdf.com/reader/full/prof-p-mahanta 6/41
6
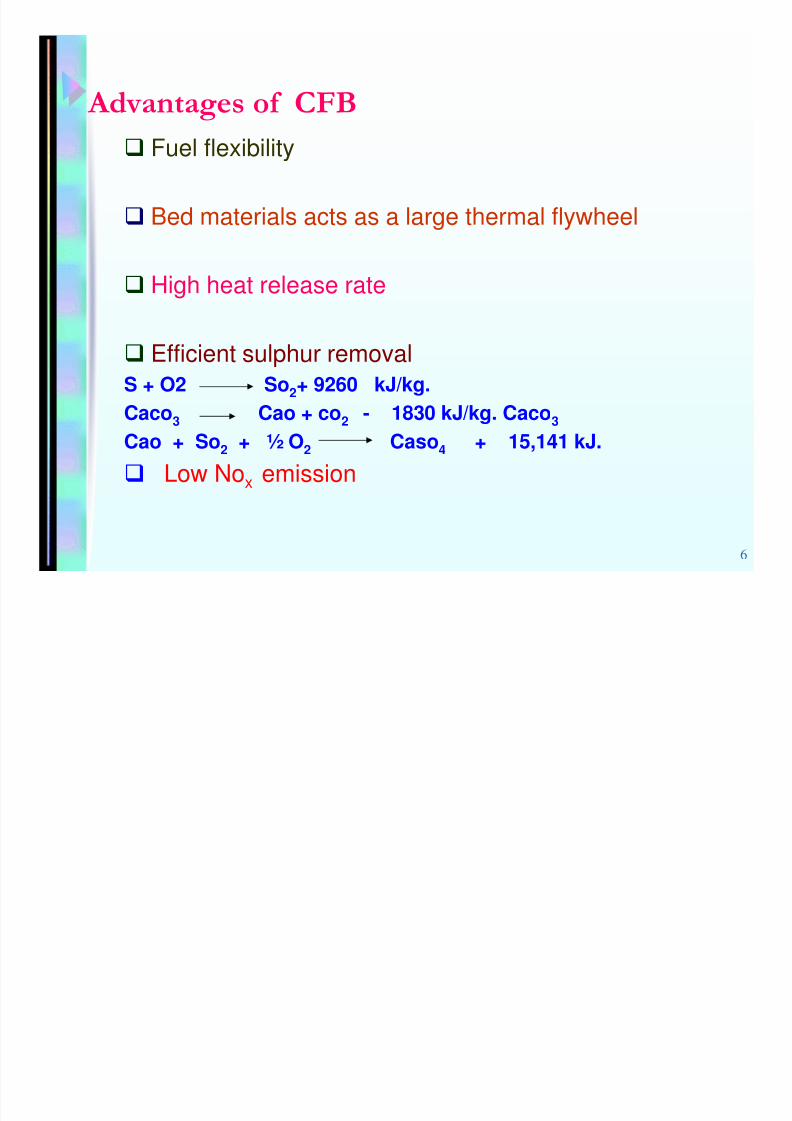
Fuel flexibility
Bed materials acts as a large thermal flywheel
High heat release rate
Efficient sulphur removal
S + O2 So2+ 9260 kJ/kg.
Caco3
Cao + co2
- 1830 kJ/kg. Caco3
Cao + So2 + ½ O2 Caso4 + 15,141 kJ.
Low Nox emission
8/13/2019 Prof P Mahanta
http://slidepdf.com/reader/full/prof-p-mahanta 7/41
8/13/2019 Prof P Mahanta
http://slidepdf.com/reader/full/prof-p-mahanta 8/41
8/13/2019 Prof P Mahanta
http://slidepdf.com/reader/full/prof-p-mahanta 9/41
9
In the upper splash region of CFB dueto fully developed gas-solid flow bettersolid-gas contacting takes place
Low solid concentration on upper splashregion reduces the erosion problem on
heat exchanging surfaces
8/13/2019 Prof P Mahanta
http://slidepdf.com/reader/full/prof-p-mahanta 10/41
10
!"
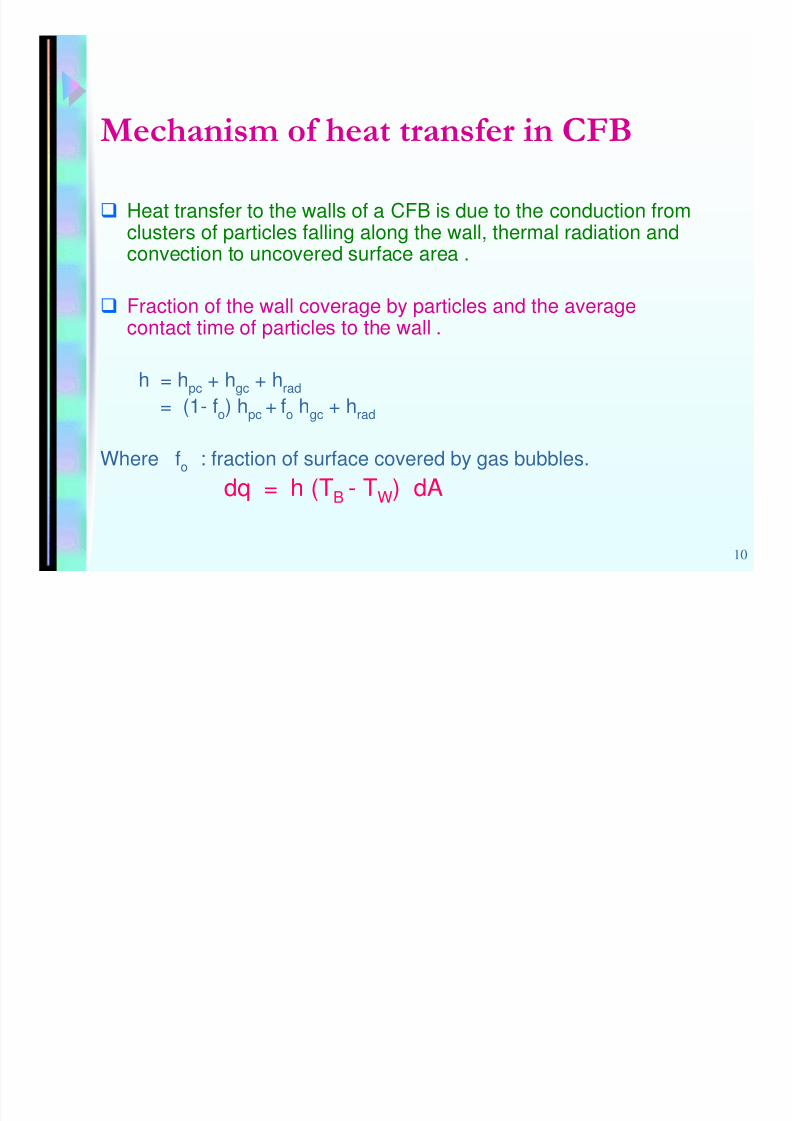
Heat transfer to the walls of a CFB is due to the conduction fromclusters of particles falling along the wall, thermal radiation andconvection to uncovered surface area .
Fraction of the wall coverage by particles and the average
contact time of particles to the wall .
h = hpc + hgc + hrad
= (1- fo) hpc + fo hgc + hrad
Where fo : fraction of surface covered by gas bubbles.
dq = h (TB - TW) dA
8/13/2019 Prof P Mahanta
http://slidepdf.com/reader/full/prof-p-mahanta 11/41
11
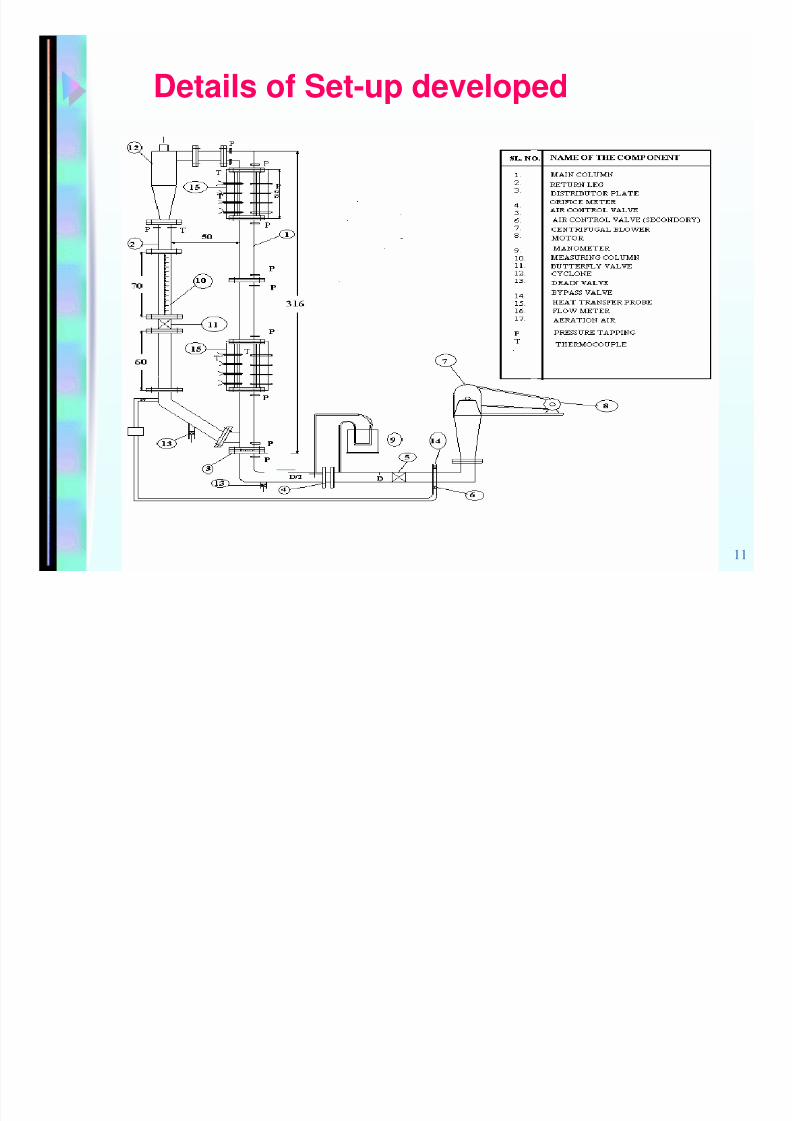
Details of Set-up developed
8/13/2019 Prof P Mahanta
http://slidepdf.com/reader/full/prof-p-mahanta 12/41
12
8/13/2019 Prof P Mahanta
http://slidepdf.com/reader/full/prof-p-mahanta 13/41
13
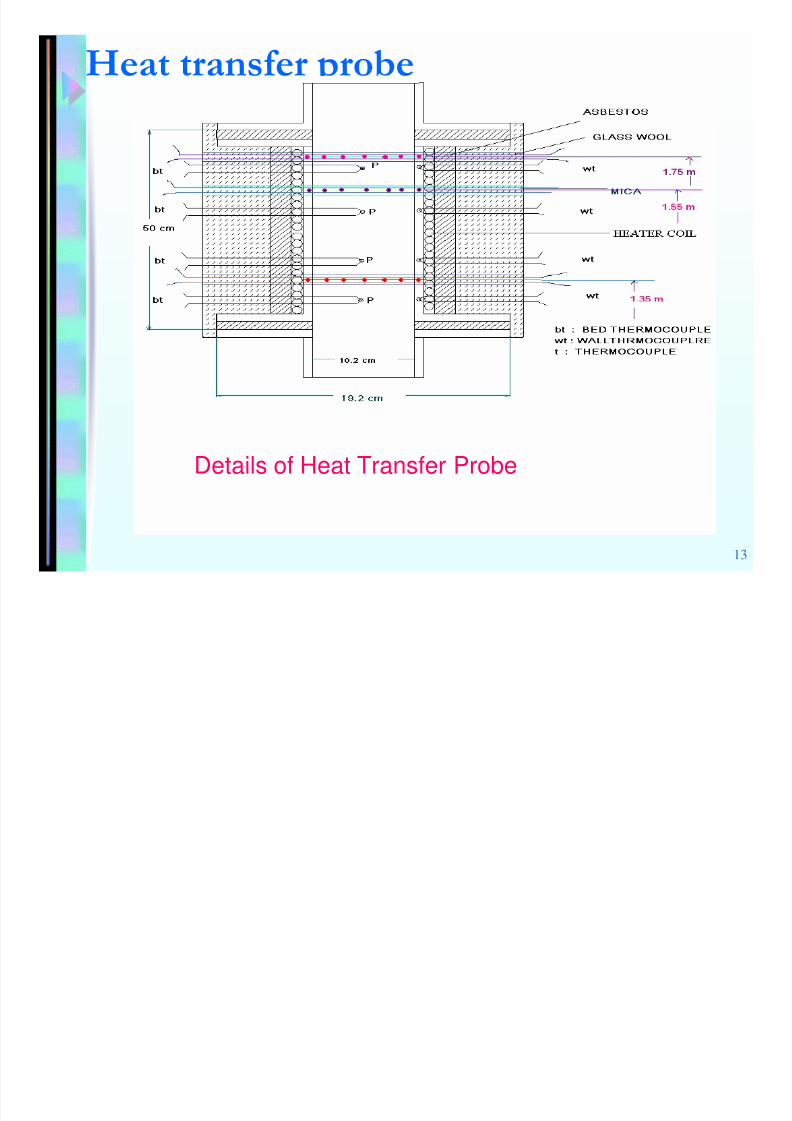
# $
Details of Heat Transfer Probe
8/13/2019 Prof P Mahanta
http://slidepdf.com/reader/full/prof-p-mahanta 14/41
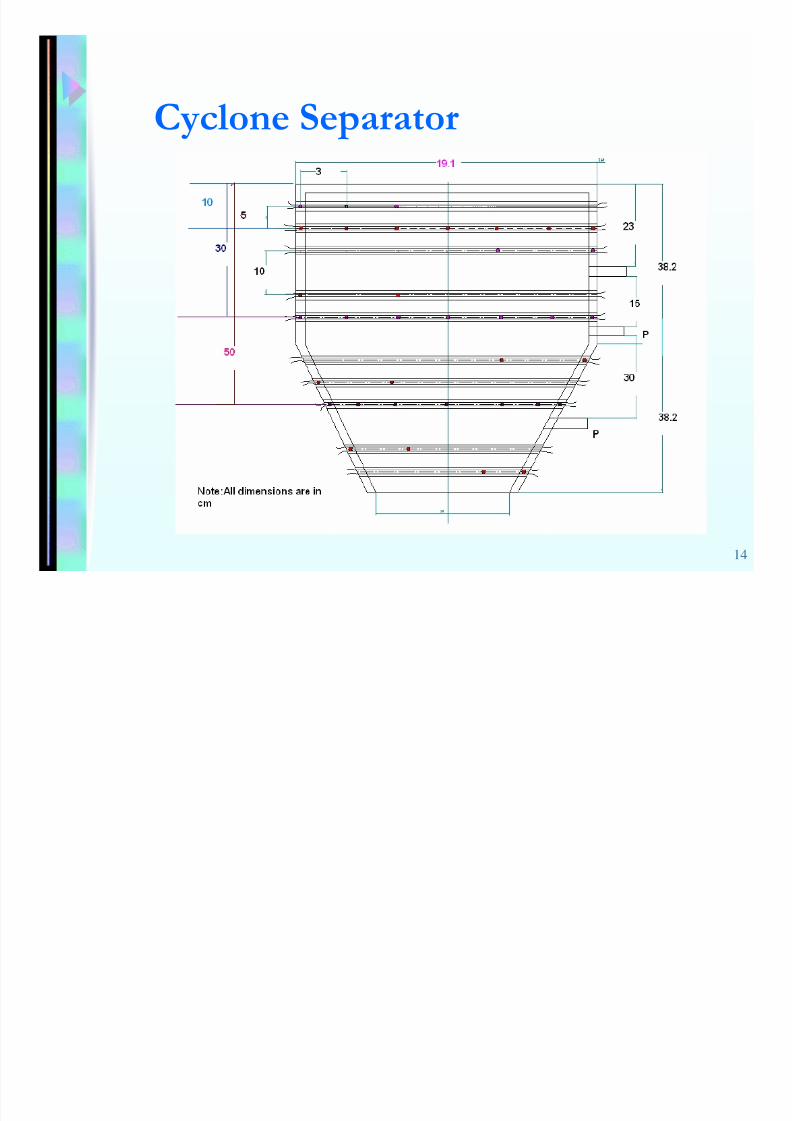
14
%
8/13/2019 Prof P Mahanta
http://slidepdf.com/reader/full/prof-p-mahanta 15/41
15
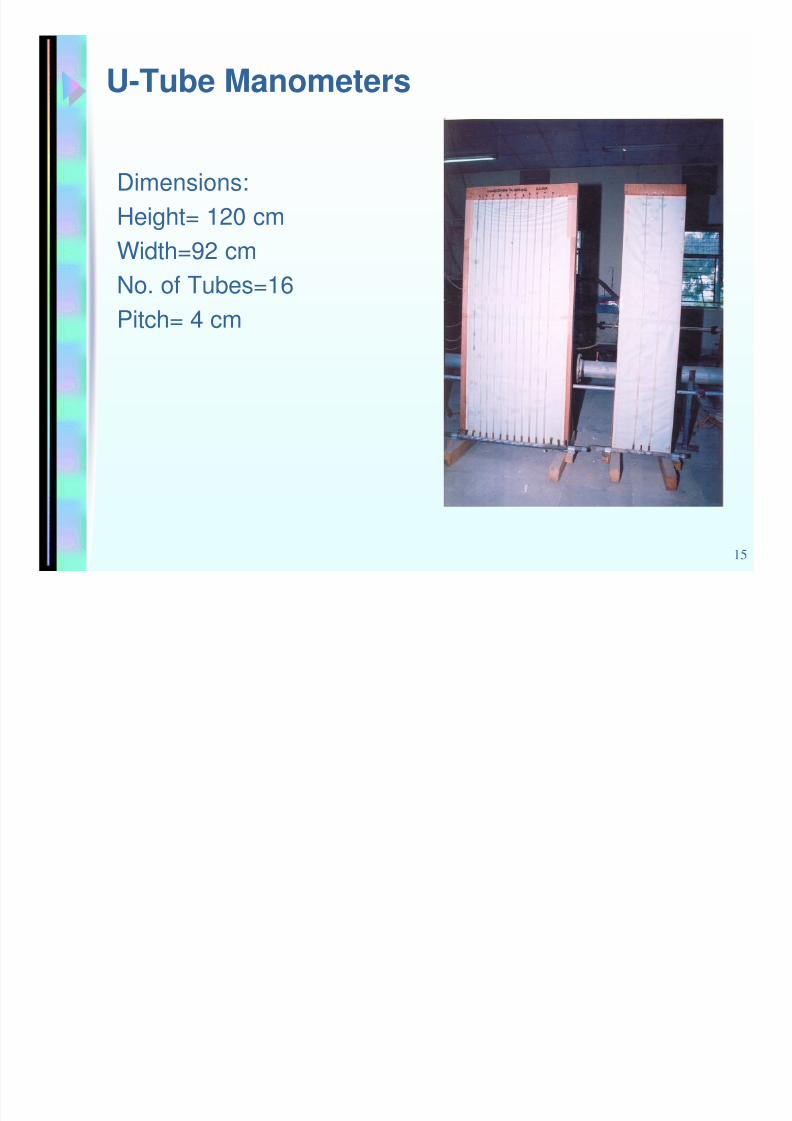
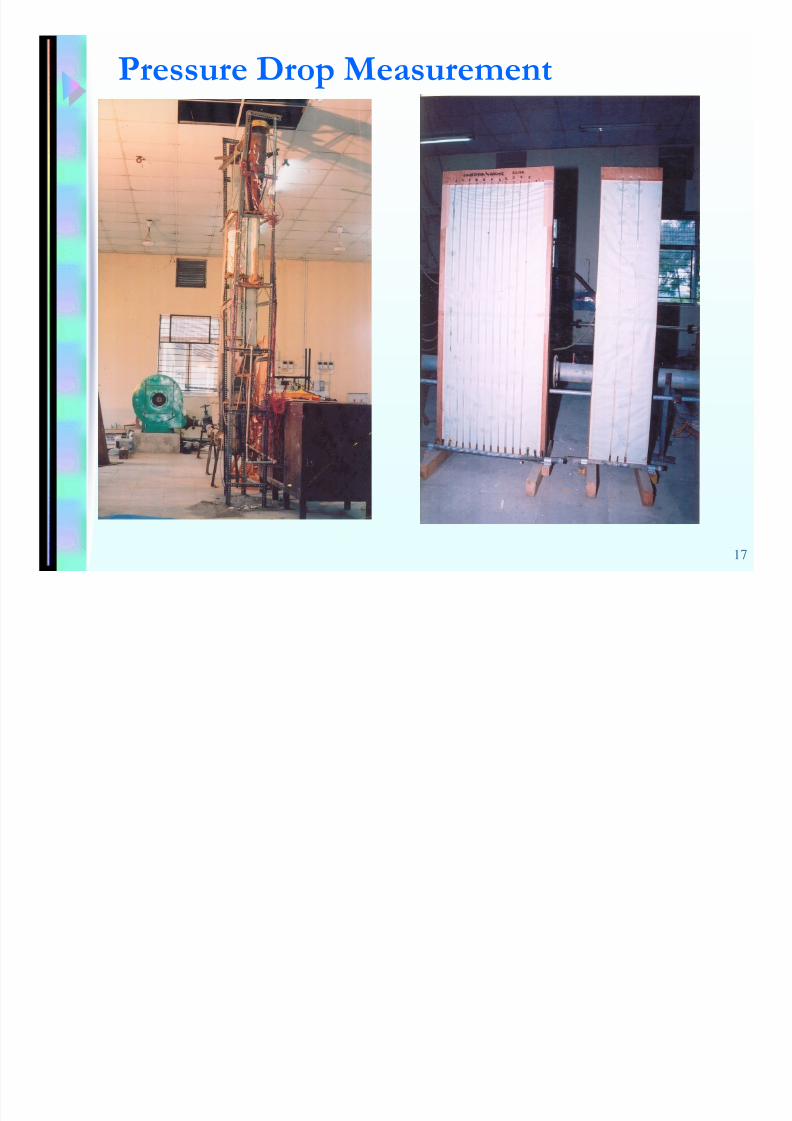
U-Tube Manometers
Dimensions:
Height= 120 cmWidth=92 cm
No. of Tubes=16
Pitch= 4 cm
8/13/2019 Prof P Mahanta
http://slidepdf.com/reader/full/prof-p-mahanta 16/41
16
!"
8/13/2019 Prof P Mahanta
http://slidepdf.com/reader/full/prof-p-mahanta 17/41
17
& !"
8/13/2019 Prof P Mahanta
http://slidepdf.com/reader/full/prof-p-mahanta 18/41
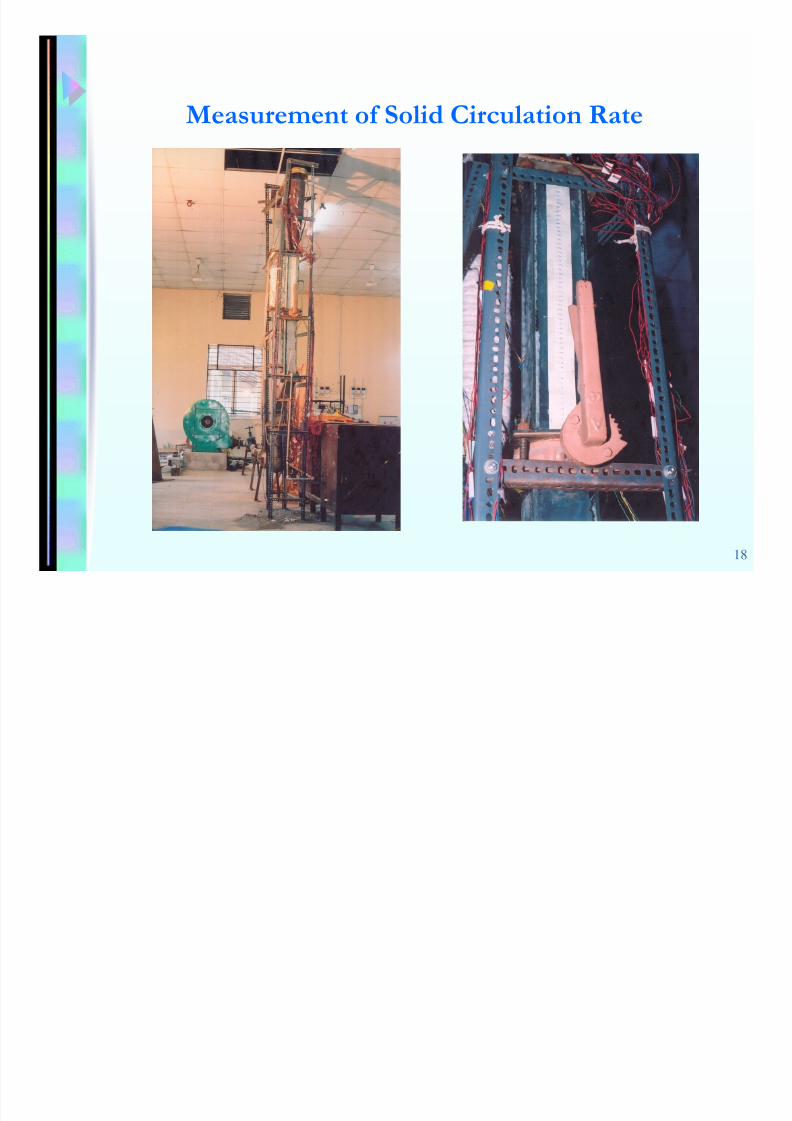
18
!" '
8/13/2019 Prof P Mahanta
http://slidepdf.com/reader/full/prof-p-mahanta 19/41
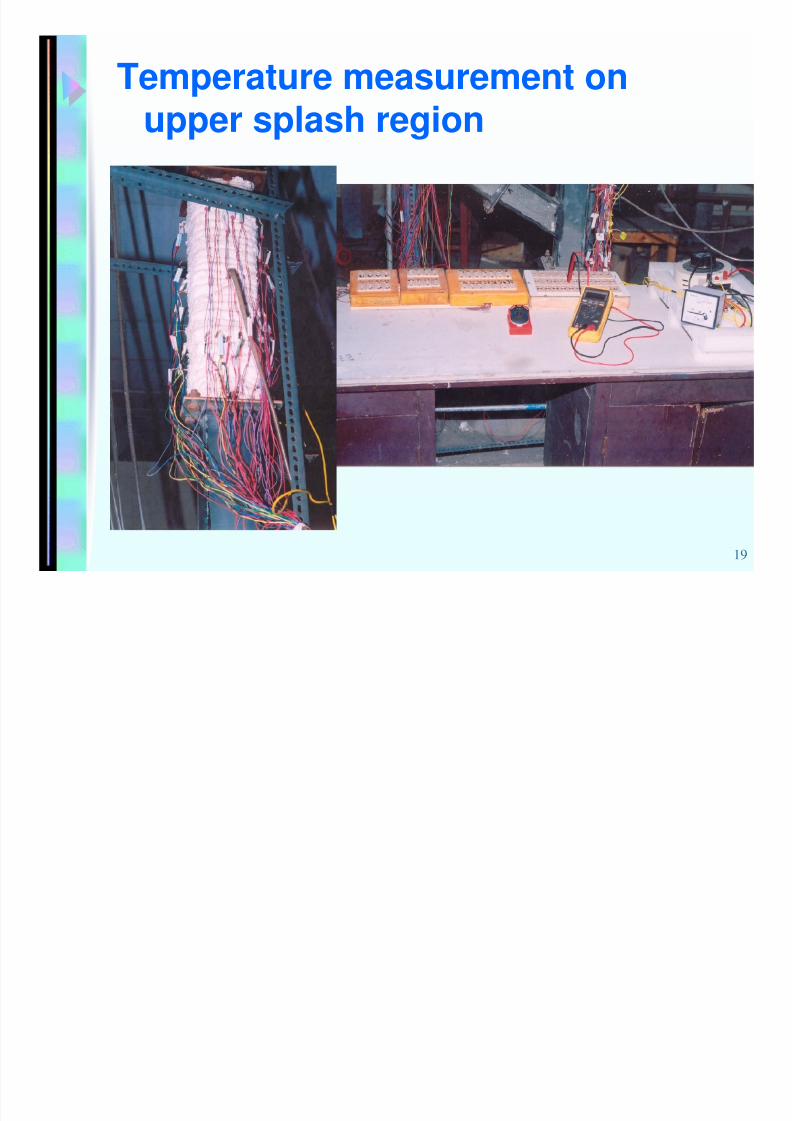
19
Temperature measurement on
upper splash region
8/13/2019 Prof P Mahanta
http://slidepdf.com/reader/full/prof-p-mahanta 20/41
20
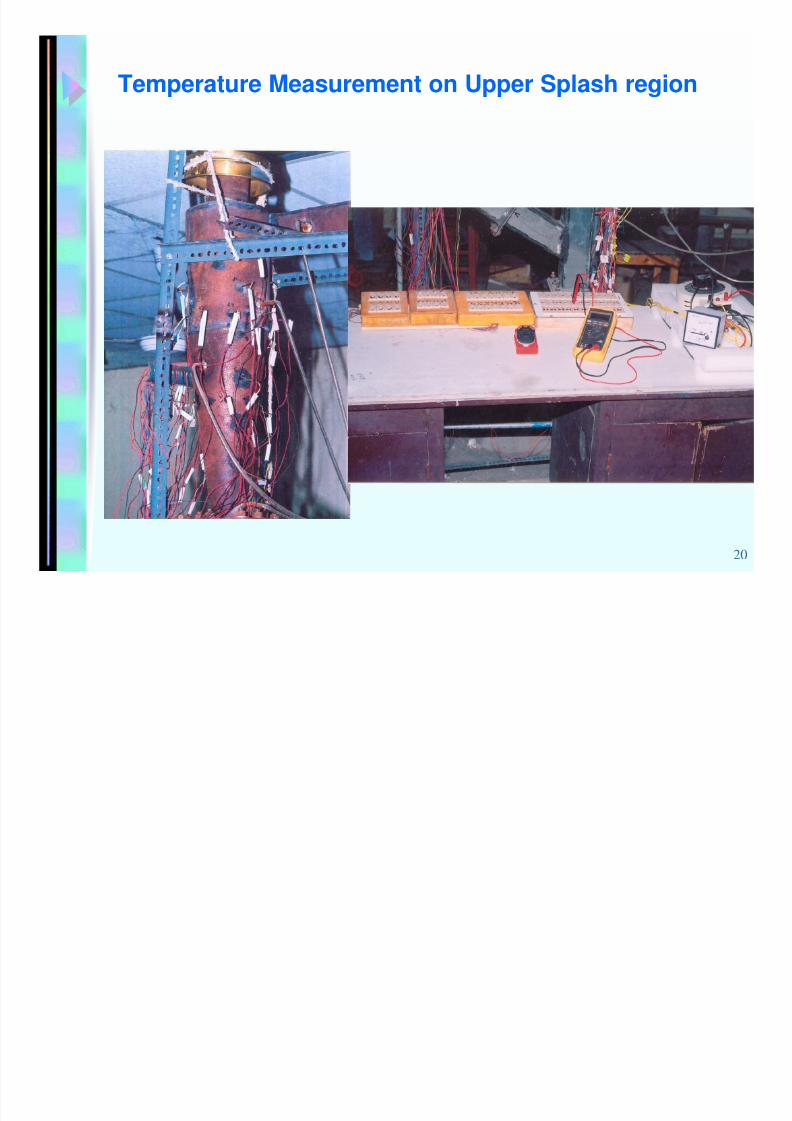
Temperature Measurement on Upper Splash region
8/13/2019 Prof P Mahanta
http://slidepdf.com/reader/full/prof-p-mahanta 21/41
21
!" ! (
8/13/2019 Prof P Mahanta
http://slidepdf.com/reader/full/prof-p-mahanta 22/41
22
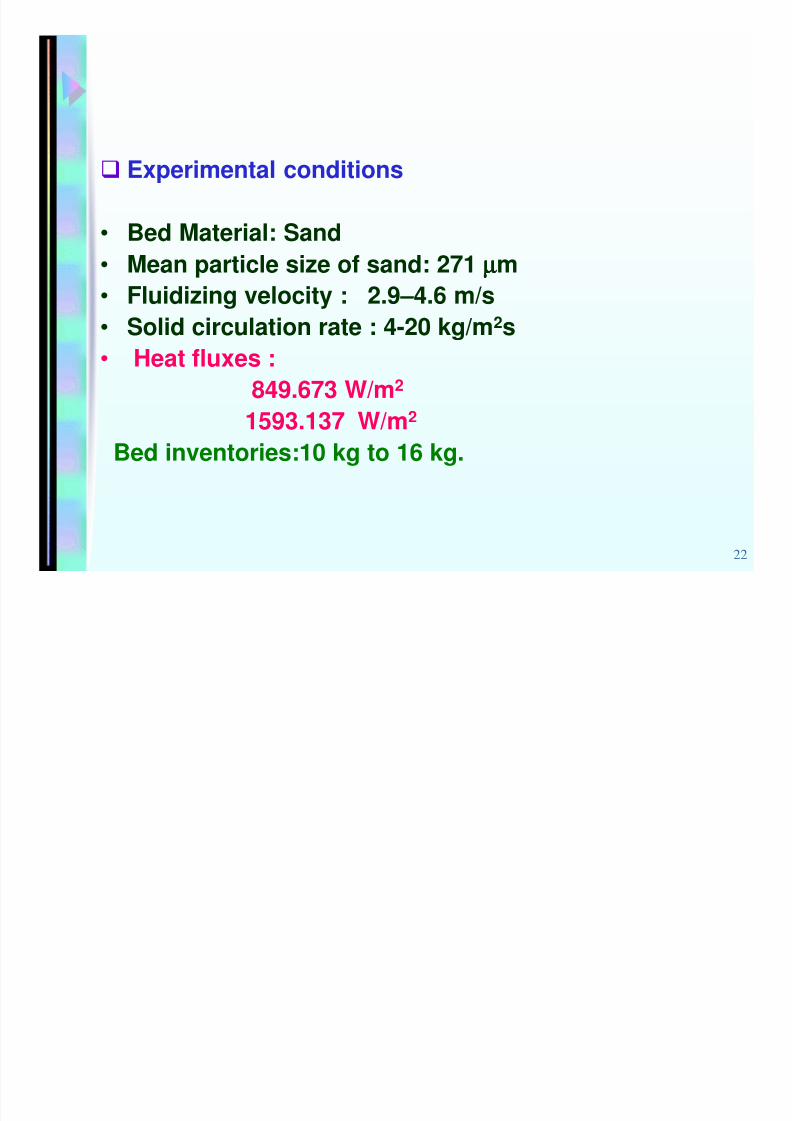
Experimental conditions
• Bed Material: Sand
• Mean particle size of sand: 271 µµµµm
• Fluidizing velocity : 2.9–4.6 m/s
• Solid circulation rate : 4-20 kg/m2s• Heat fluxes :
849.673 W/m2
1593.137 W/m2
Bed inventories:10 kg to 16 kg.
8/13/2019 Prof P Mahanta
http://slidepdf.com/reader/full/prof-p-mahanta 23/41
23
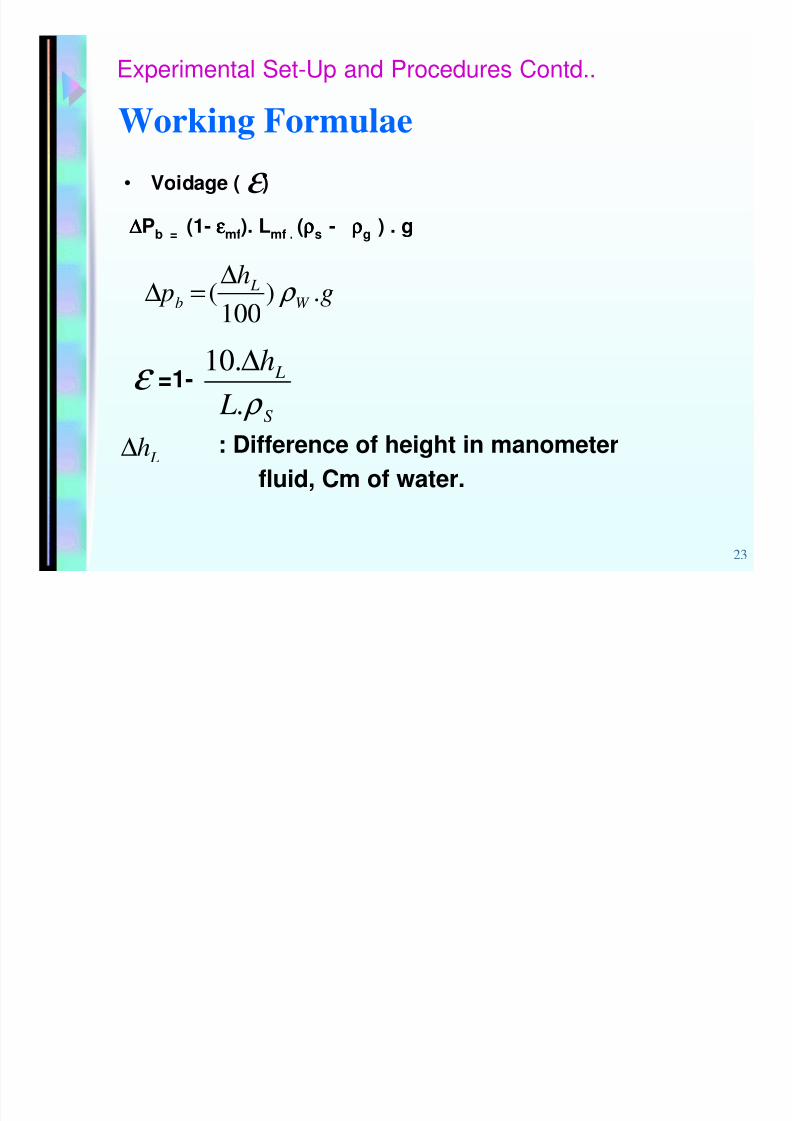
Working Formulae
• Voidage ( )
∆∆∆∆Pb = (1- εεεεmf). Lmf . (ρρρρs - ρρρρg ) . g
ε
gh
p W L
b .)
100
( ρ ∆
=∆
S
L
L
h
ρ .
.10 ∆ε =1-
: Difference of height in manometer
fluid, Cm of water. Lh∆
Experimental Set-Up and Procedures Contd..
8/13/2019 Prof P Mahanta
http://slidepdf.com/reader/full/prof-p-mahanta 24/41
24
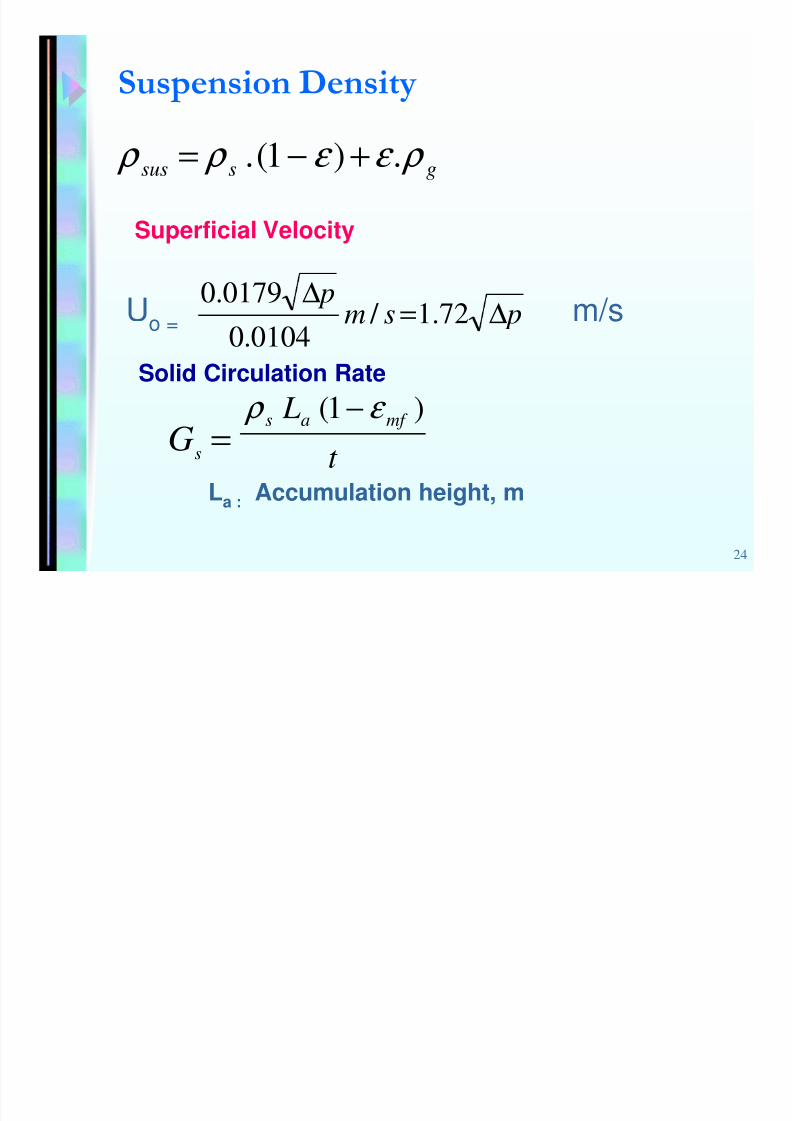
&%
gssus ρ ε ε ρ ρ .)1(. +−=
Superficial Velocity
psm
p
∆=
∆
72.1 / 0104.0
0179.0
Uo = m/sSolid Circulation Rate
t
L mf as )1( ε ρ −
=sG
La : Accumulation height, m
8/13/2019 Prof P Mahanta
http://slidepdf.com/reader/full/prof-p-mahanta 25/41
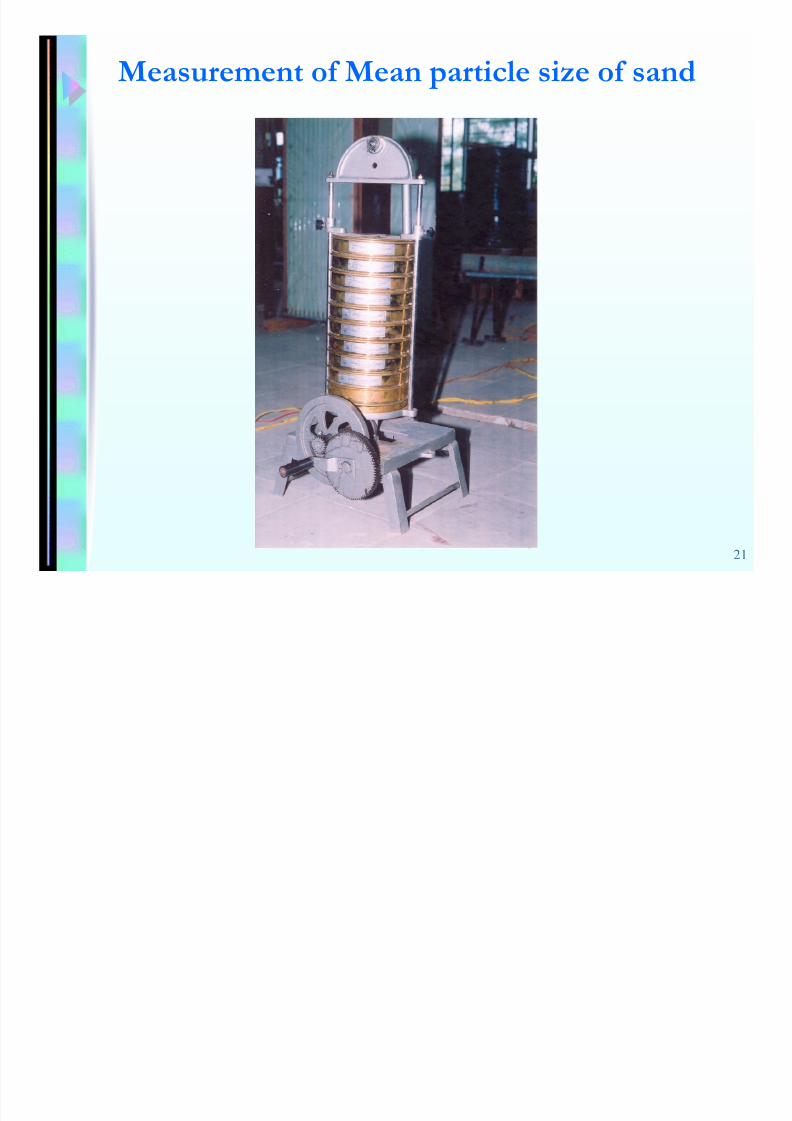
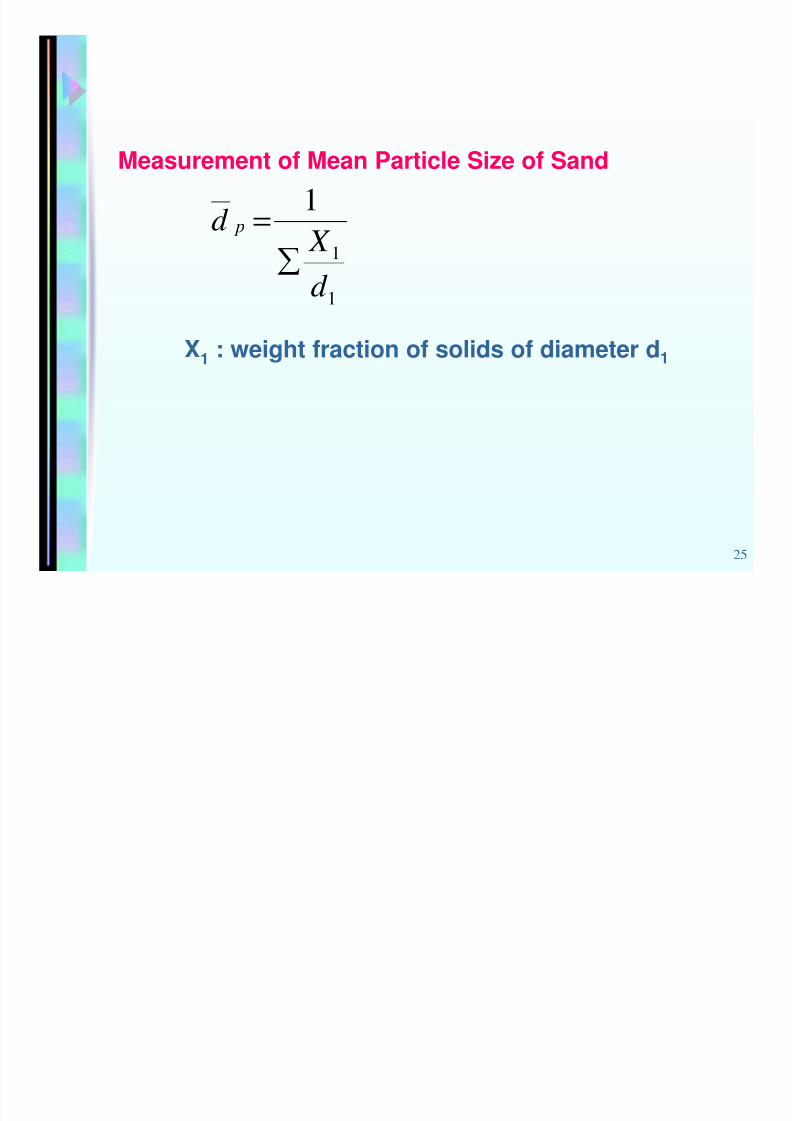
25
Measurement of Mean Particle Size of Sand
1
1
__ 1
d
X d p
=
X1 : weight fraction of solids of diameter d1
8/13/2019 Prof P Mahanta
http://slidepdf.com/reader/full/prof-p-mahanta 26/41
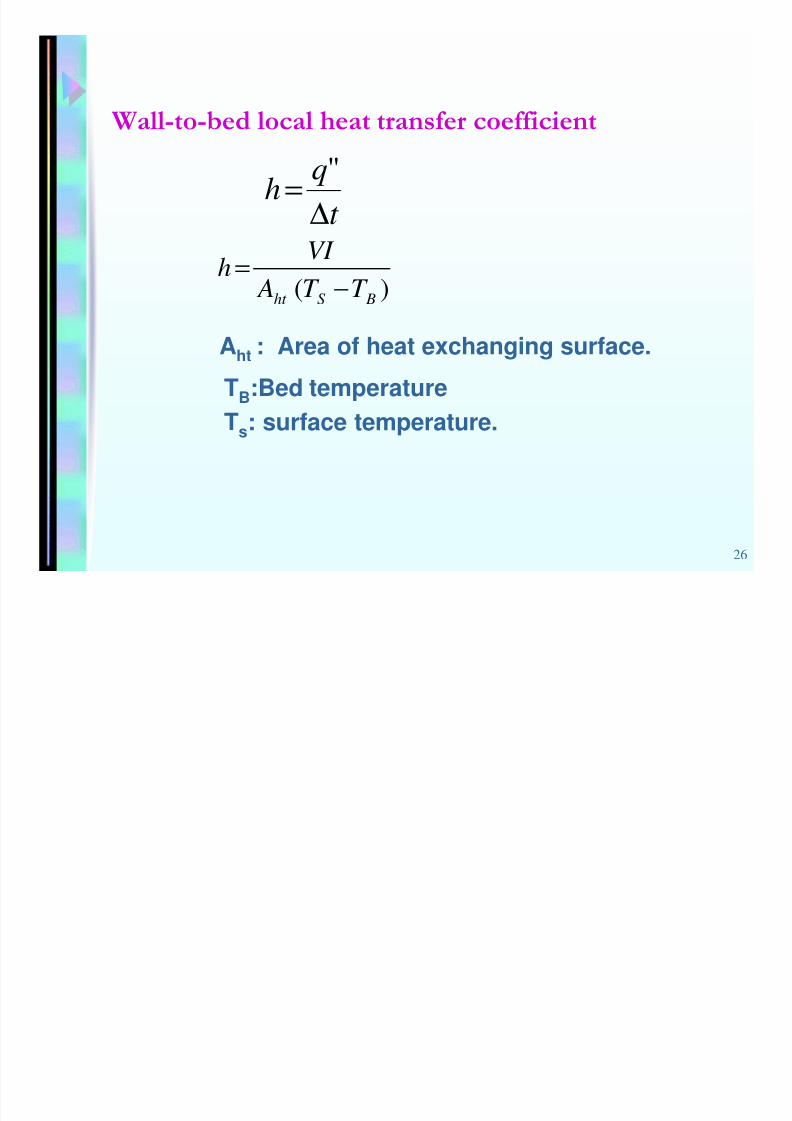
26
))$
t
qh
∆
= "
)( BS ht T T A
VI h
−=
Aht : Area of heat exchanging surface.
TB:Bed temperature
Ts: surface temperature.
8/13/2019 Prof P Mahanta
http://slidepdf.com/reader/full/prof-p-mahanta 27/41
27
Stage – 1Stage – 2
Stage – 3
Stage – 4 Stage – 5
Stage – 6
Hydrodynamic Behavior
8/13/2019 Prof P Mahanta
http://slidepdf.com/reader/full/prof-p-mahanta 28/41
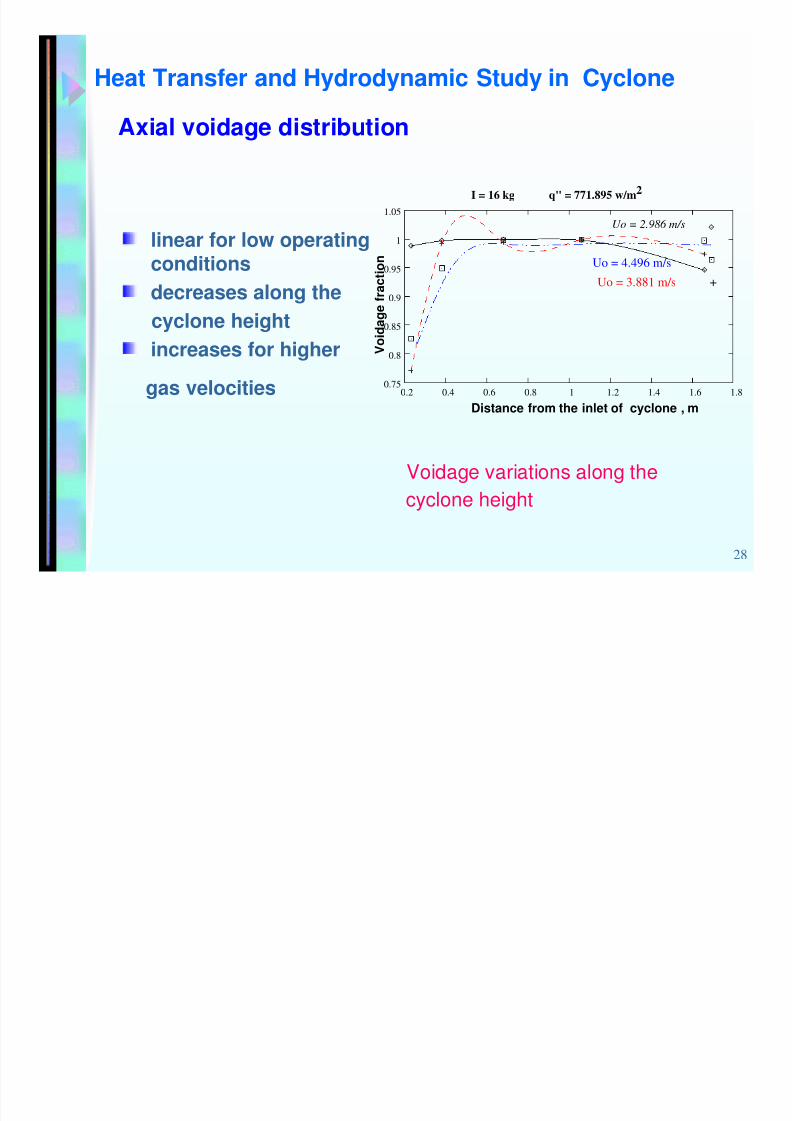
28
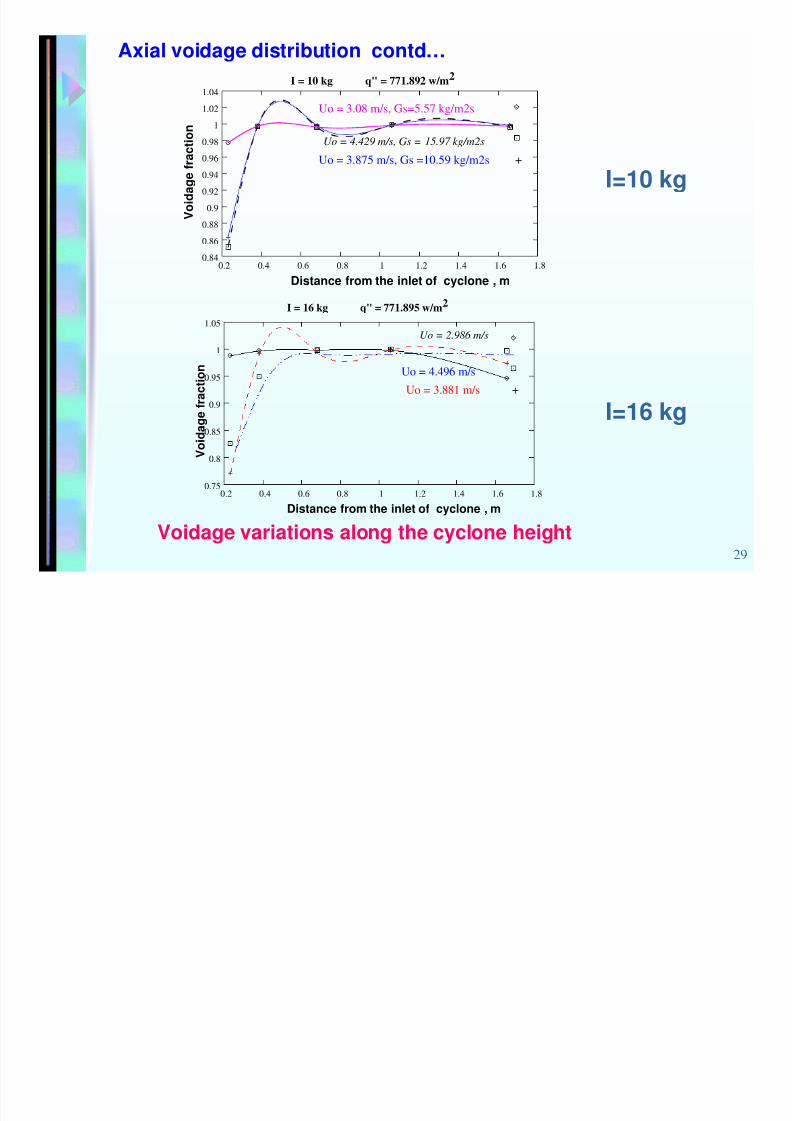
Axial voidage distribution
linear for low operatingconditions
decreases along the
cyclone heightincreases for higher
gas velocities
Voidage variations along the
cyclone height
Heat Transfer and Hydrodynamic Study in Cyclone
+
I = 16 kg
Distance from the inlet of cyclone , m
V o i d a g e f r a c t i o n
q" = 771.895 w/m2
Uo = 4.496 m/s
Uo = 3.881 m/s
Uo = 2.986 m/s
0.75
0.8
0.85
0.9
0.95
1
1.05
0.2 0.4 0.6 0.8 1 1.2 1.4 1.6 1.8
8/13/2019 Prof P Mahanta
http://slidepdf.com/reader/full/prof-p-mahanta 29/41
29
I=10 kg
I=16 kg
Voidage variations along the cyclone height
Axial voidage distribution contd…
+
Distance from the inlet of cyclone , m
V o i d a g e f r a c t i o n
Uo = 4.429 m/s, Gs = 15.97 kg/m2s
I = 10 kg q" = 771.892 w/m2
Uo = 3.08 m/s, Gs=5.57 kg/m2s
Uo = 3.875 m/s, Gs =10.59 kg/m2s
0.84
0.86
0.88
0.9
0.92
0.94
0.96
0.98
1
1.02
1.04
0.2 0.4 0.6 0.8 1 1.2 1.4 1.6 1.8
+
I = 16 kg
Distance from the inlet of cyclone , m
V o i d a g e f r a c t i o n
q" = 771.895 w/m2
Uo = 4.496 m/s
Uo = 3.881 m/s
Uo = 2.986 m/s
0.75
0.8
0.85
0.9
0.95
1
1.05
0.2 0.4 0.6 0.8 1 1.2 1.4 1.6 1.8
8/13/2019 Prof P Mahanta
http://slidepdf.com/reader/full/prof-p-mahanta 30/41
30
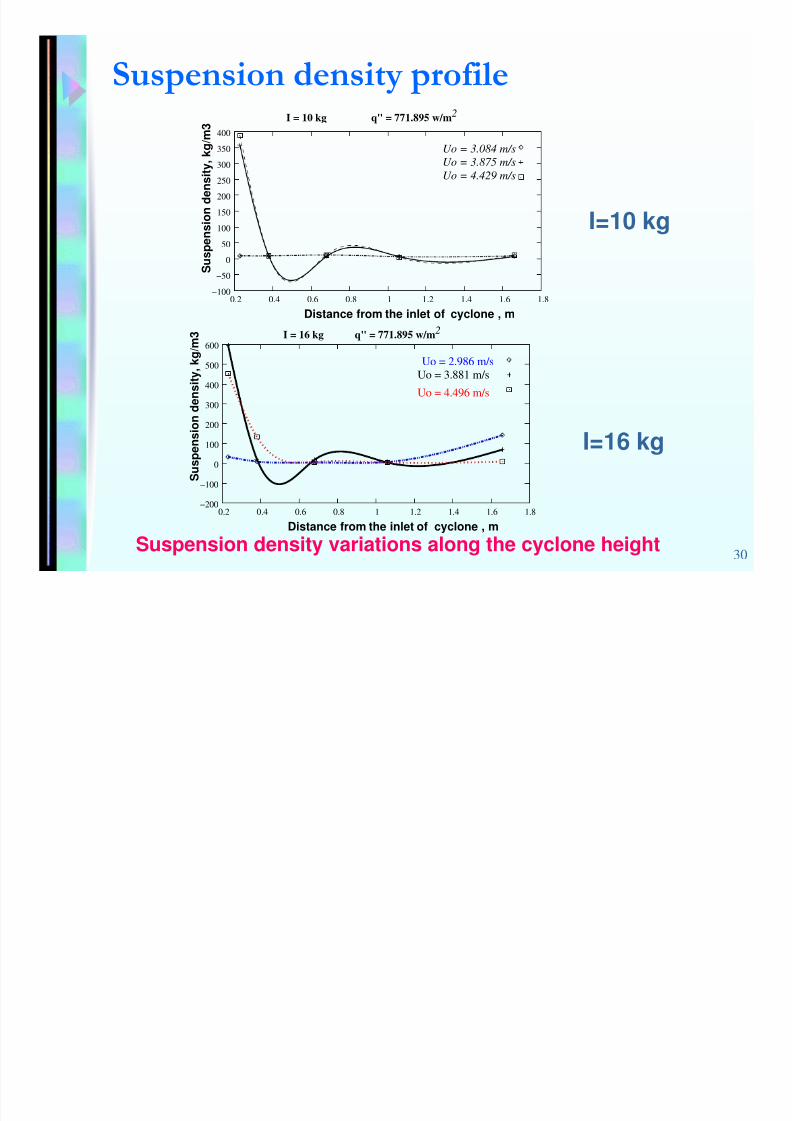
%
Uo = 3.875 m/s
Uo = 4.429 m/s
Uo = 3.084 m/s
I = 10 kg q" = 771.895 w/m2
Distance from the inlet of cyclone , m
S u s p e n s i o
n d e n s i t y ,
k g / m 3
−100
−50
0
50
100
150
200
250
300
350
400
0.2 0.4 0.6 0.8 1 1.2 1.4 1.6 1.8
I=10 kg
I=16 kg
Suspension density variations along the cyclone height
S u s p e n s i o n d e n s i t y ,
k g / m 3
Distance from the inlet of cyclone , m
2I = 16 kg q" = 771.895 w/m
Uo = 2.986 m/s
Uo = 3.881 m/s
Uo = 4.496 m/s
−200
−100
0
100
200
300
400
500
600
0.2 0.4 0.6 0.8 1 1.2 1.4 1.6 1.8
8/13/2019 Prof P Mahanta
http://slidepdf.com/reader/full/prof-p-mahanta 31/41
31
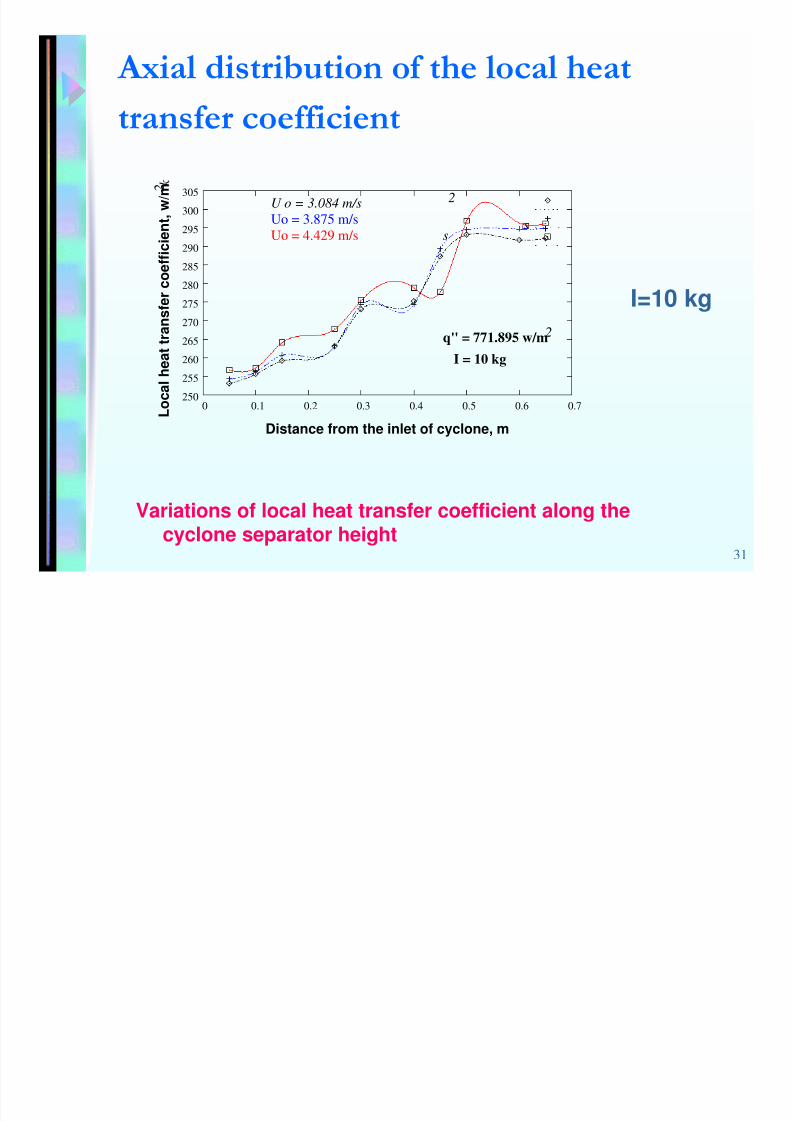
* $
Variations of local heat transfer coefficient along the
cyclone separator height
I=10 kg
s
2
2
s
Distance from the inlet of cyclone, m
I = 10 kg
2 k
L o c a l h e a t t r a n s f e r c o e f f i c i e n t , w / m
q" = 771.895 w/m
Uo = 3.875 m/sUo = 4.429 m/s
U o = 3.084 m/s
250
255
260
265 270
275
280
285
290
295
300
305
0 0.1 0.2 0.3 0.4 0.5 0.6 0.7
8/13/2019 Prof P Mahanta
http://slidepdf.com/reader/full/prof-p-mahanta 32/41
32
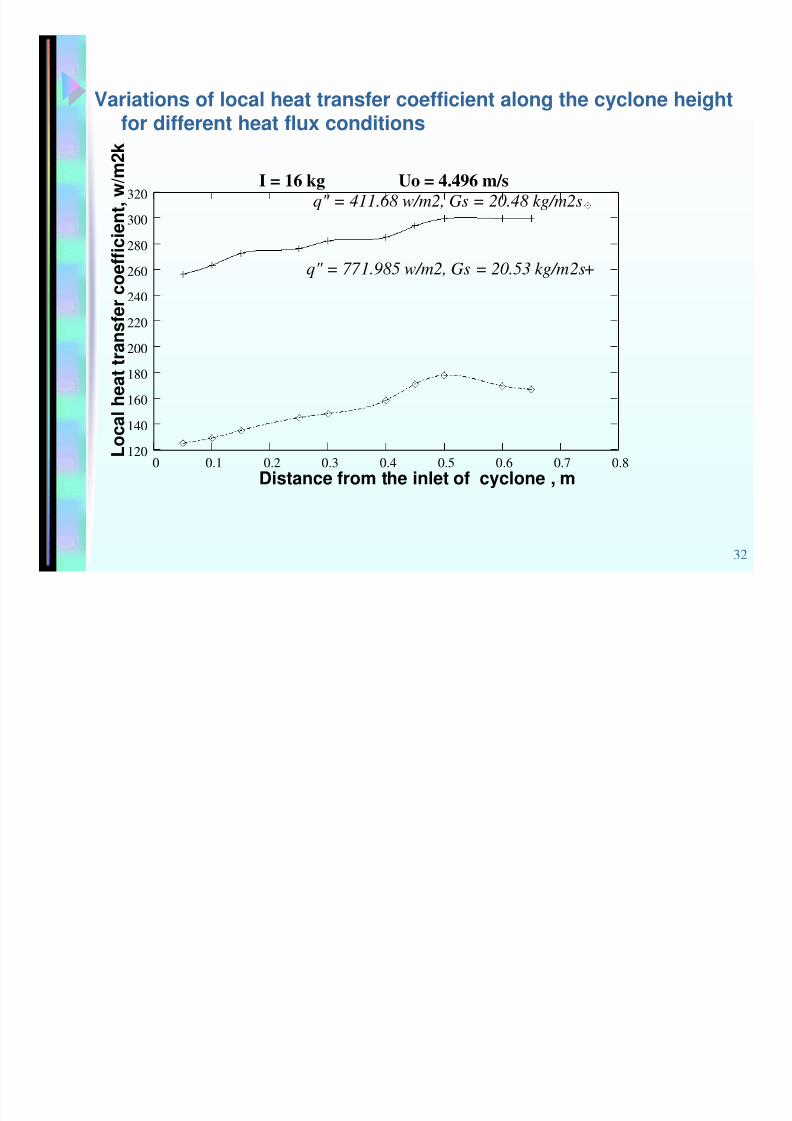
q" = 411.68 w/m2, Gs = 20.48 kg/m2s
q" = 771.985 w/m2, Gs = 20.53 kg/m2s+
L o c
a l h e a t t r a n s
f e r c o e f f i c i e n
t , w / m 2 k
Distance from the inlet of cyclone , m
I = 16 kg Uo = 4.496 m/s
120
140
160
180
200
220
240
260
280
300
320
0 0.1 0.2 0.3 0.4 0.5 0.6 0.7 0.8
Variations of local heat transfer coefficient along the cyclone heightfor different heat flux conditions
8/13/2019 Prof P Mahanta
http://slidepdf.com/reader/full/prof-p-mahanta 33/41
33
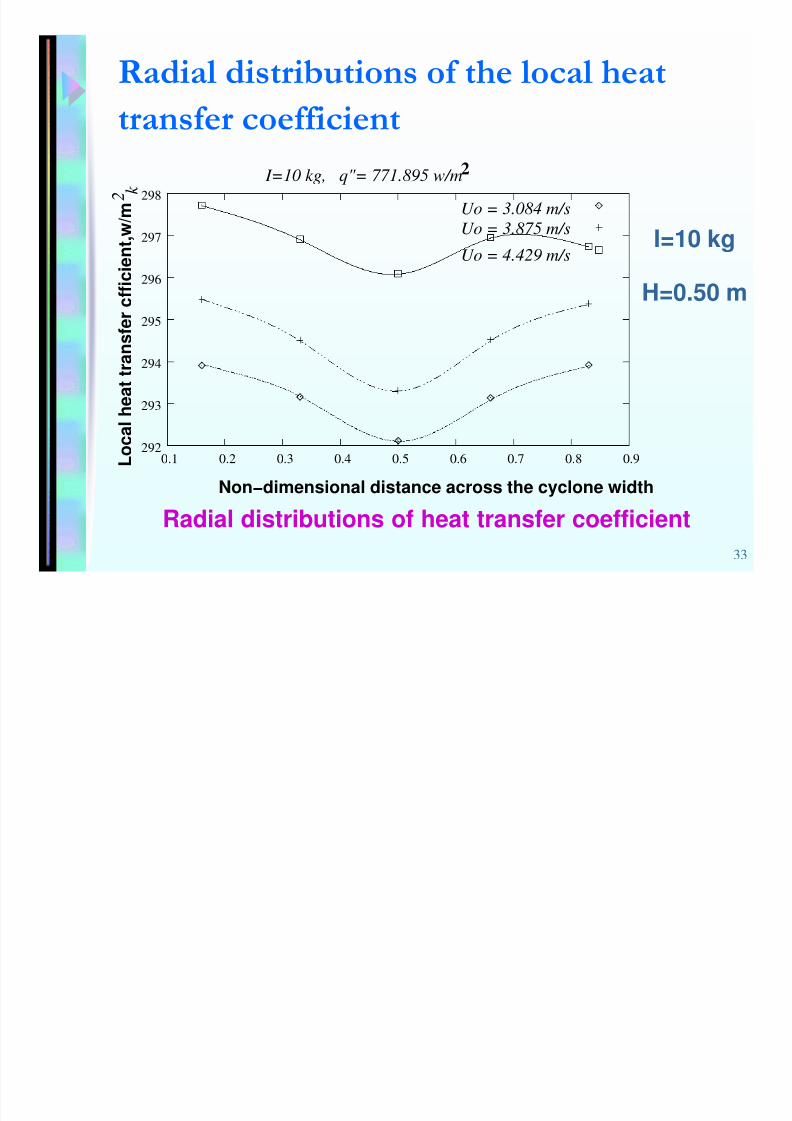
' $
Uo = 3.084 m/s
Uo = 3.875 m/s
Uo = 4.429 m/s
Non−dimensional distance across the cyclone width
k 2
L o c a
l h e a t t r a n s f e r c f f i c i e n t , w /
m
I=10 kg, q"= 771.895 w/m2
292
293
294
295
296
297
298
0.1 0.2 0.3 0.4 0.5 0.6 0.7 0.8 0.9
H=0.50 m
Radial distributions of heat transfer coefficient
I=10 kg
8/13/2019 Prof P Mahanta
http://slidepdf.com/reader/full/prof-p-mahanta 34/41
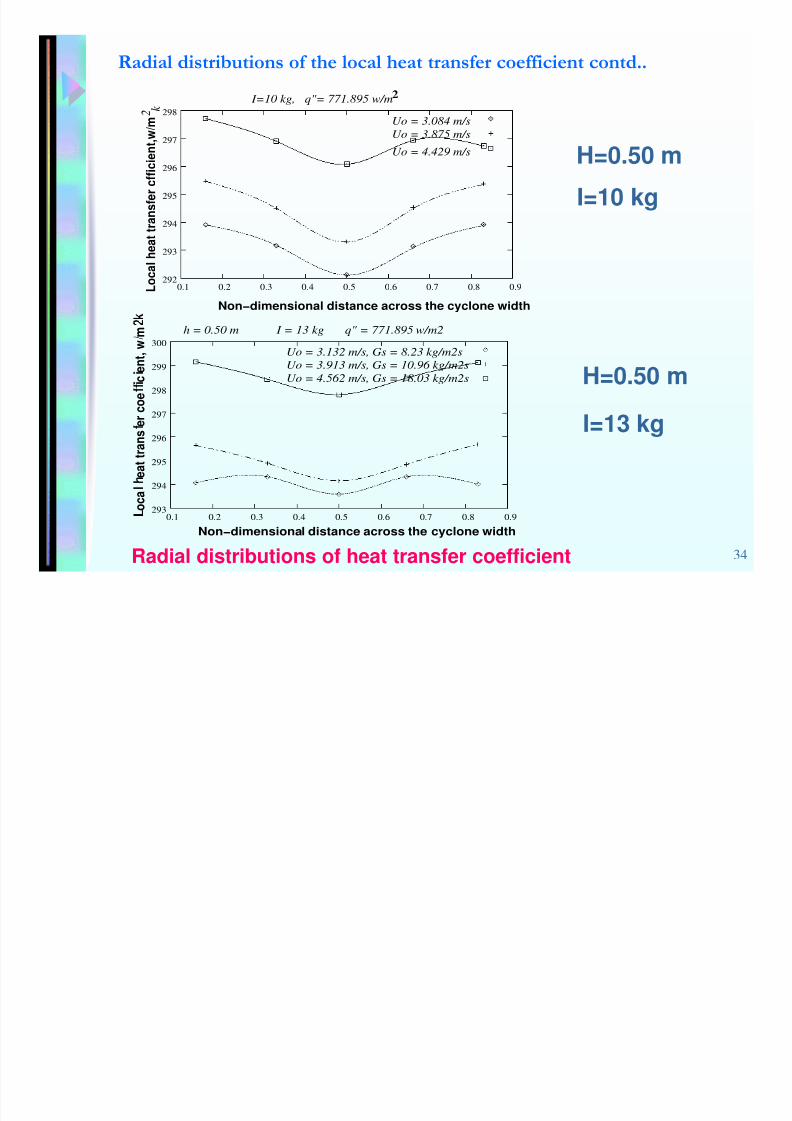
34
Uo = 3.084 m/s
Uo = 3.875 m/s
Uo = 4.429 m/s
Non−dimensional distance across the cyclone width
k
2
L o c a l h e a t t r a
n s f e r c f f i c i e n t , w / m
I=10 kg, q"= 771.895 w/m2
292
293
294
295
296
297
298
0.1 0.2 0.3 0.4 0.5 0.6 0.7 0.8 0.9
I = 13 kg q" = 771.895 w/m2h = 0.50 m
Uo = 3.132 m/s, Gs = 8.23 kg/m2s
Uo = 3.913 m/s, Gs = 10.96 kg/m2s
Uo = 4.562 m/s, Gs = 18.03 kg/m2s
o c a
e a t t r a n s
e r c o e
c e n t , w m
Non−dimensional distance across the cyclone width
293
294
295
296
297
298
299
300
0.1 0.2 0.3 0.4 0.5 0.6 0.7 0.8 0.9
I=10 kg
I=13 kg
H=0.50 m
' $ ++
Radial distributions of heat transfer coefficient
H=0.50 m

8/13/2019 Prof P Mahanta
http://slidepdf.com/reader/full/prof-p-mahanta 35/41
35
h = 0.10
h = 0.30
L o c a l h e a t t r a n s f e r c o e f f i c i e n t , w / m 2 k
Non−dimensional distance across the cyclone width
I = 16 kg Uo = 4.562 m/s, Gs = 18.98 kg/m2s q" = 411.68 w/m2
h = 0.50
120
130
140
150
160
170
180
0.1 0.2 0.3 0.4 0.5 0.6 0.7 0.8 0.9
' $ ++
Radial distributions of heat transfer coefficient
H=0.10 m
H=0.30 m
H=0.50 m
8/13/2019 Prof P Mahanta
http://slidepdf.com/reader/full/prof-p-mahanta 36/41
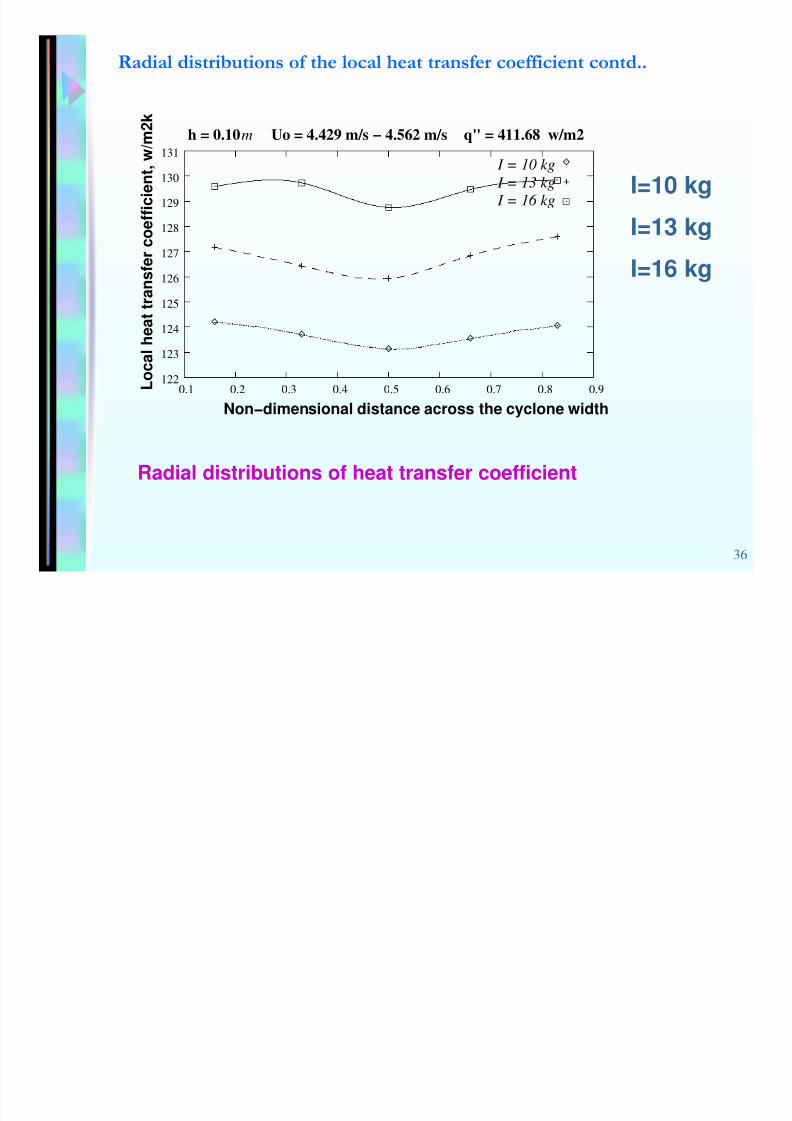
36
m
I = 13 kg
I = 16 kg
I = 10 kg
L o c a l h e a t t r a n s f e r c o e f f i c i e n t , w / m 2 k
Non−dimensional distance across the cyclone width
h = 0.10 Uo = 4.429 m/s − 4.562 m/s q" = 411.68 w/m2
122
123
124
125
126
127
128
129
130
131
0.1 0.2 0.3 0.4 0.5 0.6 0.7 0.8 0.9
' $ ++
Radial distributions of heat transfer coefficient
I=10 kg
I=13 kg
I=16 kg
8/13/2019 Prof P Mahanta
http://slidepdf.com/reader/full/prof-p-mahanta 37/41
37
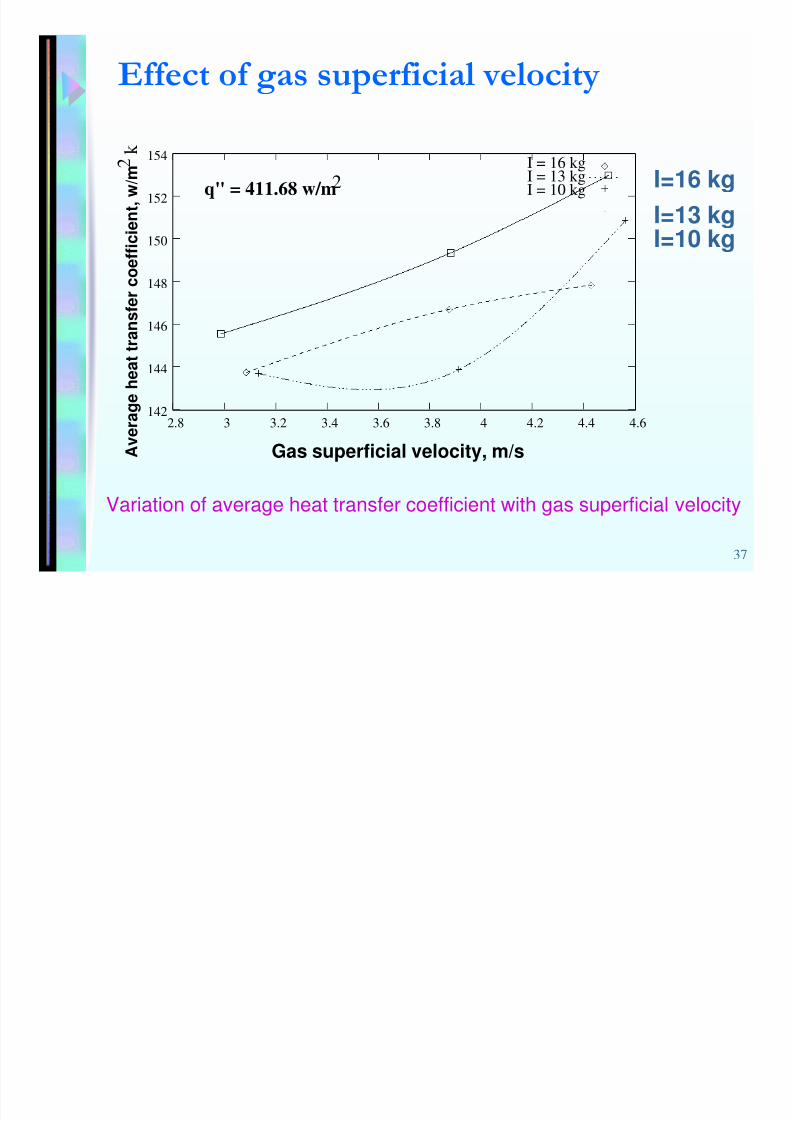
, %
I = 16 kgI = 13 kgI = 10 kg
2
k
2
Gas superficial velocity, m/s
q" = 411.68 w/m
A v e
r a g e h e a t t r a n
s f e r c o e f f i c i e n t , w / m
142
144
146
148
150
152
154
2.8 3 3.2 3.4 3.6 3.8 4 4.2 4.4 4.6
Variation of average heat transfer coefficient with gas superficial velocity
I=13 kg
I=16 kg
I=10 kg
8/13/2019 Prof P Mahanta
http://slidepdf.com/reader/full/prof-p-mahanta 38/41
38
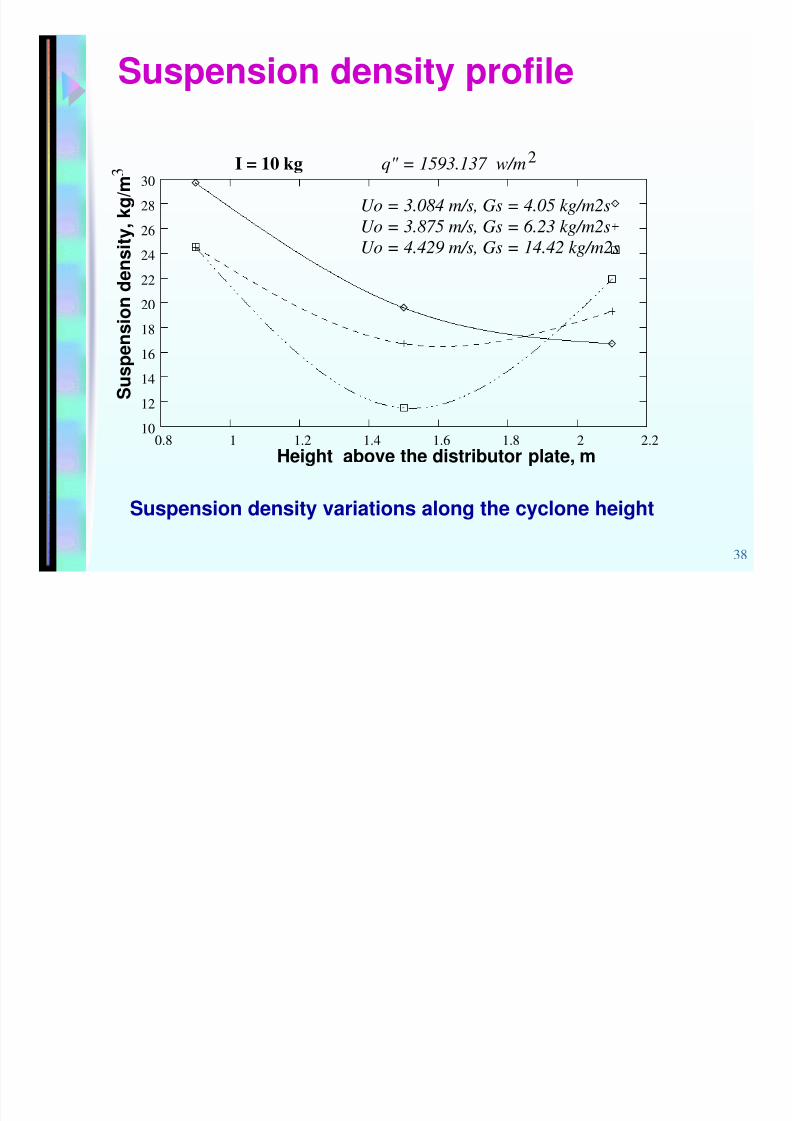
Suspension density profile
Uo = 4.429 m/s, Gs = 14.42 kg/m2sUo = 3.875 m/s, Gs = 6.23 kg/m2s
Uo = 3.084 m/s, Gs = 4.05 kg/m2s
Height above the distributor plate, m
I = 10 kg
S u s p e n s
i o n d e n s i t y ,
k g / m
q" = 1593.137 w/m2 3
10
12
14
16
18
20
22
24
26
28
30
0.8 1 1.2 1.4 1.6 1.8 2 2.2
Suspension density variations along the cyclone height
C l i
8/13/2019 Prof P Mahanta
http://slidepdf.com/reader/full/prof-p-mahanta 39/41
39
Conclusion
The axial and radial distribution profiles of theheat transfer coefficient in the cyclone separatorand are consistent with the corresponding solids
concentration
The heat transfer coefficient in the cyclone isfound to be increasing with increase in the solid
loading as well as gas superficial velocity
At a certain distance from the entry of thecyclone downstream along the height, the local
heat transfer coefficient is found to be maximum
8/13/2019 Prof P Mahanta
http://slidepdf.com/reader/full/prof-p-mahanta 40/41
40
Conclusion contd…
On the upper splash zone of riser an increasing-
decreasing trend of local heat transfer coefficientHeat transfer coefficient increases with solidcirculation rate
The heat transfer coefficient generally increases
with the solids holdup, but their relationshipexperiences different trends under the differentoperating conditions and at different cyclone and
riser locations

8/13/2019 Prof P Mahanta
http://slidepdf.com/reader/full/prof-p-mahanta 41/41
41