tables - mhlw酸化チタン(ナノ粒子、アナターゼ型)のrash2 マウス...
TRANSCRIPT
酸化チタン(ナノ粒子、アナターゼ型)の rasH2 マウス を用いた吸入による中期がん原性試験報告書
試験番号:0887
TABLES
(Study No. 0887)
TABLES TABLE A CONCENTRATIONS OF TITANIUM DIOXIDE IN THE INHALATION
CHAMBER OF rasH2 MICE IN THE 26-WEEK CARCINOGENICITY STUDY
TABLE B1 SURVIVAL ANIMAL NUMBERS: MALE TABLE B2 SURVIVAL ANIMAL NUMBERS: FEMALE TABLE C1 CLINICAL OBSERVATION: MALE TABLE C2 CLINICAL OBSERVATION: FEMALE TABLE D1 BODY WEIGHT CHANGES AND SURVIVAL ANIMAL NUMBERS :
MALE TABLE D2 BODY WEIGHT CHANGES AND SURVIVAL ANIMAL NUMBERS :
FEMALE TABLE D3 BODY WEIGHT CHANGES: MALE TABLE D4 BODY WEIGHT CHANGES: FEMALE TABLE E1 FOOD CONSUMPTION CHANGES AND SURVIVAL ANIMAL
NUMBERS : MALE TABLE E2 FOOD CONSUMPTION CHANGES AND SURVIVAL ANIMAL
NUMBERS : FEMALE TABLE E3 FOOD CONSUMPTION CHANGES: MALE TABLE E4 FOOD CONSUMPTION CHANGES: FEMALE TABLE F1 HEMATOLOGY: MALE TABLE F2 HEMATOLOGY: FEMALE TABLE G1 BIOCHEMISTRY: MALE TABLE G2 BIOCHEMISTRY: FEMALE
(Study No. 0887)
TABLES (CONTINUED) TABLE H1 GROSS FINDINGS: MALE TABLE H2 GROSS FINDINGS: FEMALE TABLE I1 ORGAN WEIGHT, ABSOLUTE: MALE TABLE I2 ORGAN WEIGHT, ABSOLUTE: FEMALE TABLE J1 ORGAN WEIGHT, RELATIVE: MALE TABLE J2 ORGAN WEIGHT, RELATIVE: FEMALE TABLE K1 HISTOPATHOLOGICAL FINDINGS: NEOPLASTIC LESIONS : MALE TABLE K2 HISTOPATHOLOGICAL FINDINGS: NEOPLASTICLESIONS :
FEMALE TABLE L1 NEOPLASTIC LESIONS-INCIDENCE AND STATISTICAL ANALYSIS:
MALE TABLE L2 NEOPLASTIC LESIONS-INCIDENCE AND STATISTICAL ANALYSIS:
FEMALE TABLE M1 NUMBER OF ANIMALS WITH TUMORS AND NUMBER OF
TUMORS - TIME RELATED : MALE TABLE M2 NUMBER OF ANIMALS WITH TUMORS AND NUMBER OF
TUMORS - TIME RELATED : FEMALE TABLE N HISTOPATHOLOGICAL FINDINGS: METASTASIS OF TUMOR:
FEMALE TABLE O1 HISTOPATHOLOGICAL FINDINGS: NON-NEOPLASTIC LESIONS : MALE TABLE O2 HISTOPATHOLOGICAL FINDINGS: NON-NEOPLASTIC LESIONS : FEMALE
(Study No. 0887)
TABLES (CONTINUED) TABLE P1 CAUSE OF DEATH: MALE TABLE P2 CAUSE OF DEATH: FEMALE
TABLE A
CONCENTRATIONS OF TITANIUM DIOXIDE
IN THE INHALATION CHAMBER OF rasH2 MICE
IN THE 26-WEEK CARCINOGENICITY STUDY
(Study No.0887)
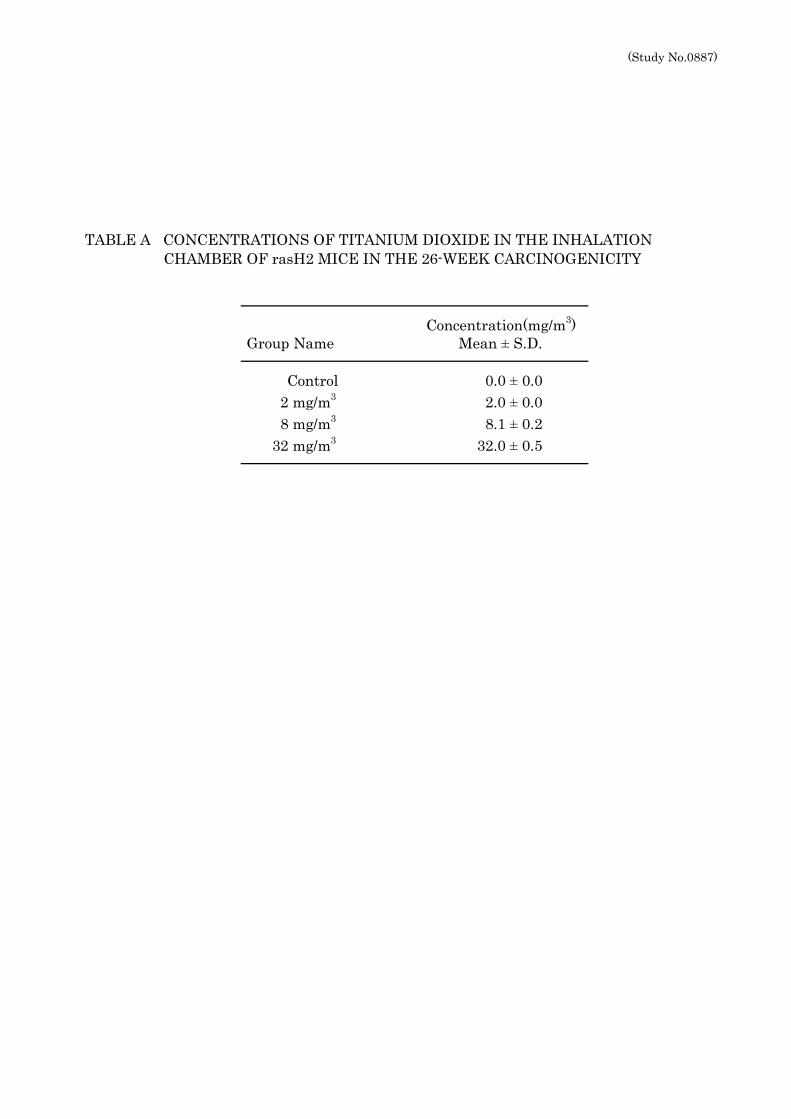
Mean ± S.D.
Control 0.0 ± 0.0 2 mg/m3 2.0 ± 0.0 8 mg/m3 8.1 ± 0.2
32 mg/m3 32.0 ± 0.5
TABLE A CONCENTRATIONS OF TITANIUM DIOXIDE IN THE INHALATION CHAMBER OF rasH2 MICE IN THE 26-WEEK CARCINOGENICITY
Group NameConcentration(mg/m3)
TABLE B1
SURVIVAL ANIMAL NUMBERS : MALE
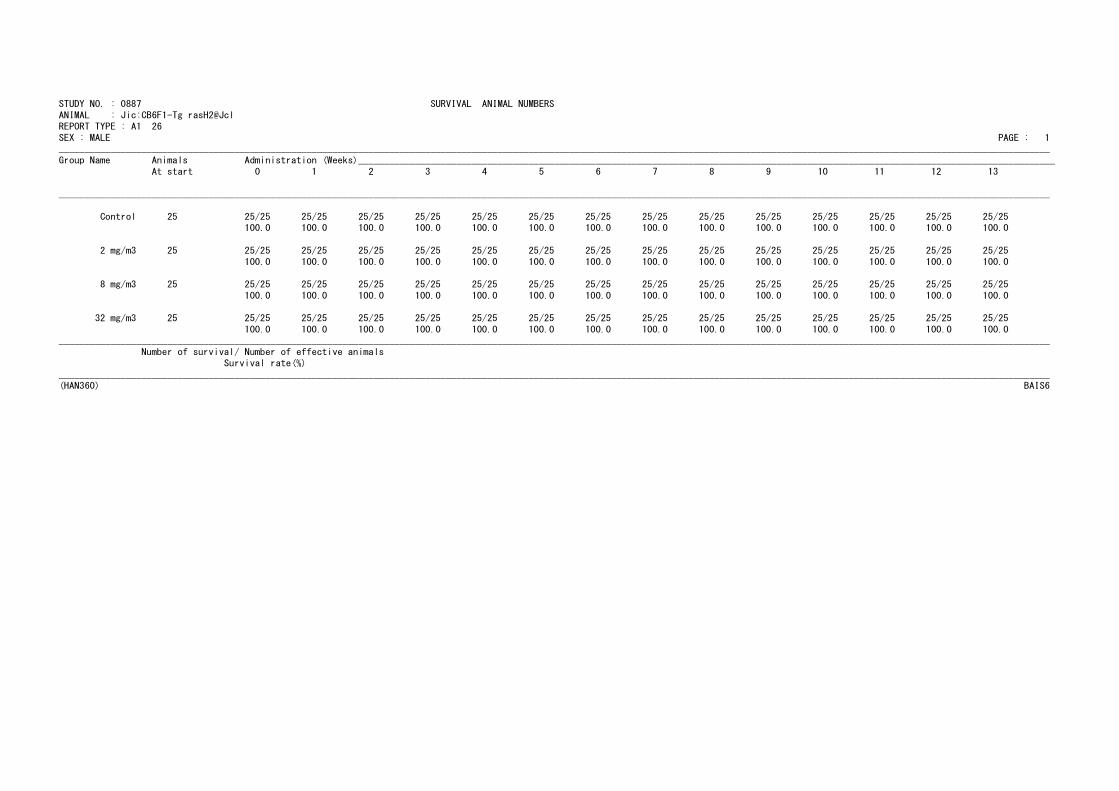
STUDY NO. : 0887 SURVIVAL ANIMAL NUMBERS
ANIMAL : Jic:CB6F1-Tg rasH2@JclREPORT TYPE : A1 26
SEX : MALE PAGE : 1________________________________________________________________________________________________________________________________________________________________________________________________
Group Name Animals Administration (Weeks)_______________________________________________________________________________________________________________________________________
At start 0 1 2 3 4 5 6 7 8 9 10 11 12 13
________________________________________________________________________________________________________________________________________________________________________________________________
Control 25 25/25 25/25 25/25 25/25 25/25 25/25 25/25 25/25 25/25 25/25 25/25 25/25 25/25 25/25100.0 100.0 100.0 100.0 100.0 100.0 100.0 100.0 100.0 100.0 100.0 100.0 100.0 100.0
2 mg/m3 25 25/25 25/25 25/25 25/25 25/25 25/25 25/25 25/25 25/25 25/25 25/25 25/25 25/25 25/25
100.0 100.0 100.0 100.0 100.0 100.0 100.0 100.0 100.0 100.0 100.0 100.0 100.0 100.0
8 mg/m3 25 25/25 25/25 25/25 25/25 25/25 25/25 25/25 25/25 25/25 25/25 25/25 25/25 25/25 25/25
100.0 100.0 100.0 100.0 100.0 100.0 100.0 100.0 100.0 100.0 100.0 100.0 100.0 100.0
32 mg/m3 25 25/25 25/25 25/25 25/25 25/25 25/25 25/25 25/25 25/25 25/25 25/25 25/25 25/25 25/25
100.0 100.0 100.0 100.0 100.0 100.0 100.0 100.0 100.0 100.0 100.0 100.0 100.0 100.0
________________________________________________________________________________________________________________________________________________________________________________________________Number of survival/ Number of effective animals
Survival rate(%)
________________________________________________________________________________________________________________________________________________________________________________________________(HAN360) BAIS6
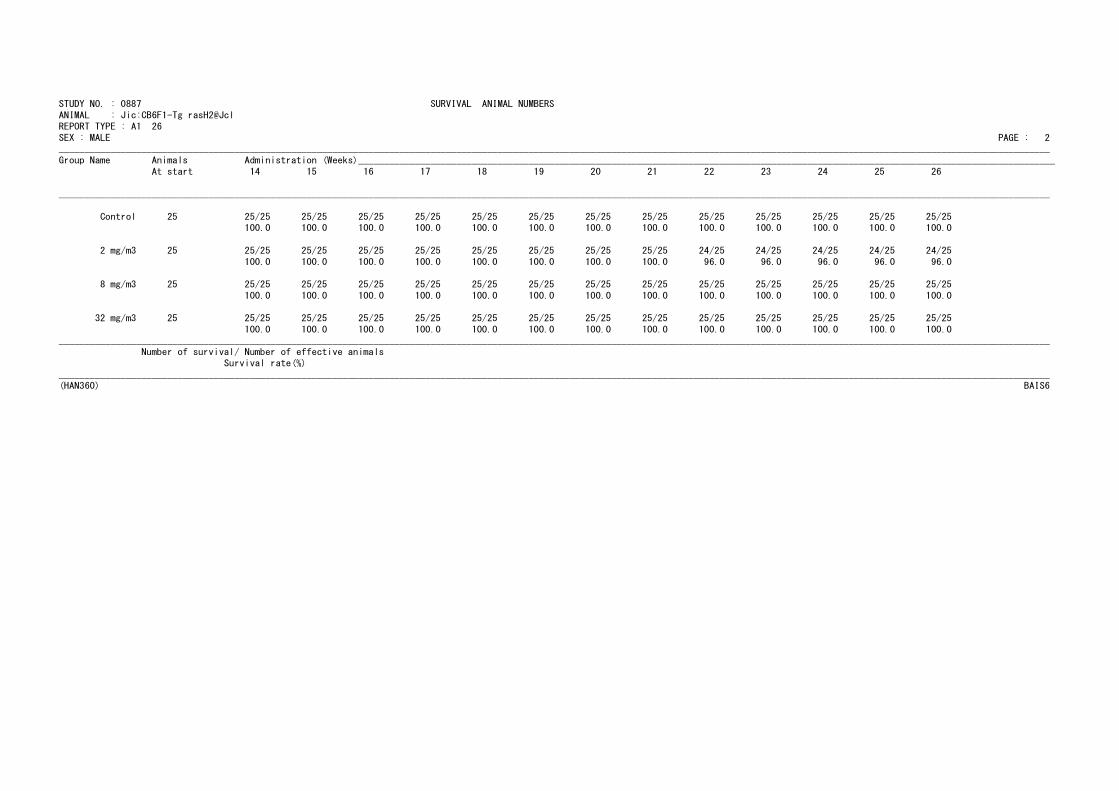
STUDY NO. : 0887 SURVIVAL ANIMAL NUMBERS
ANIMAL : Jic:CB6F1-Tg rasH2@JclREPORT TYPE : A1 26
SEX : MALE PAGE : 2________________________________________________________________________________________________________________________________________________________________________________________________
Group Name Animals Administration (Weeks)_______________________________________________________________________________________________________________________________________
At start 14 15 16 17 18 19 20 21 22 23 24 25 26
________________________________________________________________________________________________________________________________________________________________________________________________
Control 25 25/25 25/25 25/25 25/25 25/25 25/25 25/25 25/25 25/25 25/25 25/25 25/25 25/25100.0 100.0 100.0 100.0 100.0 100.0 100.0 100.0 100.0 100.0 100.0 100.0 100.0
2 mg/m3 25 25/25 25/25 25/25 25/25 25/25 25/25 25/25 25/25 24/25 24/25 24/25 24/25 24/25
100.0 100.0 100.0 100.0 100.0 100.0 100.0 100.0 96.0 96.0 96.0 96.0 96.0
8 mg/m3 25 25/25 25/25 25/25 25/25 25/25 25/25 25/25 25/25 25/25 25/25 25/25 25/25 25/25
100.0 100.0 100.0 100.0 100.0 100.0 100.0 100.0 100.0 100.0 100.0 100.0 100.0
32 mg/m3 25 25/25 25/25 25/25 25/25 25/25 25/25 25/25 25/25 25/25 25/25 25/25 25/25 25/25
100.0 100.0 100.0 100.0 100.0 100.0 100.0 100.0 100.0 100.0 100.0 100.0 100.0
________________________________________________________________________________________________________________________________________________________________________________________________Number of survival/ Number of effective animals
Survival rate(%)
________________________________________________________________________________________________________________________________________________________________________________________________(HAN360) BAIS6
TABLE B2
SURVIVAL ANIMAL NUMBERS : FEMALE

STUDY NO. : 0887 SURVIVAL ANIMAL NUMBERS
ANIMAL : Jic:CB6F1-Tg rasH2@JclREPORT TYPE : A1 26
SEX : FEMALE PAGE : 3________________________________________________________________________________________________________________________________________________________________________________________________
Group Name Animals Administration (Weeks)_______________________________________________________________________________________________________________________________________
At start 0 1 2 3 4 5 6 7 8 9 10 11 12 13
________________________________________________________________________________________________________________________________________________________________________________________________
Control 25 25/25 25/25 25/25 25/25 25/25 25/25 25/25 25/25 25/25 25/25 25/25 25/25 25/25 25/25100.0 100.0 100.0 100.0 100.0 100.0 100.0 100.0 100.0 100.0 100.0 100.0 100.0 100.0
2 mg/m3 25 25/25 25/25 25/25 25/25 25/25 25/25 25/25 25/25 25/25 25/25 25/25 25/25 25/25 25/25
100.0 100.0 100.0 100.0 100.0 100.0 100.0 100.0 100.0 100.0 100.0 100.0 100.0 100.0
8 mg/m3 25 25/25 25/25 25/25 25/25 25/25 25/25 25/25 25/25 25/25 25/25 25/25 25/25 25/25 25/25
100.0 100.0 100.0 100.0 100.0 100.0 100.0 100.0 100.0 100.0 100.0 100.0 100.0 100.0
32 mg/m3 25 25/25 25/25 25/25 25/25 25/25 25/25 25/25 25/25 25/25 25/25 25/25 25/25 25/25 25/25
100.0 100.0 100.0 100.0 100.0 100.0 100.0 100.0 100.0 100.0 100.0 100.0 100.0 100.0
________________________________________________________________________________________________________________________________________________________________________________________________Number of survival/ Number of effective animals
Survival rate(%)
________________________________________________________________________________________________________________________________________________________________________________________________(HAN360) BAIS6

STUDY NO. : 0887 SURVIVAL ANIMAL NUMBERS
ANIMAL : Jic:CB6F1-Tg rasH2@JclREPORT TYPE : A1 26
SEX : FEMALE PAGE : 4________________________________________________________________________________________________________________________________________________________________________________________________
Group Name Animals Administration (Weeks)_______________________________________________________________________________________________________________________________________
At start 14 15 16 17 18 19 20 21 22 23 24 25 26
________________________________________________________________________________________________________________________________________________________________________________________________
Control 25 25/25 25/25 25/25 25/25 25/25 25/25 25/25 25/25 25/25 25/25 25/25 25/25 24/25100.0 100.0 100.0 100.0 100.0 100.0 100.0 100.0 100.0 100.0 100.0 100.0 96.0
2 mg/m3 25 25/25 25/25 25/25 25/25 25/25 25/25 25/25 25/25 25/25 25/25 25/25 25/25 25/25
100.0 100.0 100.0 100.0 100.0 100.0 100.0 100.0 100.0 100.0 100.0 100.0 100.0
8 mg/m3 25 25/25 25/25 25/25 25/25 25/25 25/25 25/25 25/25 25/25 25/25 24/25 24/25 24/25
100.0 100.0 100.0 100.0 100.0 100.0 100.0 100.0 100.0 100.0 96.0 96.0 96.0
32 mg/m3 25 25/25 25/25 25/25 25/25 25/25 24/25 24/25 24/25 24/25 24/25 23/25 23/25 23/25
100.0 100.0 100.0 100.0 100.0 96.0 96.0 96.0 96.0 96.0 92.0 92.0 92.0
________________________________________________________________________________________________________________________________________________________________________________________________Number of survival/ Number of effective animals
Survival rate(%)
________________________________________________________________________________________________________________________________________________________________________________________________(HAN360) BAIS6
TABLE C1
CLINICAL OBSERVATION : MALE
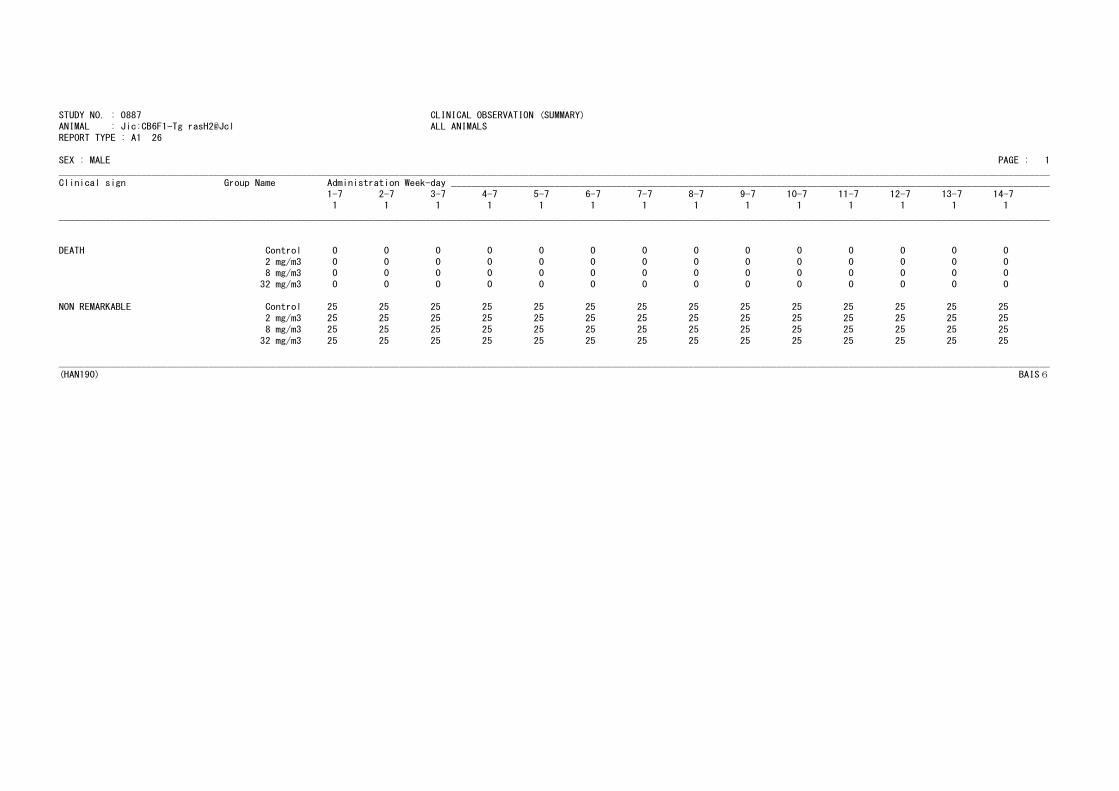
STUDY NO. : 0887 CLINICAL OBSERVATION (SUMMARY)ANIMAL : Jic:CB6F1-Tg rasH2@Jcl ALL ANIMALS
REPORT TYPE : A1 26
SEX : MALE PAGE : 1
________________________________________________________________________________________________________________________________________________________________________________________________
Clinical sign Group Name Administration Week-day ____________________________________________________________________________________________________________________1-7 2-7 3-7 4-7 5-7 6-7 7-7 8-7 9-7 10-7 11-7 12-7 13-7 14-71 1 1 1 1 1 1 1 1 1 1 1 1 1
________________________________________________________________________________________________________________________________________________________________________________________________
DEATH Control 0 0 0 0 0 0 0 0 0 0 0 0 0 0
2 mg/m3 0 0 0 0 0 0 0 0 0 0 0 0 0 08 mg/m3 0 0 0 0 0 0 0 0 0 0 0 0 0 0
32 mg/m3 0 0 0 0 0 0 0 0 0 0 0 0 0 0
NON REMARKABLE Control 25 25 25 25 25 25 25 25 25 25 25 25 25 25
2 mg/m3 25 25 25 25 25 25 25 25 25 25 25 25 25 25
8 mg/m3 25 25 25 25 25 25 25 25 25 25 25 25 25 25
32 mg/m3 25 25 25 25 25 25 25 25 25 25 25 25 25 25
________________________________________________________________________________________________________________________________________________________________________________________________
(HAN190) BAIS6
STUDY NO. : 0887 CLINICAL OBSERVATION (SUMMARY)ANIMAL : Jic:CB6F1-Tg rasH2@Jcl ALL ANIMALS
REPORT TYPE : A1 26
SEX : MALE PAGE : 2
________________________________________________________________________________________________________________________________________________________________________________________________
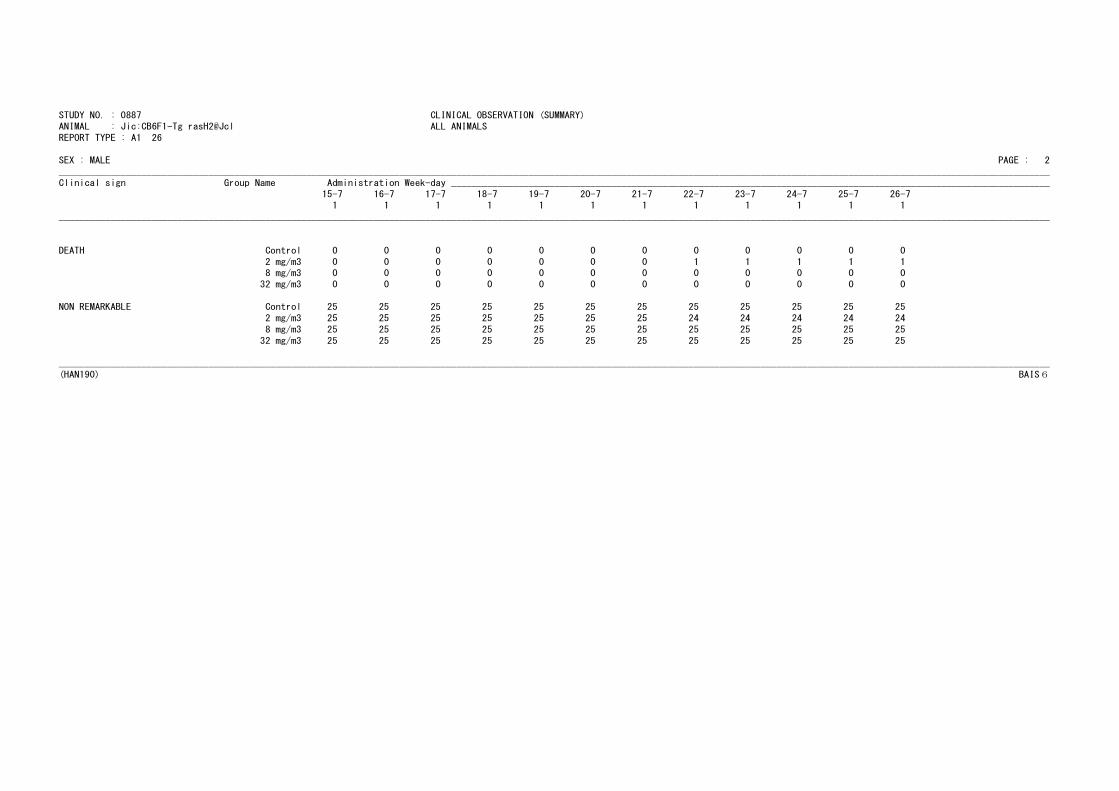
Clinical sign Group Name Administration Week-day ____________________________________________________________________________________________________________________15-7 16-7 17-7 18-7 19-7 20-7 21-7 22-7 23-7 24-7 25-7 26-7
1 1 1 1 1 1 1 1 1 1 1 1
________________________________________________________________________________________________________________________________________________________________________________________________
DEATH Control 0 0 0 0 0 0 0 0 0 0 0 0
2 mg/m3 0 0 0 0 0 0 0 1 1 1 1 18 mg/m3 0 0 0 0 0 0 0 0 0 0 0 0
32 mg/m3 0 0 0 0 0 0 0 0 0 0 0 0
NON REMARKABLE Control 25 25 25 25 25 25 25 25 25 25 25 25
2 mg/m3 25 25 25 25 25 25 25 24 24 24 24 24
8 mg/m3 25 25 25 25 25 25 25 25 25 25 25 25
32 mg/m3 25 25 25 25 25 25 25 25 25 25 25 25
________________________________________________________________________________________________________________________________________________________________________________________________
(HAN190) BAIS6
TABLE C2
CLINICAL OBSERVATION : FEMALE
STUDY NO. : 0887 CLINICAL OBSERVATION (SUMMARY)ANIMAL : Jic:CB6F1-Tg rasH2@Jcl ALL ANIMALS
REPORT TYPE : A1 26
SEX : FEMALE PAGE : 3
________________________________________________________________________________________________________________________________________________________________________________________________
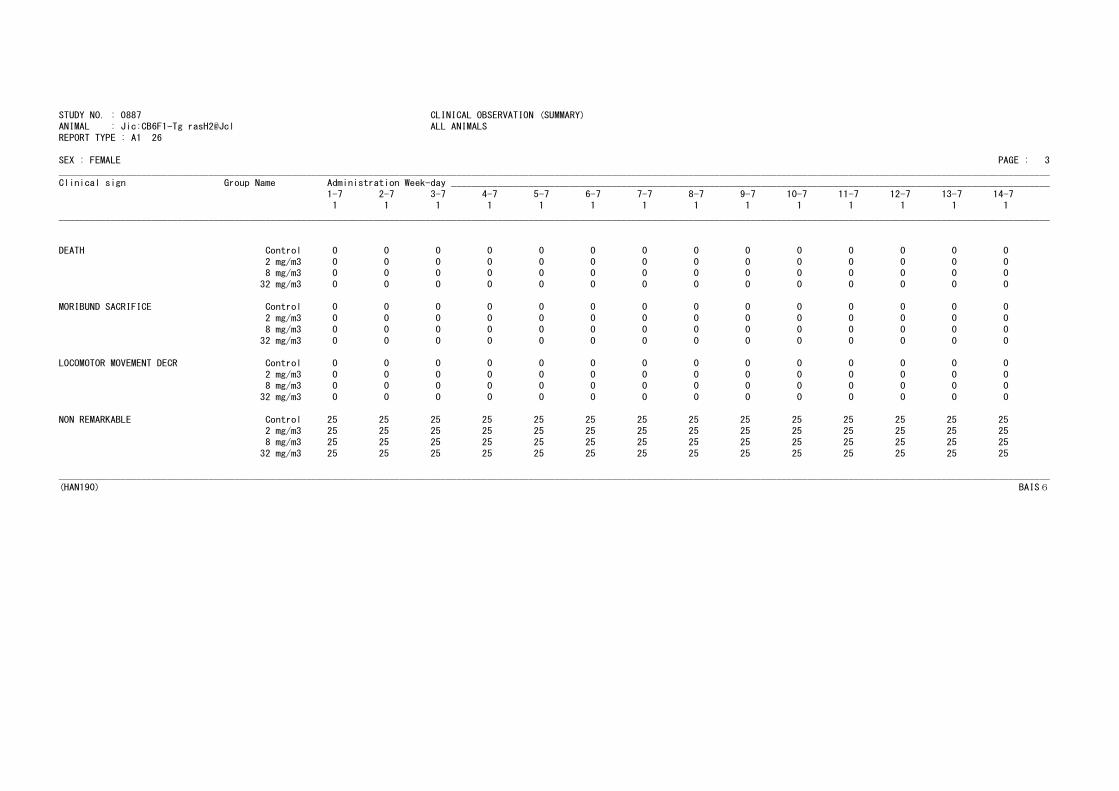
Clinical sign Group Name Administration Week-day ____________________________________________________________________________________________________________________1-7 2-7 3-7 4-7 5-7 6-7 7-7 8-7 9-7 10-7 11-7 12-7 13-7 14-71 1 1 1 1 1 1 1 1 1 1 1 1 1
________________________________________________________________________________________________________________________________________________________________________________________________
DEATH Control 0 0 0 0 0 0 0 0 0 0 0 0 0 0
2 mg/m3 0 0 0 0 0 0 0 0 0 0 0 0 0 08 mg/m3 0 0 0 0 0 0 0 0 0 0 0 0 0 0
32 mg/m3 0 0 0 0 0 0 0 0 0 0 0 0 0 0
MORIBUND SACRIFICE Control 0 0 0 0 0 0 0 0 0 0 0 0 0 0
2 mg/m3 0 0 0 0 0 0 0 0 0 0 0 0 0 0
8 mg/m3 0 0 0 0 0 0 0 0 0 0 0 0 0 0
32 mg/m3 0 0 0 0 0 0 0 0 0 0 0 0 0 0
LOCOMOTOR MOVEMENT DECR Control 0 0 0 0 0 0 0 0 0 0 0 0 0 0
2 mg/m3 0 0 0 0 0 0 0 0 0 0 0 0 0 08 mg/m3 0 0 0 0 0 0 0 0 0 0 0 0 0 0
32 mg/m3 0 0 0 0 0 0 0 0 0 0 0 0 0 0
NON REMARKABLE Control 25 25 25 25 25 25 25 25 25 25 25 25 25 252 mg/m3 25 25 25 25 25 25 25 25 25 25 25 25 25 258 mg/m3 25 25 25 25 25 25 25 25 25 25 25 25 25 25
32 mg/m3 25 25 25 25 25 25 25 25 25 25 25 25 25 25
________________________________________________________________________________________________________________________________________________________________________________________________
(HAN190) BAIS6
STUDY NO. : 0887 CLINICAL OBSERVATION (SUMMARY)ANIMAL : Jic:CB6F1-Tg rasH2@Jcl ALL ANIMALS
REPORT TYPE : A1 26
SEX : FEMALE PAGE : 4
________________________________________________________________________________________________________________________________________________________________________________________________
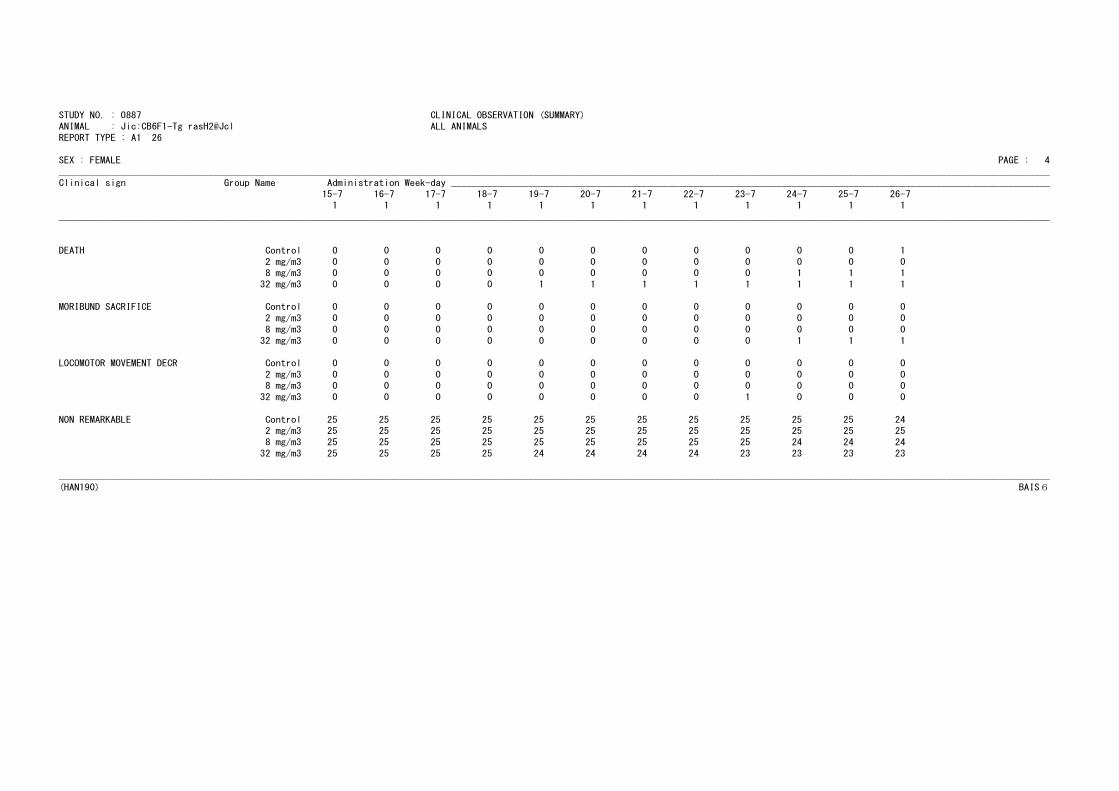
Clinical sign Group Name Administration Week-day ____________________________________________________________________________________________________________________15-7 16-7 17-7 18-7 19-7 20-7 21-7 22-7 23-7 24-7 25-7 26-7
1 1 1 1 1 1 1 1 1 1 1 1
________________________________________________________________________________________________________________________________________________________________________________________________
DEATH Control 0 0 0 0 0 0 0 0 0 0 0 1
2 mg/m3 0 0 0 0 0 0 0 0 0 0 0 08 mg/m3 0 0 0 0 0 0 0 0 0 1 1 1
32 mg/m3 0 0 0 0 1 1 1 1 1 1 1 1
MORIBUND SACRIFICE Control 0 0 0 0 0 0 0 0 0 0 0 0
2 mg/m3 0 0 0 0 0 0 0 0 0 0 0 0
8 mg/m3 0 0 0 0 0 0 0 0 0 0 0 0
32 mg/m3 0 0 0 0 0 0 0 0 0 1 1 1
LOCOMOTOR MOVEMENT DECR Control 0 0 0 0 0 0 0 0 0 0 0 0
2 mg/m3 0 0 0 0 0 0 0 0 0 0 0 08 mg/m3 0 0 0 0 0 0 0 0 0 0 0 0
32 mg/m3 0 0 0 0 0 0 0 0 1 0 0 0
NON REMARKABLE Control 25 25 25 25 25 25 25 25 25 25 25 242 mg/m3 25 25 25 25 25 25 25 25 25 25 25 258 mg/m3 25 25 25 25 25 25 25 25 25 24 24 24
32 mg/m3 25 25 25 25 24 24 24 24 23 23 23 23
________________________________________________________________________________________________________________________________________________________________________________________________
(HAN190) BAIS6
TABLE D1
BODY WEIGHT CHANGES AND
SURVIVAL ANIMAL NUMBERS : MALE
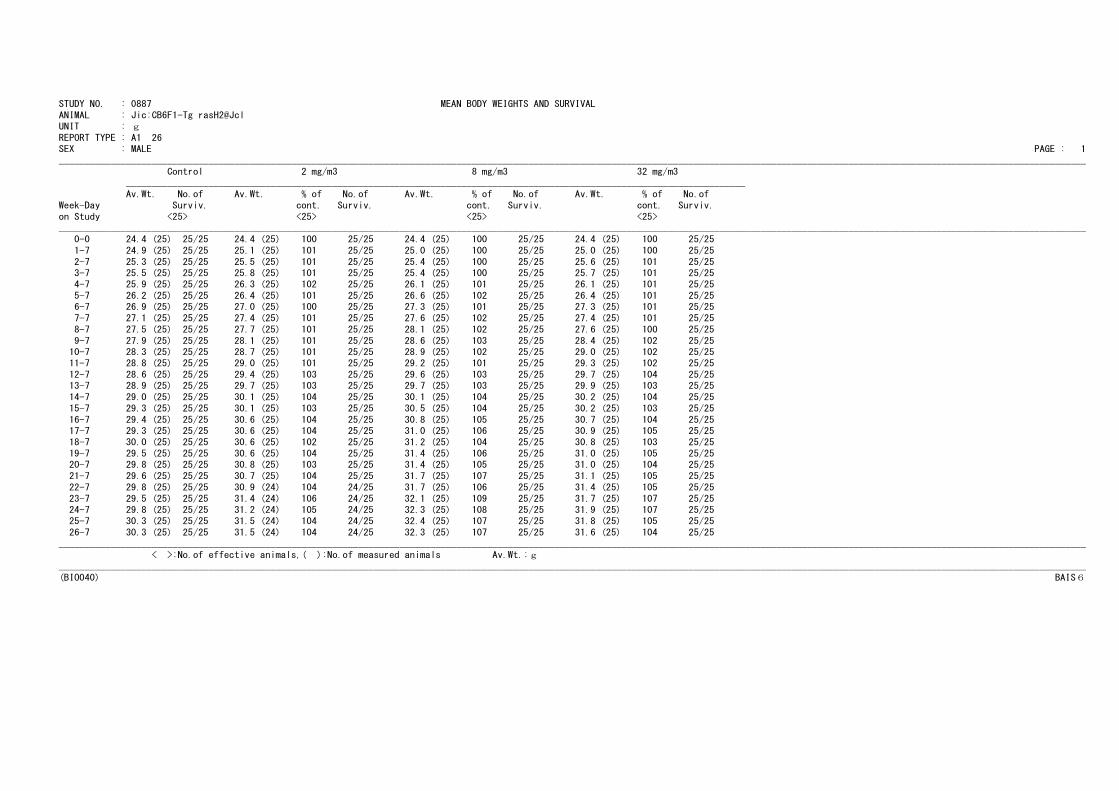
STUDY NO. : 0887 MEAN BODY WEIGHTS AND SURVIVAL
ANIMAL : Jic:CB6F1-Tg rasH2@JclUNIT : g
REPORT TYPE : A1 26SEX : MALE PAGE : 1
_______________________________________________________________________________________________________________________________________________________________________________________________________
Control 2 mg/m3 8 mg/m3 32 mg/m3
________________________________________________________________________________________________________________________Av.Wt. No.of Av.Wt. % of No.of Av.Wt. % of No.of Av.Wt. % of No.of
Week-Day Surviv. cont. Surviv. cont. Surviv. cont. Surviv.
on Study <25> <25> <25> <25>_______________________________________________________________________________________________________________________________________________________________________________________________________
0-0 24.4 (25) 25/25 24.4 (25) 100 25/25 24.4 (25) 100 25/25 24.4 (25) 100 25/25
1-7 24.9 (25) 25/25 25.1 (25) 101 25/25 25.0 (25) 100 25/25 25.0 (25) 100 25/25
2-7 25.3 (25) 25/25 25.5 (25) 101 25/25 25.4 (25) 100 25/25 25.6 (25) 101 25/253-7 25.5 (25) 25/25 25.8 (25) 101 25/25 25.4 (25) 100 25/25 25.7 (25) 101 25/254-7 25.9 (25) 25/25 26.3 (25) 102 25/25 26.1 (25) 101 25/25 26.1 (25) 101 25/25
5-7 26.2 (25) 25/25 26.4 (25) 101 25/25 26.6 (25) 102 25/25 26.4 (25) 101 25/256-7 26.9 (25) 25/25 27.0 (25) 100 25/25 27.3 (25) 101 25/25 27.3 (25) 101 25/25
7-7 27.1 (25) 25/25 27.4 (25) 101 25/25 27.6 (25) 102 25/25 27.4 (25) 101 25/25
8-7 27.5 (25) 25/25 27.7 (25) 101 25/25 28.1 (25) 102 25/25 27.6 (25) 100 25/25
9-7 27.9 (25) 25/25 28.1 (25) 101 25/25 28.6 (25) 103 25/25 28.4 (25) 102 25/2510-7 28.3 (25) 25/25 28.7 (25) 101 25/25 28.9 (25) 102 25/25 29.0 (25) 102 25/2511-7 28.8 (25) 25/25 29.0 (25) 101 25/25 29.2 (25) 101 25/25 29.3 (25) 102 25/25
12-7 28.6 (25) 25/25 29.4 (25) 103 25/25 29.6 (25) 103 25/25 29.7 (25) 104 25/2513-7 28.9 (25) 25/25 29.7 (25) 103 25/25 29.7 (25) 103 25/25 29.9 (25) 103 25/25
14-7 29.0 (25) 25/25 30.1 (25) 104 25/25 30.1 (25) 104 25/25 30.2 (25) 104 25/25
15-7 29.3 (25) 25/25 30.1 (25) 103 25/25 30.5 (25) 104 25/25 30.2 (25) 103 25/25
16-7 29.4 (25) 25/25 30.6 (25) 104 25/25 30.8 (25) 105 25/25 30.7 (25) 104 25/2517-7 29.3 (25) 25/25 30.6 (25) 104 25/25 31.0 (25) 106 25/25 30.9 (25) 105 25/2518-7 30.0 (25) 25/25 30.6 (25) 102 25/25 31.2 (25) 104 25/25 30.8 (25) 103 25/25
19-7 29.5 (25) 25/25 30.6 (25) 104 25/25 31.4 (25) 106 25/25 31.0 (25) 105 25/2520-7 29.8 (25) 25/25 30.8 (25) 103 25/25 31.4 (25) 105 25/25 31.0 (25) 104 25/25
21-7 29.6 (25) 25/25 30.7 (25) 104 25/25 31.7 (25) 107 25/25 31.1 (25) 105 25/25
22-7 29.8 (25) 25/25 30.9 (24) 104 24/25 31.7 (25) 106 25/25 31.4 (25) 105 25/25
23-7 29.5 (25) 25/25 31.4 (24) 106 24/25 32.1 (25) 109 25/25 31.7 (25) 107 25/2524-7 29.8 (25) 25/25 31.2 (24) 105 24/25 32.3 (25) 108 25/25 31.9 (25) 107 25/2525-7 30.3 (25) 25/25 31.5 (24) 104 24/25 32.4 (25) 107 25/25 31.8 (25) 105 25/25
26-7 30.3 (25) 25/25 31.5 (24) 104 24/25 32.3 (25) 107 25/25 31.6 (25) 104 25/25_______________________________________________________________________________________________________________________________________________________________________________________________________
< >:No.of effective animals,( ):No.of measured animals Av.Wt.:g
_______________________________________________________________________________________________________________________________________________________________________________________________________
(BIO040) BAIS6
TABLE D2
BODY WEIGHT CHANGES AND
SURVIVAL ANIMAL NUMBERS : FEMALE
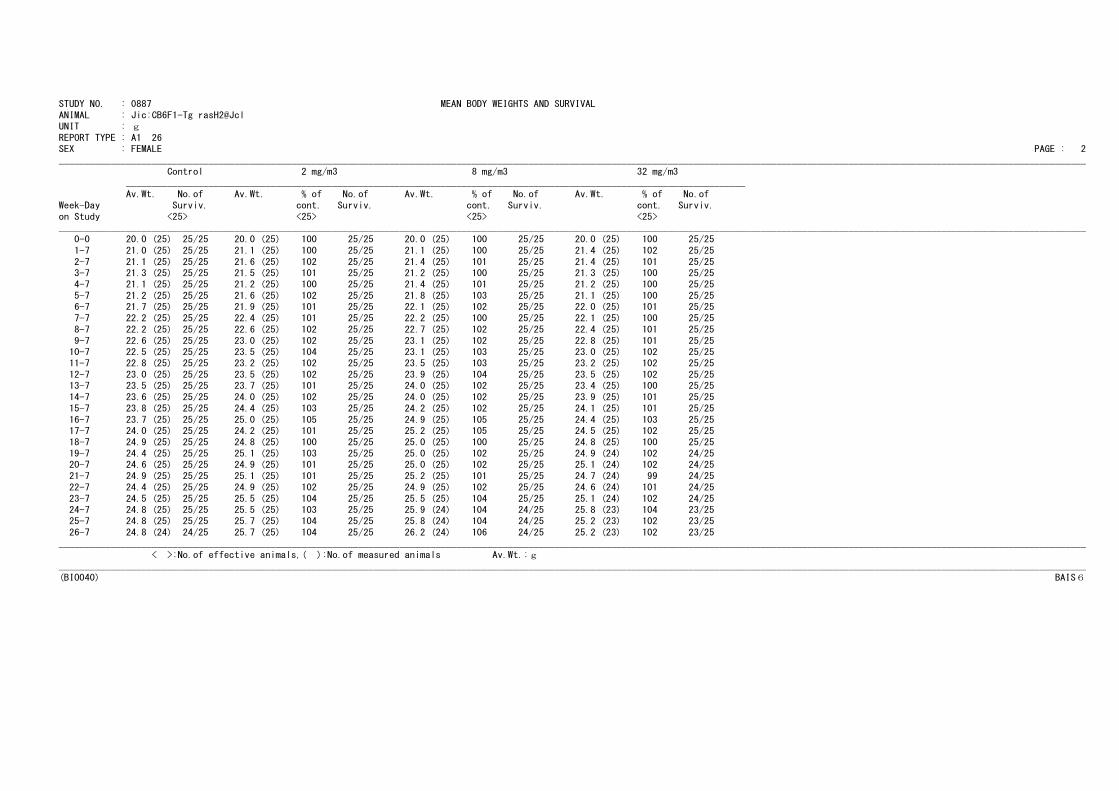
STUDY NO. : 0887 MEAN BODY WEIGHTS AND SURVIVAL
ANIMAL : Jic:CB6F1-Tg rasH2@JclUNIT : g
REPORT TYPE : A1 26SEX : FEMALE PAGE : 2
_______________________________________________________________________________________________________________________________________________________________________________________________________
Control 2 mg/m3 8 mg/m3 32 mg/m3
________________________________________________________________________________________________________________________Av.Wt. No.of Av.Wt. % of No.of Av.Wt. % of No.of Av.Wt. % of No.of
Week-Day Surviv. cont. Surviv. cont. Surviv. cont. Surviv.
on Study <25> <25> <25> <25>_______________________________________________________________________________________________________________________________________________________________________________________________________
0-0 20.0 (25) 25/25 20.0 (25) 100 25/25 20.0 (25) 100 25/25 20.0 (25) 100 25/25
1-7 21.0 (25) 25/25 21.1 (25) 100 25/25 21.1 (25) 100 25/25 21.4 (25) 102 25/25
2-7 21.1 (25) 25/25 21.6 (25) 102 25/25 21.4 (25) 101 25/25 21.4 (25) 101 25/253-7 21.3 (25) 25/25 21.5 (25) 101 25/25 21.2 (25) 100 25/25 21.3 (25) 100 25/254-7 21.1 (25) 25/25 21.2 (25) 100 25/25 21.4 (25) 101 25/25 21.2 (25) 100 25/25
5-7 21.2 (25) 25/25 21.6 (25) 102 25/25 21.8 (25) 103 25/25 21.1 (25) 100 25/256-7 21.7 (25) 25/25 21.9 (25) 101 25/25 22.1 (25) 102 25/25 22.0 (25) 101 25/25
7-7 22.2 (25) 25/25 22.4 (25) 101 25/25 22.2 (25) 100 25/25 22.1 (25) 100 25/25
8-7 22.2 (25) 25/25 22.6 (25) 102 25/25 22.7 (25) 102 25/25 22.4 (25) 101 25/25
9-7 22.6 (25) 25/25 23.0 (25) 102 25/25 23.1 (25) 102 25/25 22.8 (25) 101 25/2510-7 22.5 (25) 25/25 23.5 (25) 104 25/25 23.1 (25) 103 25/25 23.0 (25) 102 25/2511-7 22.8 (25) 25/25 23.2 (25) 102 25/25 23.5 (25) 103 25/25 23.2 (25) 102 25/25
12-7 23.0 (25) 25/25 23.5 (25) 102 25/25 23.9 (25) 104 25/25 23.5 (25) 102 25/2513-7 23.5 (25) 25/25 23.7 (25) 101 25/25 24.0 (25) 102 25/25 23.4 (25) 100 25/25
14-7 23.6 (25) 25/25 24.0 (25) 102 25/25 24.0 (25) 102 25/25 23.9 (25) 101 25/25
15-7 23.8 (25) 25/25 24.4 (25) 103 25/25 24.2 (25) 102 25/25 24.1 (25) 101 25/25
16-7 23.7 (25) 25/25 25.0 (25) 105 25/25 24.9 (25) 105 25/25 24.4 (25) 103 25/2517-7 24.0 (25) 25/25 24.2 (25) 101 25/25 25.2 (25) 105 25/25 24.5 (25) 102 25/2518-7 24.9 (25) 25/25 24.8 (25) 100 25/25 25.0 (25) 100 25/25 24.8 (25) 100 25/25
19-7 24.4 (25) 25/25 25.1 (25) 103 25/25 25.0 (25) 102 25/25 24.9 (24) 102 24/2520-7 24.6 (25) 25/25 24.9 (25) 101 25/25 25.0 (25) 102 25/25 25.1 (24) 102 24/25
21-7 24.9 (25) 25/25 25.1 (25) 101 25/25 25.2 (25) 101 25/25 24.7 (24) 99 24/25
22-7 24.4 (25) 25/25 24.9 (25) 102 25/25 24.9 (25) 102 25/25 24.6 (24) 101 24/25
23-7 24.5 (25) 25/25 25.5 (25) 104 25/25 25.5 (25) 104 25/25 25.1 (24) 102 24/2524-7 24.8 (25) 25/25 25.5 (25) 103 25/25 25.9 (24) 104 24/25 25.8 (23) 104 23/2525-7 24.8 (25) 25/25 25.7 (25) 104 25/25 25.8 (24) 104 24/25 25.2 (23) 102 23/25
26-7 24.8 (24) 24/25 25.7 (25) 104 25/25 26.2 (24) 106 24/25 25.2 (23) 102 23/25_______________________________________________________________________________________________________________________________________________________________________________________________________
< >:No.of effective animals,( ):No.of measured animals Av.Wt.:g
_______________________________________________________________________________________________________________________________________________________________________________________________________
(BIO040) BAIS6
TABLE D3
BODY WEIGHT CHANGES : MALE
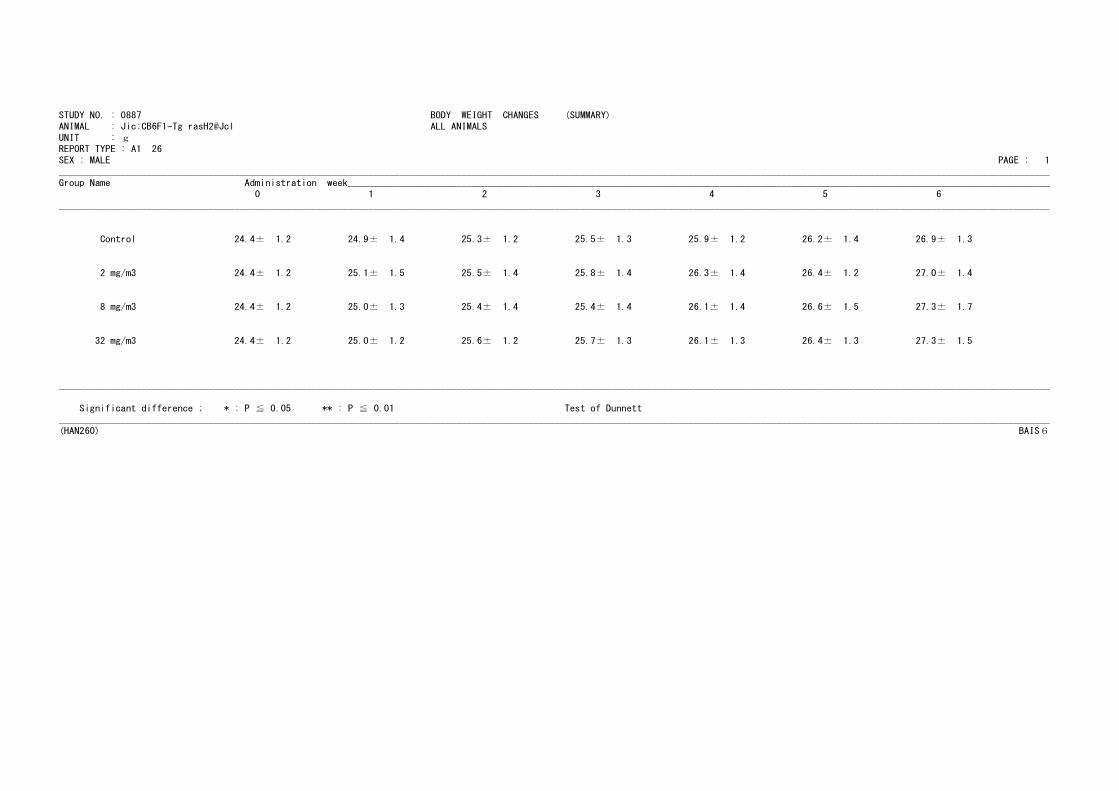
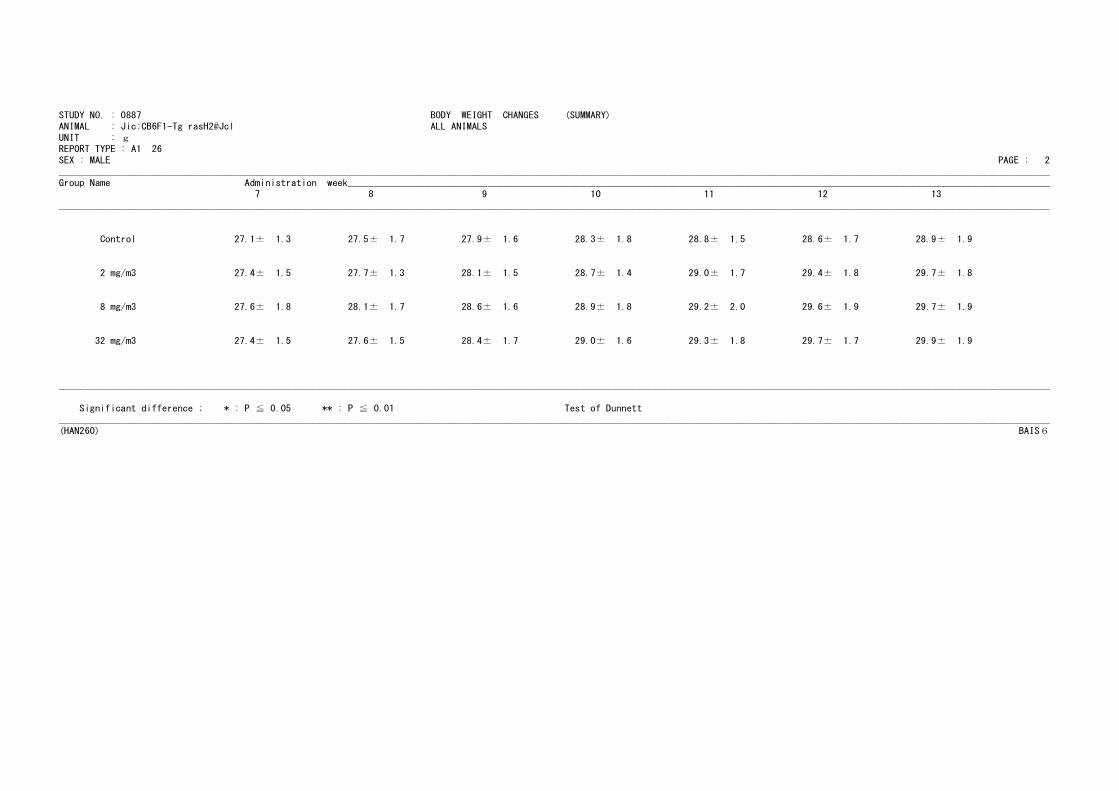
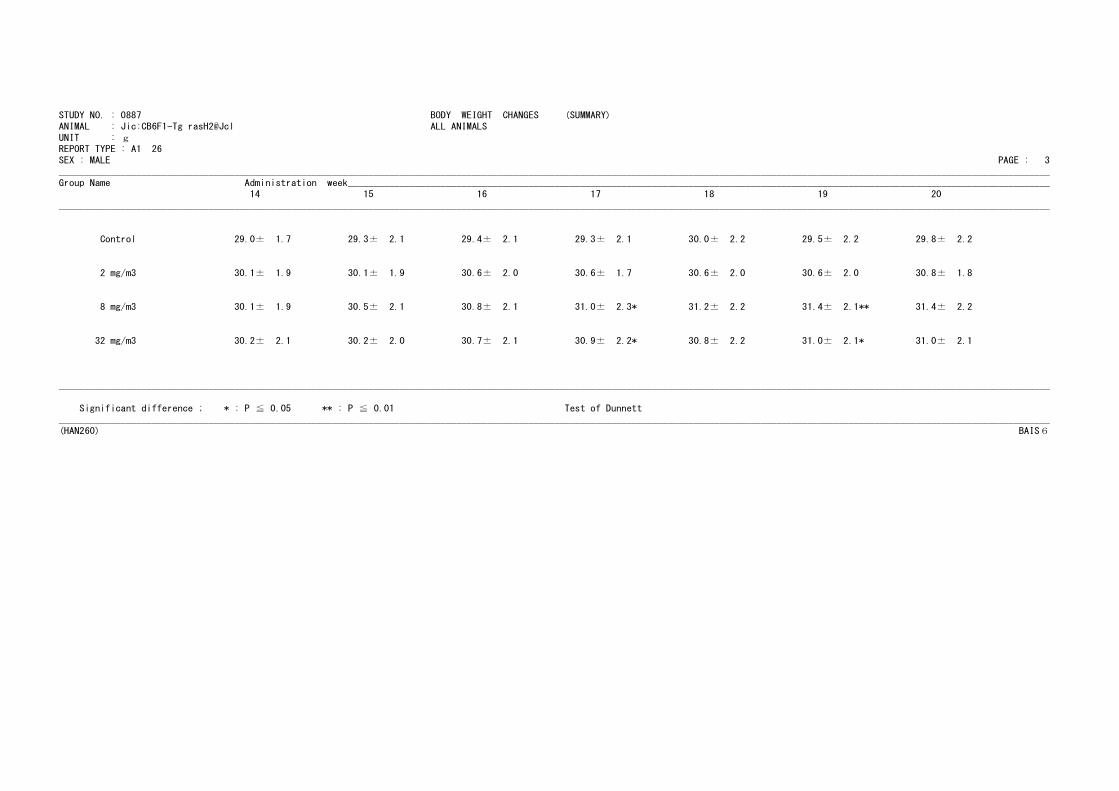
STUDY NO. : 0887 BODY WEIGHT CHANGES (SUMMARY)ANIMAL : Jic:CB6F1-Tg rasH2@Jcl ALL ANIMALS
UNIT : gREPORT TYPE : A1 26
SEX : MALE PAGE : 1
________________________________________________________________________________________________________________________________________________________________________________________________
Group Name Administration week________________________________________________________________________________________________________________________________________0 1 2 3 4 5 6
________________________________________________________________________________________________________________________________________________________________________________________________
Control 24.4± 1.2 24.9± 1.4 25.3± 1.2 25.5± 1.3 25.9± 1.2 26.2± 1.4 26.9± 1.3
2 mg/m3 24.4± 1.2 25.1± 1.5 25.5± 1.4 25.8± 1.4 26.3± 1.4 26.4± 1.2 27.0± 1.4
8 mg/m3 24.4± 1.2 25.0± 1.3 25.4± 1.4 25.4± 1.4 26.1± 1.4 26.6± 1.5 27.3± 1.7
32 mg/m3 24.4± 1.2 25.0± 1.2 25.6± 1.2 25.7± 1.3 26.1± 1.3 26.4± 1.3 27.3± 1.5
________________________________________________________________________________________________________________________________________________________________________________________________
Significant difference ; * : P ≦ 0.05 ** : P ≦ 0.01 Test of Dunnett
________________________________________________________________________________________________________________________________________________________________________________________________(HAN260) BAIS6
STUDY NO. : 0887 BODY WEIGHT CHANGES (SUMMARY)ANIMAL : Jic:CB6F1-Tg rasH2@Jcl ALL ANIMALS
UNIT : gREPORT TYPE : A1 26
SEX : MALE PAGE : 2
________________________________________________________________________________________________________________________________________________________________________________________________
Group Name Administration week________________________________________________________________________________________________________________________________________7 8 9 10 11 12 13
________________________________________________________________________________________________________________________________________________________________________________________________
Control 27.1± 1.3 27.5± 1.7 27.9± 1.6 28.3± 1.8 28.8± 1.5 28.6± 1.7 28.9± 1.9
2 mg/m3 27.4± 1.5 27.7± 1.3 28.1± 1.5 28.7± 1.4 29.0± 1.7 29.4± 1.8 29.7± 1.8
8 mg/m3 27.6± 1.8 28.1± 1.7 28.6± 1.6 28.9± 1.8 29.2± 2.0 29.6± 1.9 29.7± 1.9
32 mg/m3 27.4± 1.5 27.6± 1.5 28.4± 1.7 29.0± 1.6 29.3± 1.8 29.7± 1.7 29.9± 1.9
________________________________________________________________________________________________________________________________________________________________________________________________
Significant difference ; * : P ≦ 0.05 ** : P ≦ 0.01 Test of Dunnett
________________________________________________________________________________________________________________________________________________________________________________________________(HAN260) BAIS6
STUDY NO. : 0887 BODY WEIGHT CHANGES (SUMMARY)ANIMAL : Jic:CB6F1-Tg rasH2@Jcl ALL ANIMALS
UNIT : gREPORT TYPE : A1 26
SEX : MALE PAGE : 3
________________________________________________________________________________________________________________________________________________________________________________________________
Group Name Administration week________________________________________________________________________________________________________________________________________14 15 16 17 18 19 20
________________________________________________________________________________________________________________________________________________________________________________________________
Control 29.0± 1.7 29.3± 2.1 29.4± 2.1 29.3± 2.1 30.0± 2.2 29.5± 2.2 29.8± 2.2
2 mg/m3 30.1± 1.9 30.1± 1.9 30.6± 2.0 30.6± 1.7 30.6± 2.0 30.6± 2.0 30.8± 1.8
8 mg/m3 30.1± 1.9 30.5± 2.1 30.8± 2.1 31.0± 2.3* 31.2± 2.2 31.4± 2.1** 31.4± 2.2
32 mg/m3 30.2± 2.1 30.2± 2.0 30.7± 2.1 30.9± 2.2* 30.8± 2.2 31.0± 2.1* 31.0± 2.1
________________________________________________________________________________________________________________________________________________________________________________________________
Significant difference ; * : P ≦ 0.05 ** : P ≦ 0.01 Test of Dunnett
________________________________________________________________________________________________________________________________________________________________________________________________(HAN260) BAIS6
STUDY NO. : 0887 BODY WEIGHT CHANGES (SUMMARY)ANIMAL : Jic:CB6F1-Tg rasH2@Jcl ALL ANIMALS
UNIT : gREPORT TYPE : A1 26
SEX : MALE PAGE : 4
________________________________________________________________________________________________________________________________________________________________________________________________
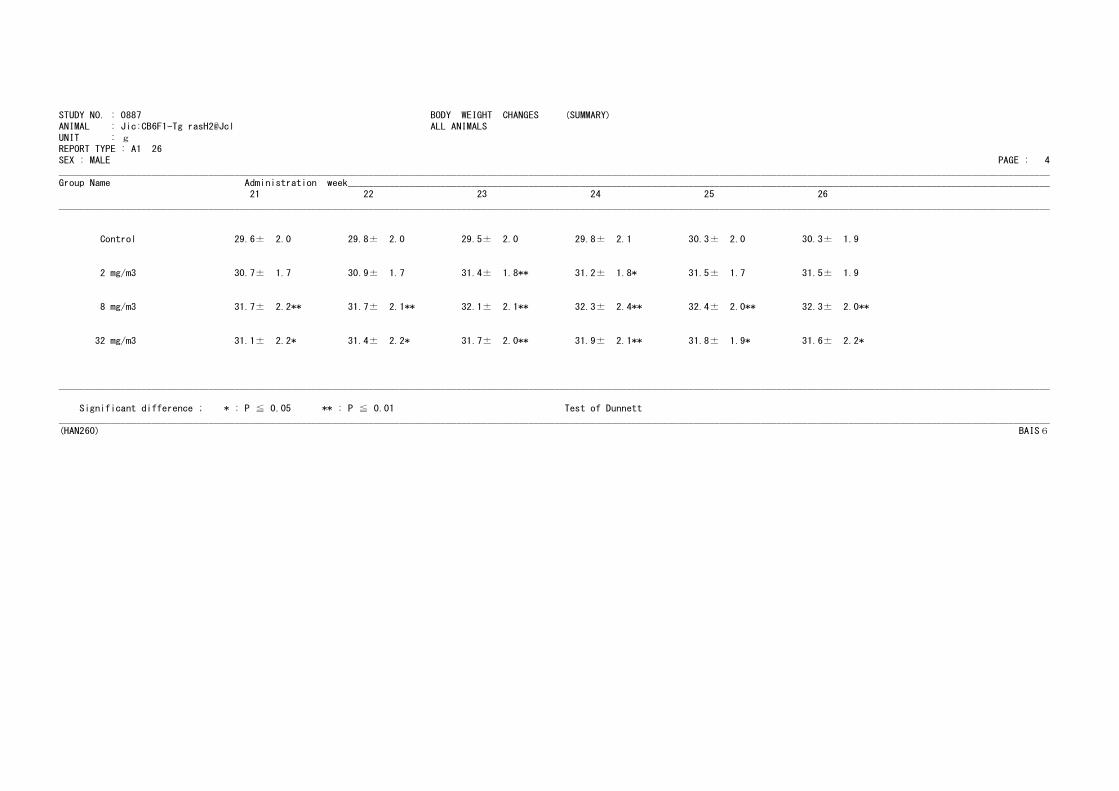
Group Name Administration week________________________________________________________________________________________________________________________________________21 22 23 24 25 26
________________________________________________________________________________________________________________________________________________________________________________________________
Control 29.6± 2.0 29.8± 2.0 29.5± 2.0 29.8± 2.1 30.3± 2.0 30.3± 1.9
2 mg/m3 30.7± 1.7 30.9± 1.7 31.4± 1.8** 31.2± 1.8* 31.5± 1.7 31.5± 1.9
8 mg/m3 31.7± 2.2** 31.7± 2.1** 32.1± 2.1** 32.3± 2.4** 32.4± 2.0** 32.3± 2.0**
32 mg/m3 31.1± 2.2* 31.4± 2.2* 31.7± 2.0** 31.9± 2.1** 31.8± 1.9* 31.6± 2.2*
________________________________________________________________________________________________________________________________________________________________________________________________
Significant difference ; * : P ≦ 0.05 ** : P ≦ 0.01 Test of Dunnett
________________________________________________________________________________________________________________________________________________________________________________________________(HAN260) BAIS6
TABLE D4
BODY WEIGHT CHANGES : FEMALE
STUDY NO. : 0887 BODY WEIGHT CHANGES (SUMMARY)ANIMAL : Jic:CB6F1-Tg rasH2@Jcl ALL ANIMALS
UNIT : gREPORT TYPE : A1 26
SEX : FEMALE PAGE : 5
________________________________________________________________________________________________________________________________________________________________________________________________
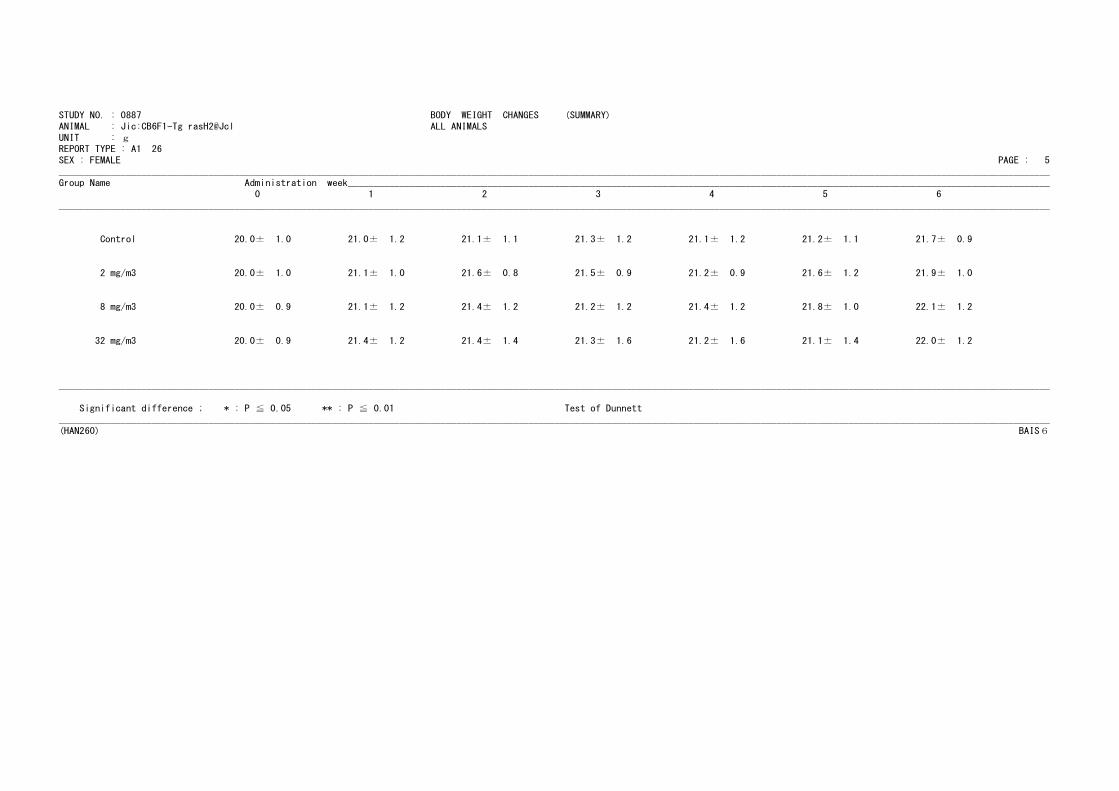
Group Name Administration week________________________________________________________________________________________________________________________________________0 1 2 3 4 5 6
________________________________________________________________________________________________________________________________________________________________________________________________
Control 20.0± 1.0 21.0± 1.2 21.1± 1.1 21.3± 1.2 21.1± 1.2 21.2± 1.1 21.7± 0.9
2 mg/m3 20.0± 1.0 21.1± 1.0 21.6± 0.8 21.5± 0.9 21.2± 0.9 21.6± 1.2 21.9± 1.0
8 mg/m3 20.0± 0.9 21.1± 1.2 21.4± 1.2 21.2± 1.2 21.4± 1.2 21.8± 1.0 22.1± 1.2
32 mg/m3 20.0± 0.9 21.4± 1.2 21.4± 1.4 21.3± 1.6 21.2± 1.6 21.1± 1.4 22.0± 1.2
________________________________________________________________________________________________________________________________________________________________________________________________
Significant difference ; * : P ≦ 0.05 ** : P ≦ 0.01 Test of Dunnett
________________________________________________________________________________________________________________________________________________________________________________________________(HAN260) BAIS6
STUDY NO. : 0887 BODY WEIGHT CHANGES (SUMMARY)ANIMAL : Jic:CB6F1-Tg rasH2@Jcl ALL ANIMALS
UNIT : gREPORT TYPE : A1 26
SEX : FEMALE PAGE : 6
________________________________________________________________________________________________________________________________________________________________________________________________
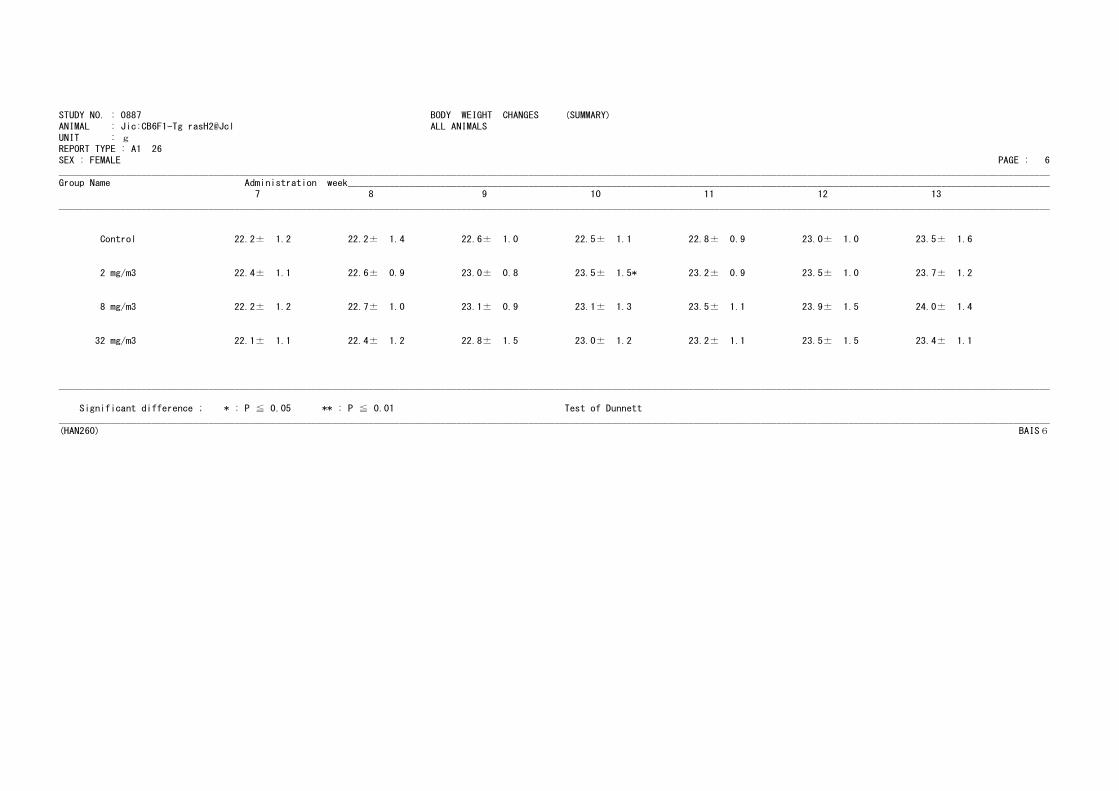
Group Name Administration week________________________________________________________________________________________________________________________________________7 8 9 10 11 12 13
________________________________________________________________________________________________________________________________________________________________________________________________
Control 22.2± 1.2 22.2± 1.4 22.6± 1.0 22.5± 1.1 22.8± 0.9 23.0± 1.0 23.5± 1.6
2 mg/m3 22.4± 1.1 22.6± 0.9 23.0± 0.8 23.5± 1.5* 23.2± 0.9 23.5± 1.0 23.7± 1.2
8 mg/m3 22.2± 1.2 22.7± 1.0 23.1± 0.9 23.1± 1.3 23.5± 1.1 23.9± 1.5 24.0± 1.4
32 mg/m3 22.1± 1.1 22.4± 1.2 22.8± 1.5 23.0± 1.2 23.2± 1.1 23.5± 1.5 23.4± 1.1
________________________________________________________________________________________________________________________________________________________________________________________________
Significant difference ; * : P ≦ 0.05 ** : P ≦ 0.01 Test of Dunnett
________________________________________________________________________________________________________________________________________________________________________________________________(HAN260) BAIS6
STUDY NO. : 0887 BODY WEIGHT CHANGES (SUMMARY)ANIMAL : Jic:CB6F1-Tg rasH2@Jcl ALL ANIMALS
UNIT : gREPORT TYPE : A1 26
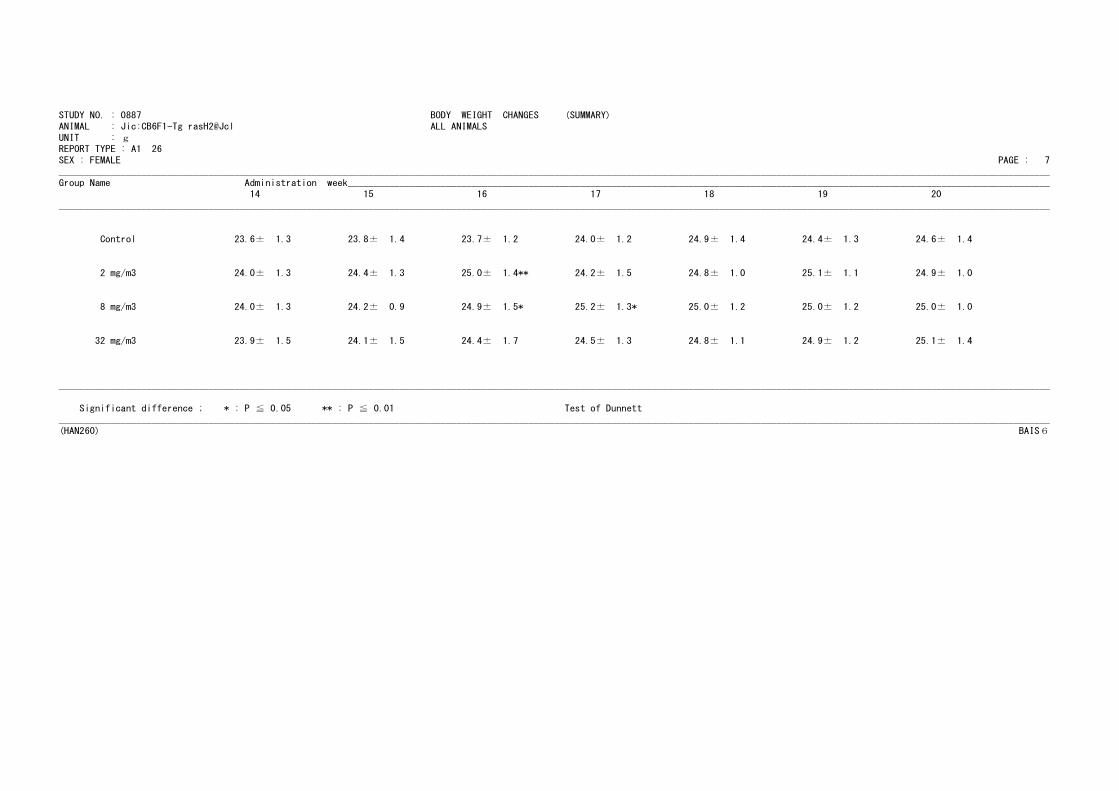
SEX : FEMALE PAGE : 7
________________________________________________________________________________________________________________________________________________________________________________________________
Group Name Administration week________________________________________________________________________________________________________________________________________14 15 16 17 18 19 20
________________________________________________________________________________________________________________________________________________________________________________________________
Control 23.6± 1.3 23.8± 1.4 23.7± 1.2 24.0± 1.2 24.9± 1.4 24.4± 1.3 24.6± 1.4
2 mg/m3 24.0± 1.3 24.4± 1.3 25.0± 1.4** 24.2± 1.5 24.8± 1.0 25.1± 1.1 24.9± 1.0
8 mg/m3 24.0± 1.3 24.2± 0.9 24.9± 1.5* 25.2± 1.3* 25.0± 1.2 25.0± 1.2 25.0± 1.0
32 mg/m3 23.9± 1.5 24.1± 1.5 24.4± 1.7 24.5± 1.3 24.8± 1.1 24.9± 1.2 25.1± 1.4
________________________________________________________________________________________________________________________________________________________________________________________________
Significant difference ; * : P ≦ 0.05 ** : P ≦ 0.01 Test of Dunnett
________________________________________________________________________________________________________________________________________________________________________________________________(HAN260) BAIS6
STUDY NO. : 0887 BODY WEIGHT CHANGES (SUMMARY)ANIMAL : Jic:CB6F1-Tg rasH2@Jcl ALL ANIMALS
UNIT : gREPORT TYPE : A1 26
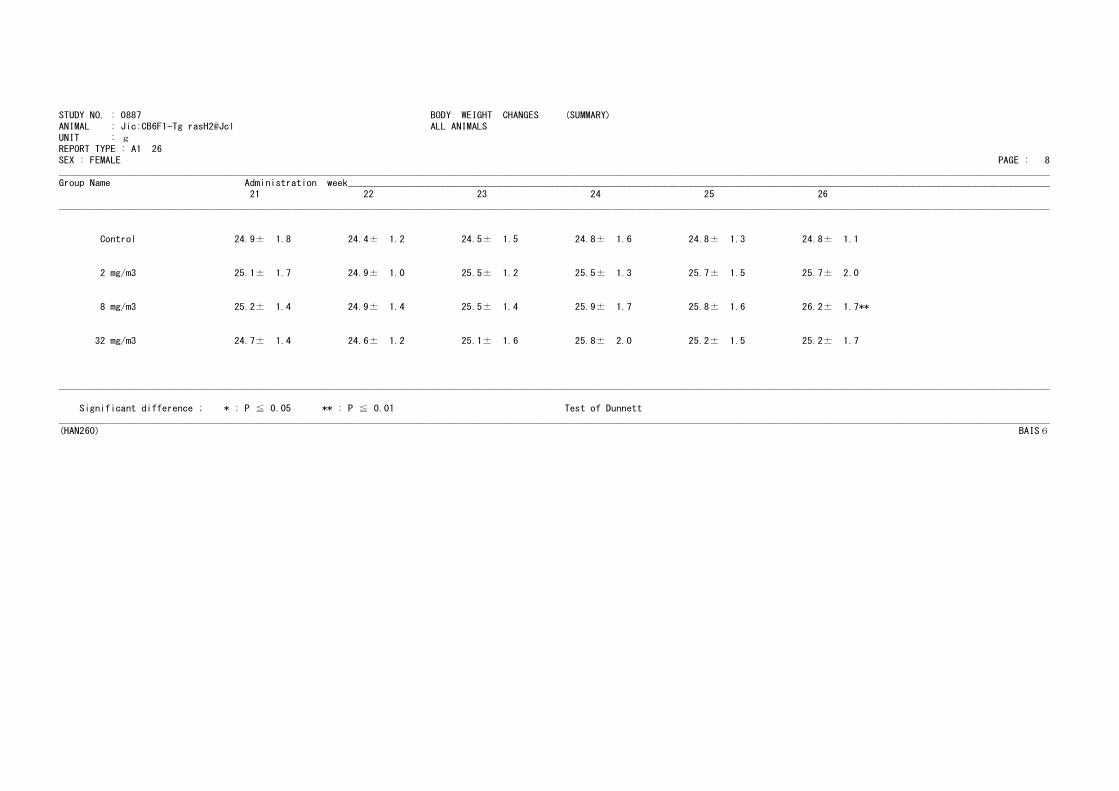
SEX : FEMALE PAGE : 8
________________________________________________________________________________________________________________________________________________________________________________________________
Group Name Administration week________________________________________________________________________________________________________________________________________21 22 23 24 25 26
________________________________________________________________________________________________________________________________________________________________________________________________
Control 24.9± 1.8 24.4± 1.2 24.5± 1.5 24.8± 1.6 24.8± 1.3 24.8± 1.1
2 mg/m3 25.1± 1.7 24.9± 1.0 25.5± 1.2 25.5± 1.3 25.7± 1.5 25.7± 2.0
8 mg/m3 25.2± 1.4 24.9± 1.4 25.5± 1.4 25.9± 1.7 25.8± 1.6 26.2± 1.7**
32 mg/m3 24.7± 1.4 24.6± 1.2 25.1± 1.6 25.8± 2.0 25.2± 1.5 25.2± 1.7
________________________________________________________________________________________________________________________________________________________________________________________________
Significant difference ; * : P ≦ 0.05 ** : P ≦ 0.01 Test of Dunnett
________________________________________________________________________________________________________________________________________________________________________________________________(HAN260) BAIS6
TABLE E1
FOOD CONSUMPTION CHANGES AND
SURVIVAL ANIMAL NUMBERS : MALE
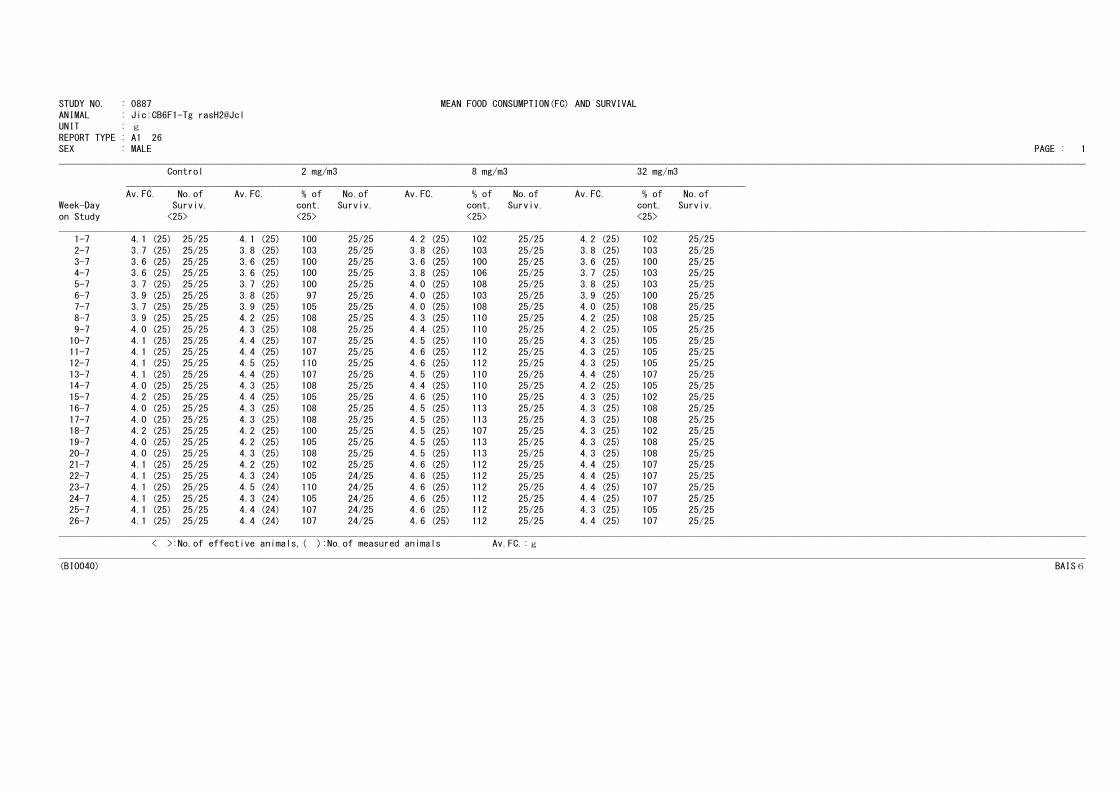
STUDY NO. : 0887 MEAN FOOD CONSUMPTION(FC) AND SURVIVAL
ANIMAL : Jic:CB6F1-Tg rasH2@JclUNIT : g
REPORT TYPE : A1 26SEX : MALE PAGE : 1
_______________________________________________________________________________________________________________________________________________________________________________________________________
Control 2 mg/m3 8 mg/m3 32 mg/m3
________________________________________________________________________________________________________________________Av.FC. No.of Av.FC. % of No.of Av.FC. % of No.of Av.FC. % of No.of
Week-Day Surviv. cont. Surviv. cont. Surviv. cont. Surviv.
on Study <25> <25> <25> <25>_______________________________________________________________________________________________________________________________________________________________________________________________________
1-7 4.1 (25) 25/25 4.1 (25) 100 25/25 4.2 (25) 102 25/25 4.2 (25) 102 25/25
2-7 3.7 (25) 25/25 3.8 (25) 103 25/25 3.8 (25) 103 25/25 3.8 (25) 103 25/25
3-7 3.6 (25) 25/25 3.6 (25) 100 25/25 3.6 (25) 100 25/25 3.6 (25) 100 25/254-7 3.6 (25) 25/25 3.6 (25) 100 25/25 3.8 (25) 106 25/25 3.7 (25) 103 25/255-7 3.7 (25) 25/25 3.7 (25) 100 25/25 4.0 (25) 108 25/25 3.8 (25) 103 25/25
6-7 3.9 (25) 25/25 3.8 (25) 97 25/25 4.0 (25) 103 25/25 3.9 (25) 100 25/257-7 3.7 (25) 25/25 3.9 (25) 105 25/25 4.0 (25) 108 25/25 4.0 (25) 108 25/25
8-7 3.9 (25) 25/25 4.2 (25) 108 25/25 4.3 (25) 110 25/25 4.2 (25) 108 25/25
9-7 4.0 (25) 25/25 4.3 (25) 108 25/25 4.4 (25) 110 25/25 4.2 (25) 105 25/25
10-7 4.1 (25) 25/25 4.4 (25) 107 25/25 4.5 (25) 110 25/25 4.3 (25) 105 25/2511-7 4.1 (25) 25/25 4.4 (25) 107 25/25 4.6 (25) 112 25/25 4.3 (25) 105 25/2512-7 4.1 (25) 25/25 4.5 (25) 110 25/25 4.6 (25) 112 25/25 4.3 (25) 105 25/25
13-7 4.1 (25) 25/25 4.4 (25) 107 25/25 4.5 (25) 110 25/25 4.4 (25) 107 25/2514-7 4.0 (25) 25/25 4.3 (25) 108 25/25 4.4 (25) 110 25/25 4.2 (25) 105 25/25
15-7 4.2 (25) 25/25 4.4 (25) 105 25/25 4.6 (25) 110 25/25 4.3 (25) 102 25/25
16-7 4.0 (25) 25/25 4.3 (25) 108 25/25 4.5 (25) 113 25/25 4.3 (25) 108 25/25
17-7 4.0 (25) 25/25 4.3 (25) 108 25/25 4.5 (25) 113 25/25 4.3 (25) 108 25/2518-7 4.2 (25) 25/25 4.2 (25) 100 25/25 4.5 (25) 107 25/25 4.3 (25) 102 25/2519-7 4.0 (25) 25/25 4.2 (25) 105 25/25 4.5 (25) 113 25/25 4.3 (25) 108 25/25
20-7 4.0 (25) 25/25 4.3 (25) 108 25/25 4.5 (25) 113 25/25 4.3 (25) 108 25/2521-7 4.1 (25) 25/25 4.2 (25) 102 25/25 4.6 (25) 112 25/25 4.4 (25) 107 25/25
22-7 4.1 (25) 25/25 4.3 (24) 105 24/25 4.6 (25) 112 25/25 4.4 (25) 107 25/25
23-7 4.1 (25) 25/25 4.5 (24) 110 24/25 4.6 (25) 112 25/25 4.4 (25) 107 25/25
24-7 4.1 (25) 25/25 4.3 (24) 105 24/25 4.6 (25) 112 25/25 4.4 (25) 107 25/2525-7 4.1 (25) 25/25 4.4 (24) 107 24/25 4.6 (25) 112 25/25 4.3 (25) 105 25/2526-7 4.1 (25) 25/25 4.4 (24) 107 24/25 4.6 (25) 112 25/25 4.4 (25) 107 25/25
_______________________________________________________________________________________________________________________________________________________________________________________________________< >:No.of effective animals,( ):No.of measured animals Av.FC.:g
_______________________________________________________________________________________________________________________________________________________________________________________________________
(BIO040) BAIS6
TABLE E2
FOOD CONSUMPTION CHANGES AND
SURVIVAL ANIMAL NUMBERS : FEMALE
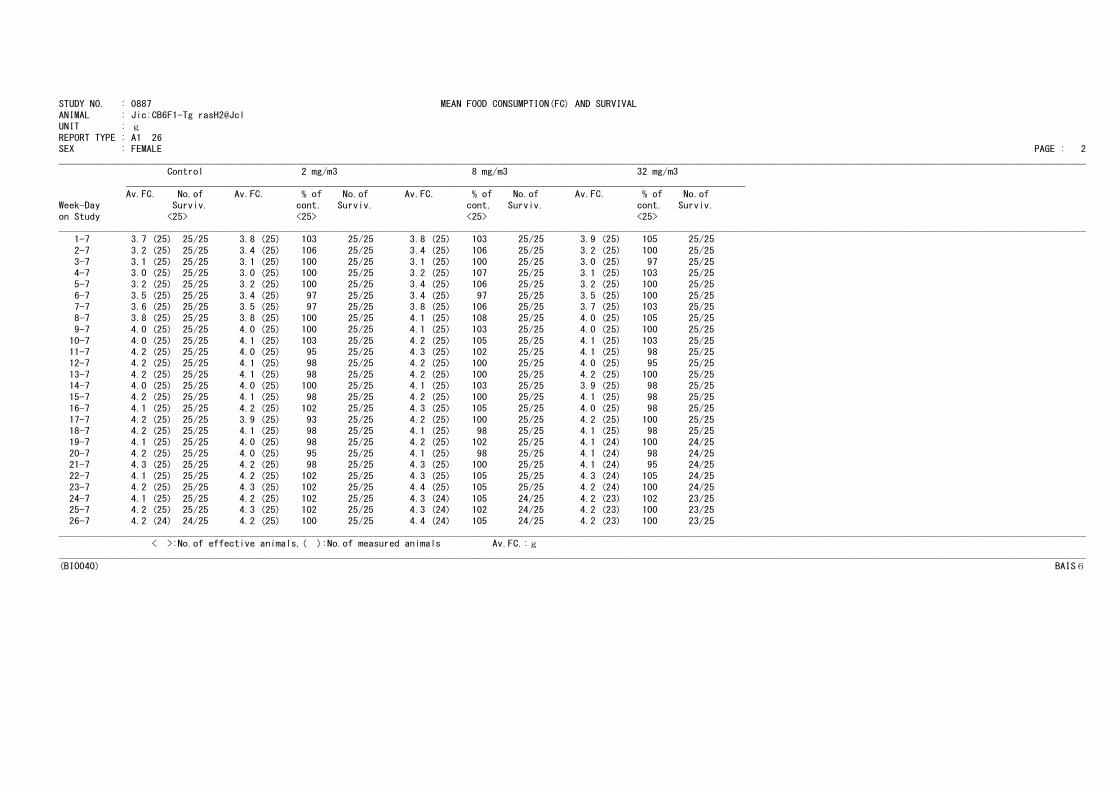
STUDY NO. : 0887 MEAN FOOD CONSUMPTION(FC) AND SURVIVAL
ANIMAL : Jic:CB6F1-Tg rasH2@JclUNIT : g
REPORT TYPE : A1 26SEX : FEMALE PAGE : 2
_______________________________________________________________________________________________________________________________________________________________________________________________________
Control 2 mg/m3 8 mg/m3 32 mg/m3
________________________________________________________________________________________________________________________Av.FC. No.of Av.FC. % of No.of Av.FC. % of No.of Av.FC. % of No.of
Week-Day Surviv. cont. Surviv. cont. Surviv. cont. Surviv.
on Study <25> <25> <25> <25>_______________________________________________________________________________________________________________________________________________________________________________________________________
1-7 3.7 (25) 25/25 3.8 (25) 103 25/25 3.8 (25) 103 25/25 3.9 (25) 105 25/25
2-7 3.2 (25) 25/25 3.4 (25) 106 25/25 3.4 (25) 106 25/25 3.2 (25) 100 25/25
3-7 3.1 (25) 25/25 3.1 (25) 100 25/25 3.1 (25) 100 25/25 3.0 (25) 97 25/254-7 3.0 (25) 25/25 3.0 (25) 100 25/25 3.2 (25) 107 25/25 3.1 (25) 103 25/255-7 3.2 (25) 25/25 3.2 (25) 100 25/25 3.4 (25) 106 25/25 3.2 (25) 100 25/25
6-7 3.5 (25) 25/25 3.4 (25) 97 25/25 3.4 (25) 97 25/25 3.5 (25) 100 25/257-7 3.6 (25) 25/25 3.5 (25) 97 25/25 3.8 (25) 106 25/25 3.7 (25) 103 25/25
8-7 3.8 (25) 25/25 3.8 (25) 100 25/25 4.1 (25) 108 25/25 4.0 (25) 105 25/25
9-7 4.0 (25) 25/25 4.0 (25) 100 25/25 4.1 (25) 103 25/25 4.0 (25) 100 25/25
10-7 4.0 (25) 25/25 4.1 (25) 103 25/25 4.2 (25) 105 25/25 4.1 (25) 103 25/2511-7 4.2 (25) 25/25 4.0 (25) 95 25/25 4.3 (25) 102 25/25 4.1 (25) 98 25/2512-7 4.2 (25) 25/25 4.1 (25) 98 25/25 4.2 (25) 100 25/25 4.0 (25) 95 25/25
13-7 4.2 (25) 25/25 4.1 (25) 98 25/25 4.2 (25) 100 25/25 4.2 (25) 100 25/2514-7 4.0 (25) 25/25 4.0 (25) 100 25/25 4.1 (25) 103 25/25 3.9 (25) 98 25/25
15-7 4.2 (25) 25/25 4.1 (25) 98 25/25 4.2 (25) 100 25/25 4.1 (25) 98 25/25
16-7 4.1 (25) 25/25 4.2 (25) 102 25/25 4.3 (25) 105 25/25 4.0 (25) 98 25/25
17-7 4.2 (25) 25/25 3.9 (25) 93 25/25 4.2 (25) 100 25/25 4.2 (25) 100 25/2518-7 4.2 (25) 25/25 4.1 (25) 98 25/25 4.1 (25) 98 25/25 4.1 (25) 98 25/2519-7 4.1 (25) 25/25 4.0 (25) 98 25/25 4.2 (25) 102 25/25 4.1 (24) 100 24/25
20-7 4.2 (25) 25/25 4.0 (25) 95 25/25 4.1 (25) 98 25/25 4.1 (24) 98 24/2521-7 4.3 (25) 25/25 4.2 (25) 98 25/25 4.3 (25) 100 25/25 4.1 (24) 95 24/25
22-7 4.1 (25) 25/25 4.2 (25) 102 25/25 4.3 (25) 105 25/25 4.3 (24) 105 24/25
23-7 4.2 (25) 25/25 4.3 (25) 102 25/25 4.4 (25) 105 25/25 4.2 (24) 100 24/25
24-7 4.1 (25) 25/25 4.2 (25) 102 25/25 4.3 (24) 105 24/25 4.2 (23) 102 23/2525-7 4.2 (25) 25/25 4.3 (25) 102 25/25 4.3 (24) 102 24/25 4.2 (23) 100 23/2526-7 4.2 (24) 24/25 4.2 (25) 100 25/25 4.4 (24) 105 24/25 4.2 (23) 100 23/25
_______________________________________________________________________________________________________________________________________________________________________________________________________< >:No.of effective animals,( ):No.of measured animals Av.FC.:g
_______________________________________________________________________________________________________________________________________________________________________________________________________
(BIO040) BAIS6
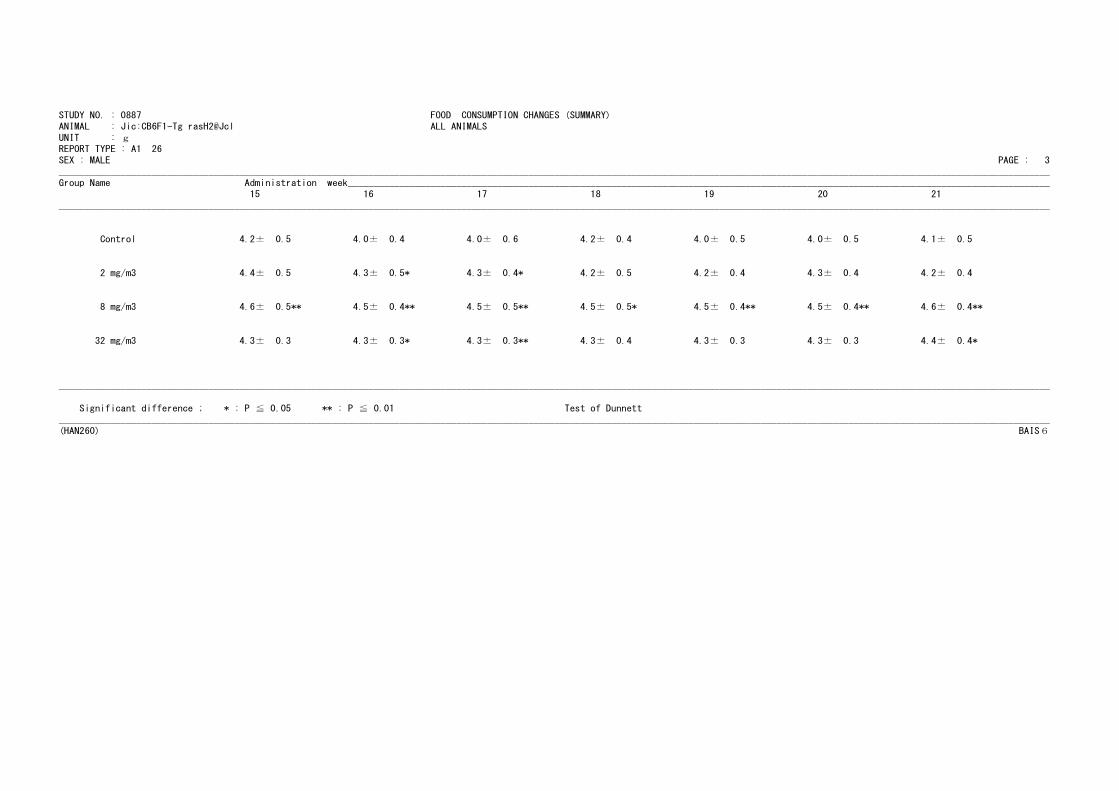
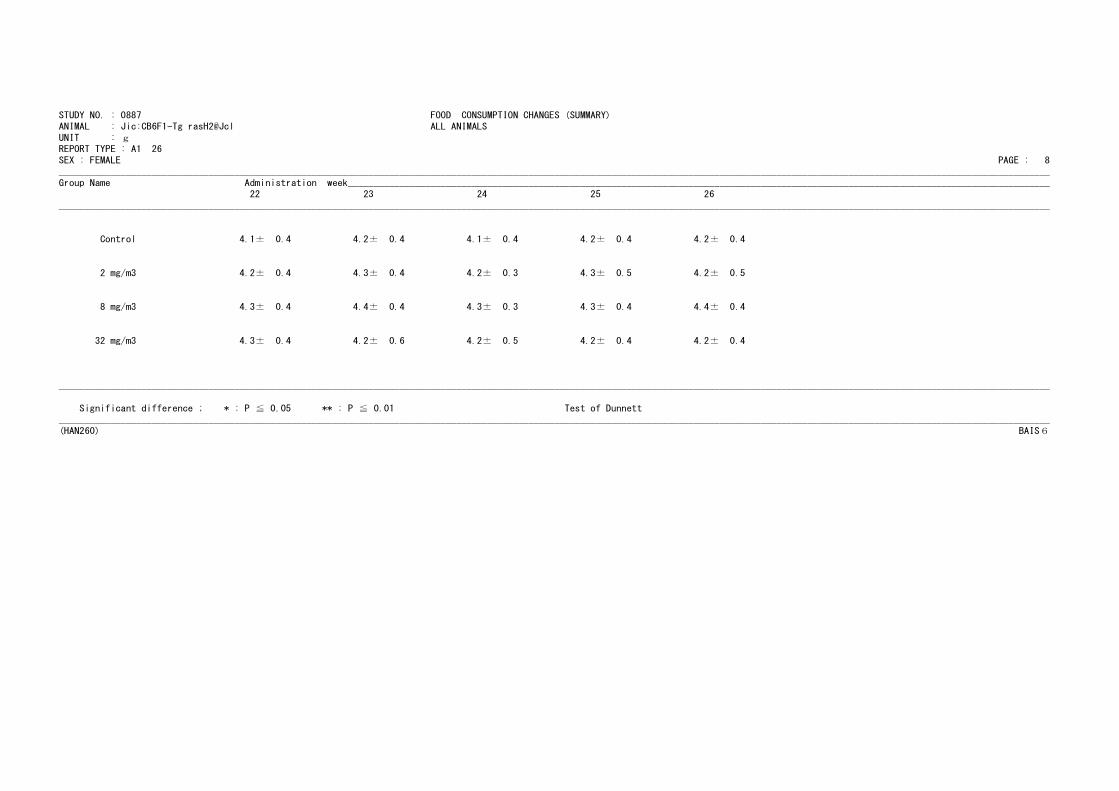
TABLE E3
FOOD CONSUMPTION CHANGES : MALE

STUDY NO. : 0887 FOOD CONSUMPTION CHANGES (SUMMARY)ANIMAL : Jic:CB6F1-Tg rasH2@Jcl ALL ANIMALS
UNIT : gREPORT TYPE : A1 26
SEX : MALE PAGE : 1
________________________________________________________________________________________________________________________________________________________________________________________________
Group Name Administration week________________________________________________________________________________________________________________________________________1 2 3 4 5 6 7
________________________________________________________________________________________________________________________________________________________________________________________________
Control 4.1± 0.3 3.7± 0.2 3.6± 0.4 3.6± 0.2 3.7± 0.2 3.9± 0.3 3.7± 0.3
2 mg/m3 4.1± 0.3 3.8± 0.2 3.6± 0.2 3.6± 0.2 3.7± 0.3 3.8± 0.2 3.9± 0.3
8 mg/m3 4.2± 0.3 3.8± 0.2 3.6± 0.2 3.8± 0.2** 4.0± 0.4 4.0± 0.4 4.0± 0.4*
32 mg/m3 4.2± 0.3 3.8± 0.3 3.6± 0.2 3.7± 0.2 3.8± 0.2 3.9± 0.3 4.0± 0.3**
________________________________________________________________________________________________________________________________________________________________________________________________
Significant difference ; * : P ≦ 0.05 ** : P ≦ 0.01 Test of Dunnett
________________________________________________________________________________________________________________________________________________________________________________________________(HAN260) BAIS6

STUDY NO. : 0887 FOOD CONSUMPTION CHANGES (SUMMARY)ANIMAL : Jic:CB6F1-Tg rasH2@Jcl ALL ANIMALS
UNIT : gREPORT TYPE : A1 26
SEX : MALE PAGE : 2
________________________________________________________________________________________________________________________________________________________________________________________________
Group Name Administration week________________________________________________________________________________________________________________________________________8 9 10 11 12 13 14
________________________________________________________________________________________________________________________________________________________________________________________________
Control 3.9± 0.4 4.0± 0.4 4.1± 0.5 4.1± 0.5 4.1± 0.4 4.1± 0.6 4.0± 0.5
2 mg/m3 4.2± 0.4 4.3± 0.4 4.4± 0.5 4.4± 0.5* 4.5± 0.5* 4.4± 0.5* 4.3± 0.4
8 mg/m3 4.3± 0.4** 4.4± 0.4** 4.5± 0.4** 4.6± 0.5** 4.6± 0.4** 4.5± 0.4** 4.4± 0.4**
32 mg/m3 4.2± 0.3 4.2± 0.3 4.3± 0.3* 4.3± 0.3 4.3± 0.3 4.4± 0.3** 4.2± 0.3
________________________________________________________________________________________________________________________________________________________________________________________________
Significant difference ; * : P ≦ 0.05 ** : P ≦ 0.01 Test of Dunnett
________________________________________________________________________________________________________________________________________________________________________________________________(HAN260) BAIS6
STUDY NO. : 0887 FOOD CONSUMPTION CHANGES (SUMMARY)ANIMAL : Jic:CB6F1-Tg rasH2@Jcl ALL ANIMALS
UNIT : gREPORT TYPE : A1 26
SEX : MALE PAGE : 3
________________________________________________________________________________________________________________________________________________________________________________________________
Group Name Administration week________________________________________________________________________________________________________________________________________15 16 17 18 19 20 21
________________________________________________________________________________________________________________________________________________________________________________________________
Control 4.2± 0.5 4.0± 0.4 4.0± 0.6 4.2± 0.4 4.0± 0.5 4.0± 0.5 4.1± 0.5
2 mg/m3 4.4± 0.5 4.3± 0.5* 4.3± 0.4* 4.2± 0.5 4.2± 0.4 4.3± 0.4 4.2± 0.4
8 mg/m3 4.6± 0.5** 4.5± 0.4** 4.5± 0.5** 4.5± 0.5* 4.5± 0.4** 4.5± 0.4** 4.6± 0.4**
32 mg/m3 4.3± 0.3 4.3± 0.3* 4.3± 0.3** 4.3± 0.4 4.3± 0.3 4.3± 0.3 4.4± 0.4*
________________________________________________________________________________________________________________________________________________________________________________________________
Significant difference ; * : P ≦ 0.05 ** : P ≦ 0.01 Test of Dunnett
________________________________________________________________________________________________________________________________________________________________________________________________(HAN260) BAIS6
STUDY NO. : 0887 FOOD CONSUMPTION CHANGES (SUMMARY)ANIMAL : Jic:CB6F1-Tg rasH2@Jcl ALL ANIMALS
UNIT : gREPORT TYPE : A1 26
SEX : MALE PAGE : 4
________________________________________________________________________________________________________________________________________________________________________________________________
Group Name Administration week________________________________________________________________________________________________________________________________________22 23 24 25 26
________________________________________________________________________________________________________________________________________________________________________________________________
Control 4.1± 0.4 4.1± 0.4 4.1± 0.4 4.1± 0.4 4.1± 0.4
2 mg/m3 4.3± 0.4 4.5± 0.4** 4.3± 0.4 4.4± 0.4 4.4± 0.5
8 mg/m3 4.6± 0.4** 4.6± 0.4** 4.6± 0.5** 4.6± 0.4** 4.6± 0.4**
32 mg/m3 4.4± 0.3* 4.4± 0.4* 4.4± 0.3* 4.3± 0.4 4.4± 0.4
________________________________________________________________________________________________________________________________________________________________________________________________
Significant difference ; * : P ≦ 0.05 ** : P ≦ 0.01 Test of Dunnett
________________________________________________________________________________________________________________________________________________________________________________________________(HAN260) BAIS6
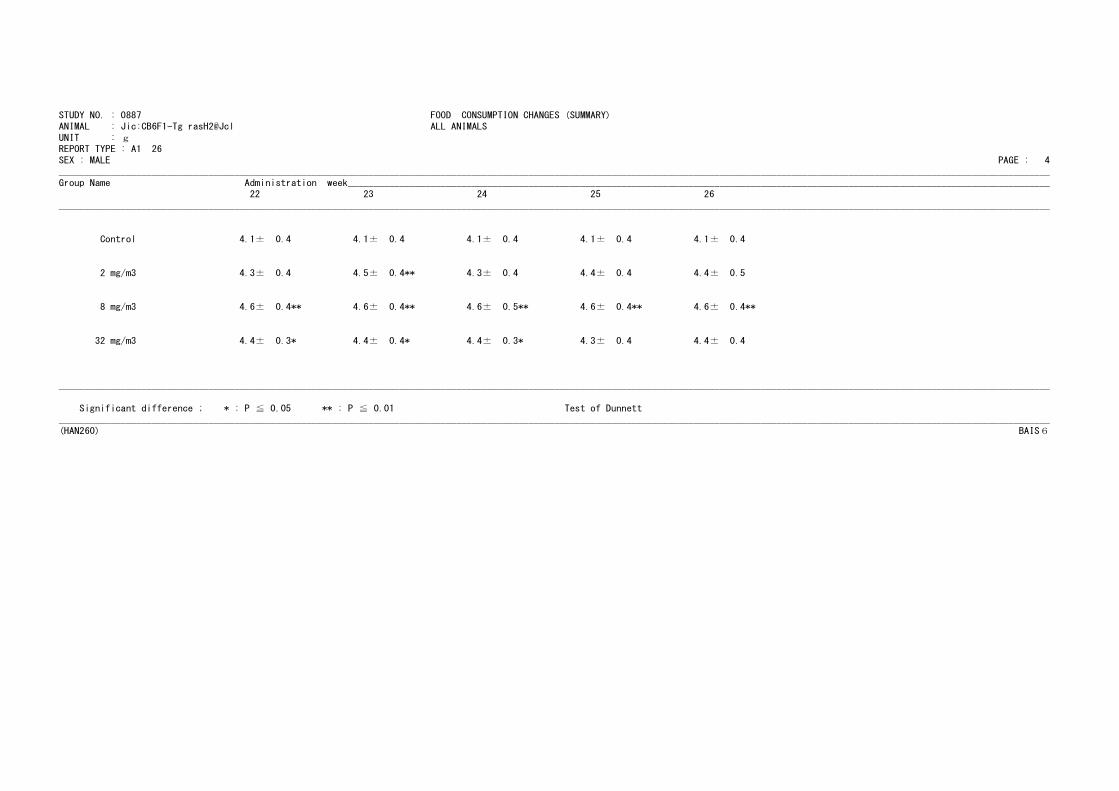
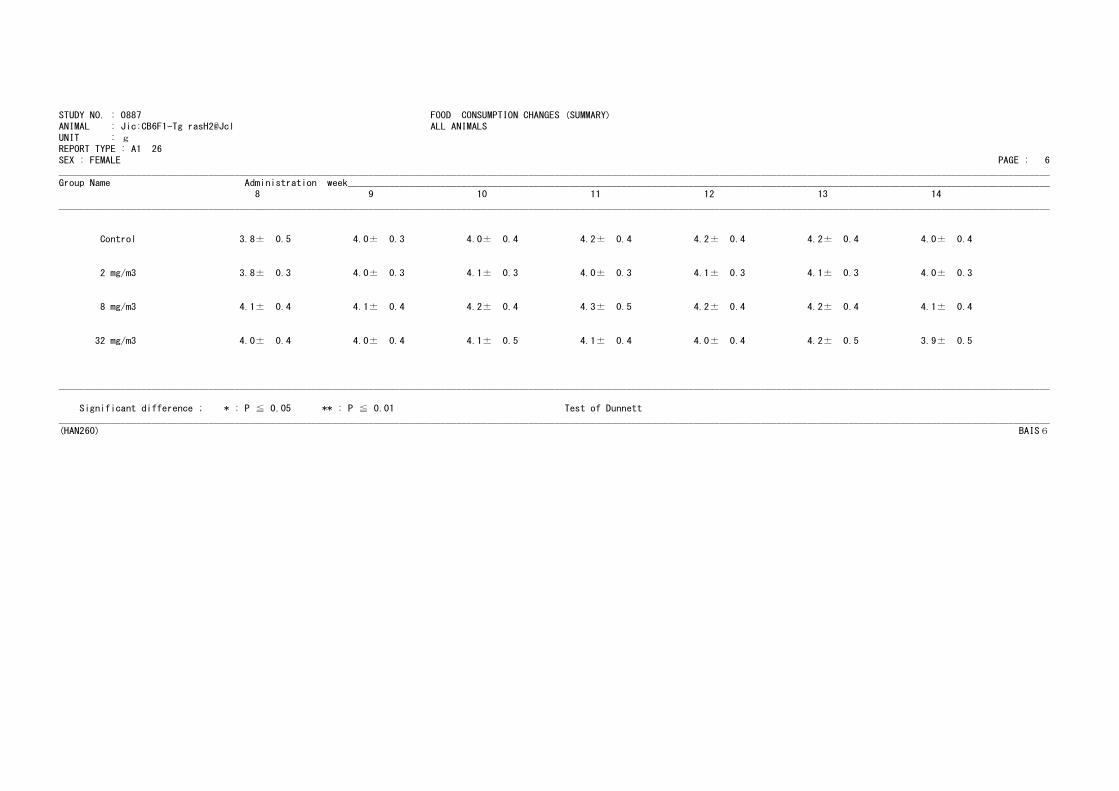
TABLE E4
FOOD CONSUMPTION CHANGES : FEMALE

STUDY NO. : 0887 FOOD CONSUMPTION CHANGES (SUMMARY)ANIMAL : Jic:CB6F1-Tg rasH2@Jcl ALL ANIMALS
UNIT : gREPORT TYPE : A1 26
SEX : FEMALE PAGE : 5
________________________________________________________________________________________________________________________________________________________________________________________________
Group Name Administration week________________________________________________________________________________________________________________________________________1 2 3 4 5 6 7
________________________________________________________________________________________________________________________________________________________________________________________________
Control 3.7± 0.4 3.2± 0.3 3.1± 0.2 3.0± 0.3 3.2± 0.3 3.5± 0.3 3.6± 0.3
2 mg/m3 3.8± 0.4 3.4± 0.3** 3.1± 0.2 3.0± 0.2 3.2± 0.4 3.4± 0.3 3.5± 0.3
8 mg/m3 3.8± 0.4 3.4± 0.2* 3.1± 0.3 3.2± 0.3 3.4± 0.3 3.4± 0.3 3.8± 0.4
32 mg/m3 3.9± 0.4 3.2± 0.3 3.0± 0.4 3.1± 0.2 3.2± 0.3 3.5± 0.3 3.7± 0.5
________________________________________________________________________________________________________________________________________________________________________________________________
Significant difference ; * : P ≦ 0.05 ** : P ≦ 0.01 Test of Dunnett
________________________________________________________________________________________________________________________________________________________________________________________________(HAN260) BAIS6
STUDY NO. : 0887 FOOD CONSUMPTION CHANGES (SUMMARY)ANIMAL : Jic:CB6F1-Tg rasH2@Jcl ALL ANIMALS
UNIT : gREPORT TYPE : A1 26
SEX : FEMALE PAGE : 6
________________________________________________________________________________________________________________________________________________________________________________________________
Group Name Administration week________________________________________________________________________________________________________________________________________8 9 10 11 12 13 14
________________________________________________________________________________________________________________________________________________________________________________________________
Control 3.8± 0.5 4.0± 0.3 4.0± 0.4 4.2± 0.4 4.2± 0.4 4.2± 0.4 4.0± 0.4
2 mg/m3 3.8± 0.3 4.0± 0.3 4.1± 0.3 4.0± 0.3 4.1± 0.3 4.1± 0.3 4.0± 0.3
8 mg/m3 4.1± 0.4 4.1± 0.4 4.2± 0.4 4.3± 0.5 4.2± 0.4 4.2± 0.4 4.1± 0.4
32 mg/m3 4.0± 0.4 4.0± 0.4 4.1± 0.5 4.1± 0.4 4.0± 0.4 4.2± 0.5 3.9± 0.5
________________________________________________________________________________________________________________________________________________________________________________________________
Significant difference ; * : P ≦ 0.05 ** : P ≦ 0.01 Test of Dunnett
________________________________________________________________________________________________________________________________________________________________________________________________(HAN260) BAIS6

STUDY NO. : 0887 FOOD CONSUMPTION CHANGES (SUMMARY)ANIMAL : Jic:CB6F1-Tg rasH2@Jcl ALL ANIMALS
UNIT : gREPORT TYPE : A1 26
SEX : FEMALE PAGE : 7
________________________________________________________________________________________________________________________________________________________________________________________________
Group Name Administration week________________________________________________________________________________________________________________________________________15 16 17 18 19 20 21
________________________________________________________________________________________________________________________________________________________________________________________________
Control 4.2± 0.4 4.1± 0.4 4.2± 0.5 4.2± 0.4 4.1± 0.4 4.2± 0.4 4.3± 0.4
2 mg/m3 4.1± 0.3 4.2± 0.4 3.9± 0.4* 4.1± 0.3 4.0± 0.3 4.0± 0.3 4.2± 0.4
8 mg/m3 4.2± 0.4 4.3± 0.4 4.2± 0.4 4.1± 0.4 4.2± 0.3 4.1± 0.3 4.3± 0.4
32 mg/m3 4.1± 0.4 4.0± 0.4 4.2± 0.4 4.1± 0.4 4.1± 0.4 4.1± 0.4 4.1± 0.5
________________________________________________________________________________________________________________________________________________________________________________________________
Significant difference ; * : P ≦ 0.05 ** : P ≦ 0.01 Test of Dunnett
________________________________________________________________________________________________________________________________________________________________________________________________(HAN260) BAIS6
STUDY NO. : 0887 FOOD CONSUMPTION CHANGES (SUMMARY)ANIMAL : Jic:CB6F1-Tg rasH2@Jcl ALL ANIMALS
UNIT : gREPORT TYPE : A1 26
SEX : FEMALE PAGE : 8
________________________________________________________________________________________________________________________________________________________________________________________________
Group Name Administration week________________________________________________________________________________________________________________________________________22 23 24 25 26
________________________________________________________________________________________________________________________________________________________________________________________________
Control 4.1± 0.4 4.2± 0.4 4.1± 0.4 4.2± 0.4 4.2± 0.4
2 mg/m3 4.2± 0.4 4.3± 0.4 4.2± 0.3 4.3± 0.5 4.2± 0.5
8 mg/m3 4.3± 0.4 4.4± 0.4 4.3± 0.3 4.3± 0.4 4.4± 0.4
32 mg/m3 4.3± 0.4 4.2± 0.6 4.2± 0.5 4.2± 0.4 4.2± 0.4
________________________________________________________________________________________________________________________________________________________________________________________________
Significant difference ; * : P ≦ 0.05 ** : P ≦ 0.01 Test of Dunnett
________________________________________________________________________________________________________________________________________________________________________________________________(HAN260) BAIS6
TABLE F1
HEMATOLOGY : MALE

STUDY NO. : 0887 HEMATOLOGY (SUMMARY)ANIMAL : Jic:CB6F1-Tg rasH2@Jcl ALL ANIMALS ( 27W)
MEASURE. TIME : 1SEX : MALE REPORT TYPE : A1 PAGE : 1
_________________________________________________________________________________________________________________________________________________________________________________________________
Group Name NO. of RED BLOOD CELL HEMOGLOBIN HEMATOCRIT MCV MCH MCHC PLATELET
Animals 1 / g/ % f pg g/ 1 / _________________________________________________________________________________________________________________________________________________________________________________________________
Control 24 11.15± 0.47 17.0± 0.7 51.6± 1.5 46.3± 1.3 15.3± 0.2 33.0± 0.7 1334± 121
2 mg/m3 23 10.98± 0.38 16.9± 0.6 50.9± 1.6 46.3± 0.7 15.3± 0.3 33.1± 0.5 1274± 69
8 mg/m3 25 10.92± 0.43* 17.0± 0.5 51.0± 2.1 46.7± 1.0 15.6± 0.4** 33.3± 0.6 1285± 93
32 mg/m3 25 10.39± 1.55** 16.1± 2.6 49.0± 7.0** 47.2± 1.5* 15.4± 0.6* 32.7± 1.8 1290± 170
_________________________________________________________________________________________________________________________________________________________________________________________________
Significant difference ; * : P ≦ 0.05 ** : P ≦ 0.01 Test of Dunnett_________________________________________________________________________________________________________________________________________________________________________________________________
(HCL070) BAIS6
STUDY NO. : 0887 HEMATOLOGY (SUMMARY)ANIMAL : Jic:CB6F1-Tg rasH2@Jcl ALL ANIMALS ( 27W)
MEASURE. TIME : 1SEX : MALE REPORT TYPE : A1 PAGE : 2
_________________________________________________________________________________________________________________________________________________________________________________________________
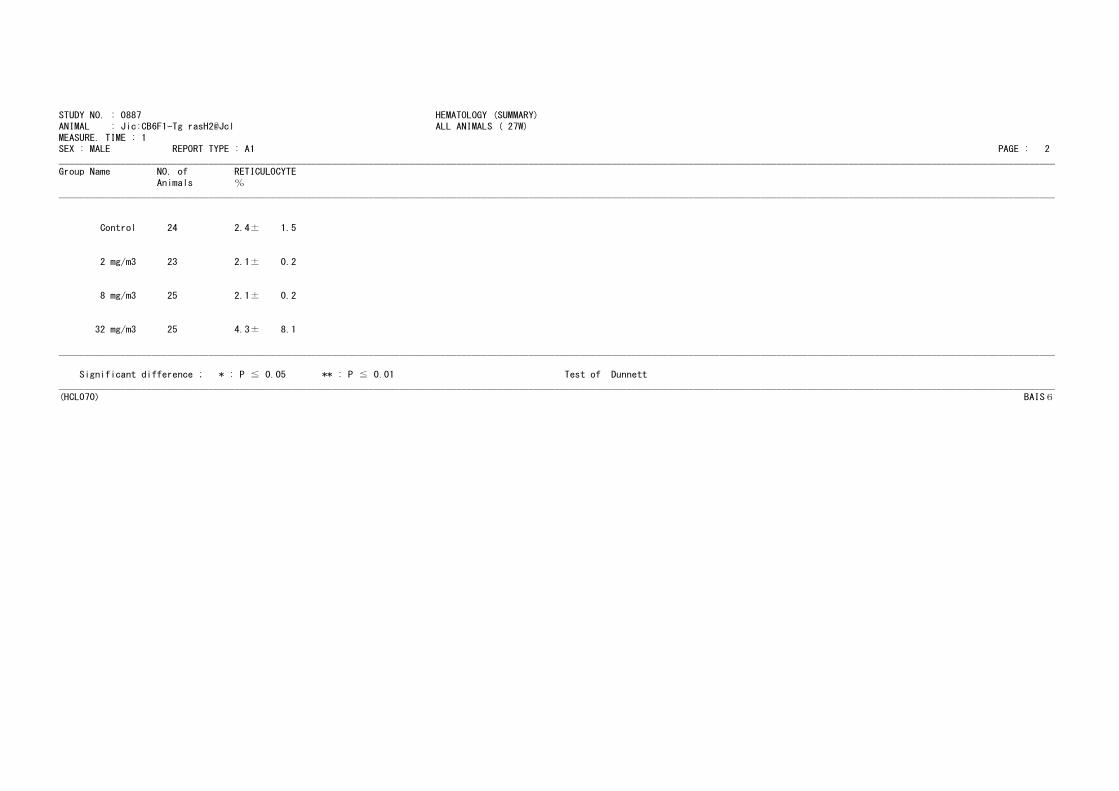
Group Name NO. of RETICULOCYTE
Animals %_________________________________________________________________________________________________________________________________________________________________________________________________
Control 24 2.4± 1.5
2 mg/m3 23 2.1± 0.2
8 mg/m3 25 2.1± 0.2
32 mg/m3 25 4.3± 8.1
_________________________________________________________________________________________________________________________________________________________________________________________________
Significant difference ; * : P ≦ 0.05 ** : P ≦ 0.01 Test of Dunnett_________________________________________________________________________________________________________________________________________________________________________________________________
(HCL070) BAIS6
STUDY NO. : 0887 HEMATOLOGY (SUMMARY)ANIMAL : Jic:CB6F1-Tg rasH2@Jcl ALL ANIMALS ( 27W)
MEASURE. TIME : 1SEX : MALE REPORT TYPE : A1 PAGE : 3
_________________________________________________________________________________________________________________________________________________________________________________________________
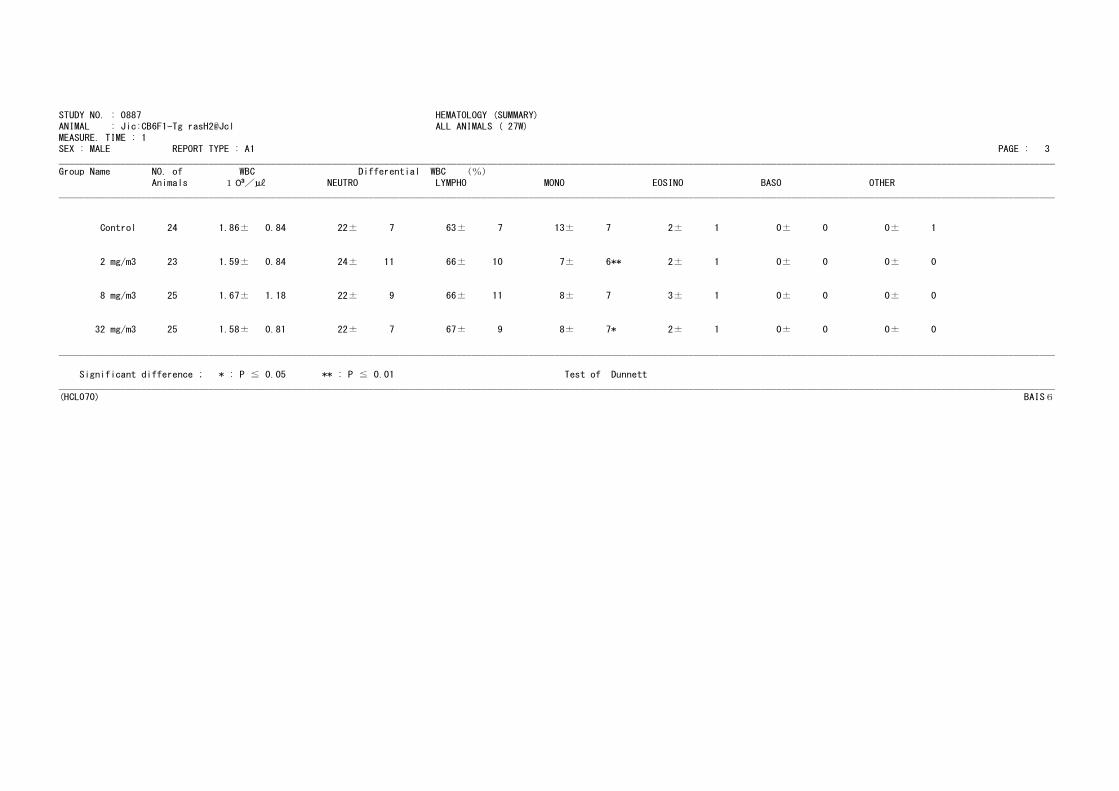
Group Name NO. of WBC Differential WBC (%)
Animals 1 / NEUTRO LYMPHO MONO EOSINO BASO OTHER_________________________________________________________________________________________________________________________________________________________________________________________________
Control 24 1.86± 0.84 22± 7 63± 7 13± 7 2± 1 0± 0 0± 1
2 mg/m3 23 1.59± 0.84 24± 11 66± 10 7± 6** 2± 1 0± 0 0± 0
8 mg/m3 25 1.67± 1.18 22± 9 66± 11 8± 7 3± 1 0± 0 0± 0
32 mg/m3 25 1.58± 0.81 22± 7 67± 9 8± 7* 2± 1 0± 0 0± 0
_________________________________________________________________________________________________________________________________________________________________________________________________
Significant difference ; * : P ≦ 0.05 ** : P ≦ 0.01 Test of Dunnett_________________________________________________________________________________________________________________________________________________________________________________________________
(HCL070) BAIS6

TABLE F2
HEMATOLOGY : FEMALE
STUDY NO. : 0887 HEMATOLOGY (SUMMARY)ANIMAL : Jic:CB6F1-Tg rasH2@Jcl ALL ANIMALS ( 27W)
MEASURE. TIME : 1SEX : FEMALE REPORT TYPE : A1 PAGE : 4
_________________________________________________________________________________________________________________________________________________________________________________________________
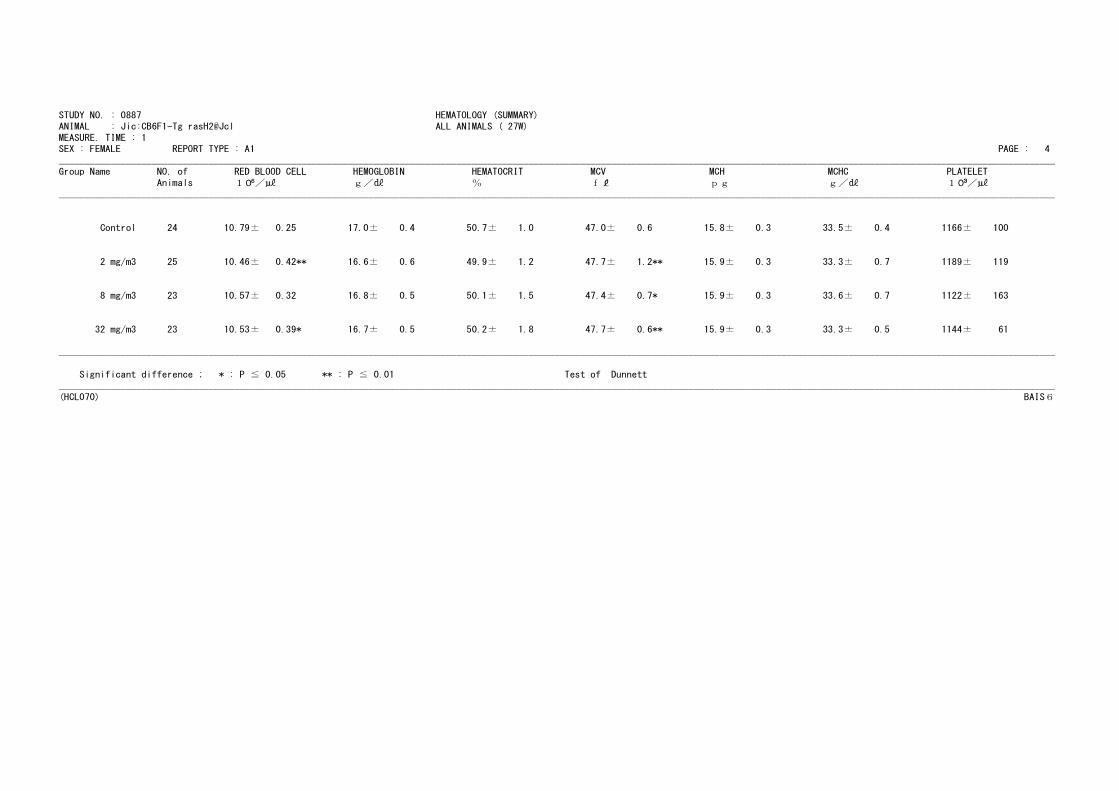
Group Name NO. of RED BLOOD CELL HEMOGLOBIN HEMATOCRIT MCV MCH MCHC PLATELET
Animals 1 / g/ % f pg g/ 1 / _________________________________________________________________________________________________________________________________________________________________________________________________
Control 24 10.79± 0.25 17.0± 0.4 50.7± 1.0 47.0± 0.6 15.8± 0.3 33.5± 0.4 1166± 100
2 mg/m3 25 10.46± 0.42** 16.6± 0.6 49.9± 1.2 47.7± 1.2** 15.9± 0.3 33.3± 0.7 1189± 119
8 mg/m3 23 10.57± 0.32 16.8± 0.5 50.1± 1.5 47.4± 0.7* 15.9± 0.3 33.6± 0.7 1122± 163
32 mg/m3 23 10.53± 0.39* 16.7± 0.5 50.2± 1.8 47.7± 0.6** 15.9± 0.3 33.3± 0.5 1144± 61
_________________________________________________________________________________________________________________________________________________________________________________________________
Significant difference ; * : P ≦ 0.05 ** : P ≦ 0.01 Test of Dunnett_________________________________________________________________________________________________________________________________________________________________________________________________
(HCL070) BAIS6
STUDY NO. : 0887 HEMATOLOGY (SUMMARY)ANIMAL : Jic:CB6F1-Tg rasH2@Jcl ALL ANIMALS ( 27W)
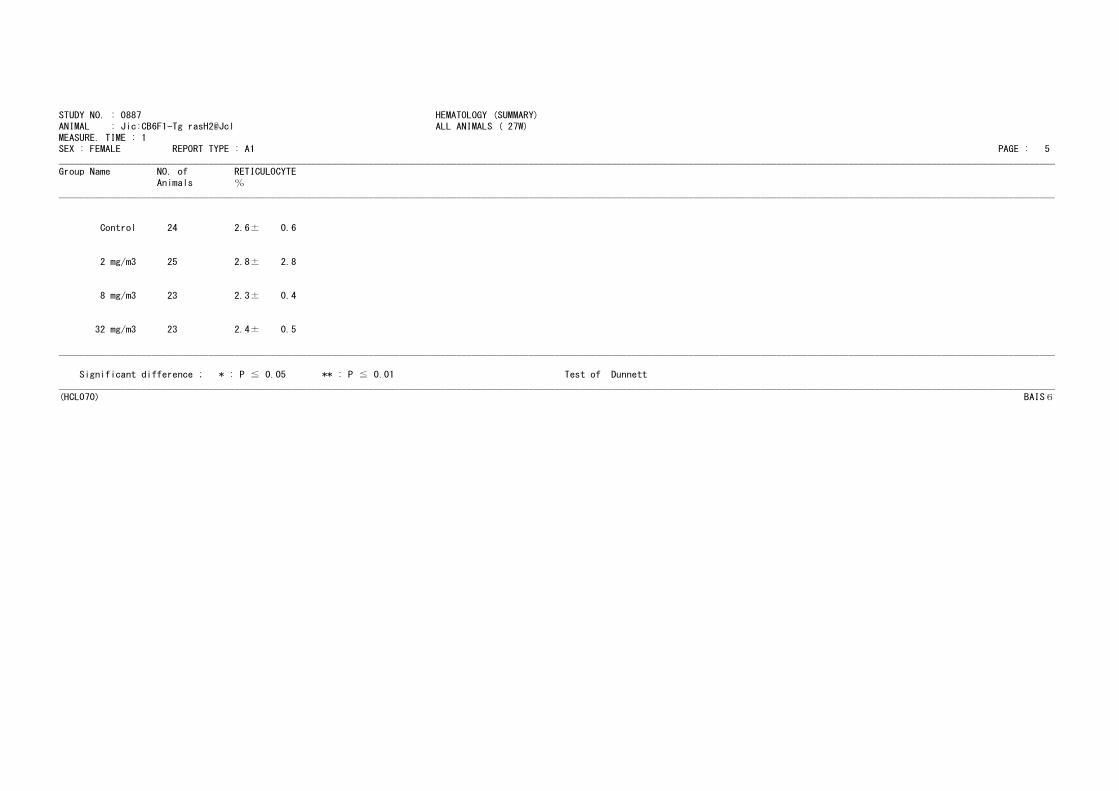
MEASURE. TIME : 1SEX : FEMALE REPORT TYPE : A1 PAGE : 5
_________________________________________________________________________________________________________________________________________________________________________________________________
Group Name NO. of RETICULOCYTE
Animals %_________________________________________________________________________________________________________________________________________________________________________________________________
Control 24 2.6± 0.6
2 mg/m3 25 2.8± 2.8
8 mg/m3 23 2.3± 0.4
32 mg/m3 23 2.4± 0.5
_________________________________________________________________________________________________________________________________________________________________________________________________
Significant difference ; * : P ≦ 0.05 ** : P ≦ 0.01 Test of Dunnett_________________________________________________________________________________________________________________________________________________________________________________________________
(HCL070) BAIS6
STUDY NO. : 0887 HEMATOLOGY (SUMMARY)ANIMAL : Jic:CB6F1-Tg rasH2@Jcl ALL ANIMALS ( 27W)
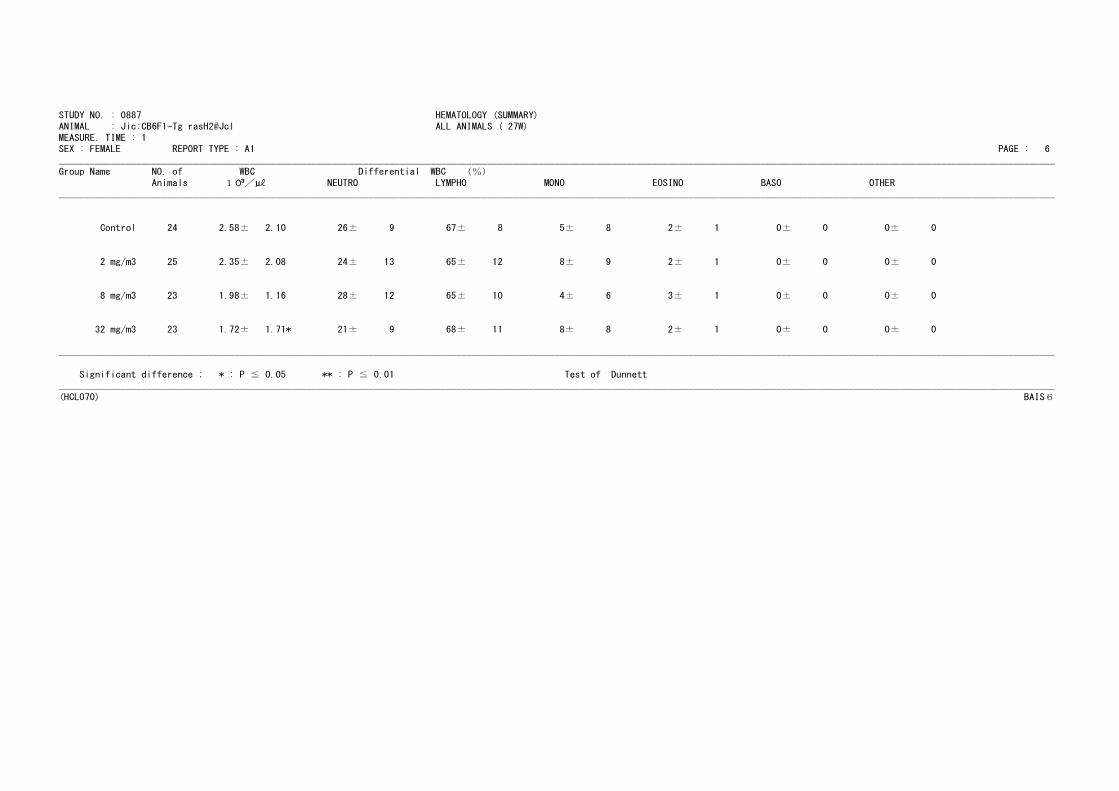
MEASURE. TIME : 1SEX : FEMALE REPORT TYPE : A1 PAGE : 6
_________________________________________________________________________________________________________________________________________________________________________________________________
Group Name NO. of WBC Differential WBC (%)
Animals 1 / NEUTRO LYMPHO MONO EOSINO BASO OTHER_________________________________________________________________________________________________________________________________________________________________________________________________
Control 24 2.58± 2.10 26± 9 67± 8 5± 8 2± 1 0± 0 0± 0
2 mg/m3 25 2.35± 2.08 24± 13 65± 12 8± 9 2± 1 0± 0 0± 0
8 mg/m3 23 1.98± 1.16 28± 12 65± 10 4± 6 3± 1 0± 0 0± 0
32 mg/m3 23 1.72± 1.71* 21± 9 68± 11 8± 8 2± 1 0± 0 0± 0
_________________________________________________________________________________________________________________________________________________________________________________________________
Significant difference ; * : P ≦ 0.05 ** : P ≦ 0.01 Test of Dunnett_________________________________________________________________________________________________________________________________________________________________________________________________
(HCL070) BAIS6

TABLE G1
BIOCHEMISTRY : MALE

STUDY NO. : 0887 BIOCHEMISTRY (SUMMARY)ANIMAL : Jic:CB6F1-Tg rasH2@Jcl ALL ANIMALS ( 27W)
MEASURE. TIME : 1SEX : MALE REPORT TYPE : A1 PAGE : 1
_________________________________________________________________________________________________________________________________________________________________________________________________
Group Name NO. of TOTAL PROTEIN ALBUMIN A/G RATIO T-BILIRUBIN GLUCOSE T-CHOLESTEROL TRIGLYCERIDE
Animals g/ g/ / / / / _________________________________________________________________________________________________________________________________________________________________________________________________
Control 23 5.1± 0.1 2.9± 0.1 1.3± 0.1 0.06± 0.01 201± 26 74± 7 45± 9
2 mg/m3 23 5.3± 0.2** 2.9± 0.1 1.2± 0.1* 0.06± 0.01 231± 20** 78± 8 54± 16
8 mg/m3 25 5.3± 0.2* 2.9± 0.1 1.2± 0.1** 0.05± 0.01 236± 29** 76± 8 53± 15
32 mg/m3 25 5.2± 0.2 2.9± 0.1 1.2± 0.1* 0.05± 0.01 223± 20** 78± 12 53± 17
_________________________________________________________________________________________________________________________________________________________________________________________________
Significant difference ; * : P ≦ 0.05 ** : P ≦ 0.01 Test of Dunnett_________________________________________________________________________________________________________________________________________________________________________________________________
(HCL074) BAIS6
STUDY NO. : 0887 BIOCHEMISTRY (SUMMARY)ANIMAL : Jic:CB6F1-Tg rasH2@Jcl ALL ANIMALS ( 27W)
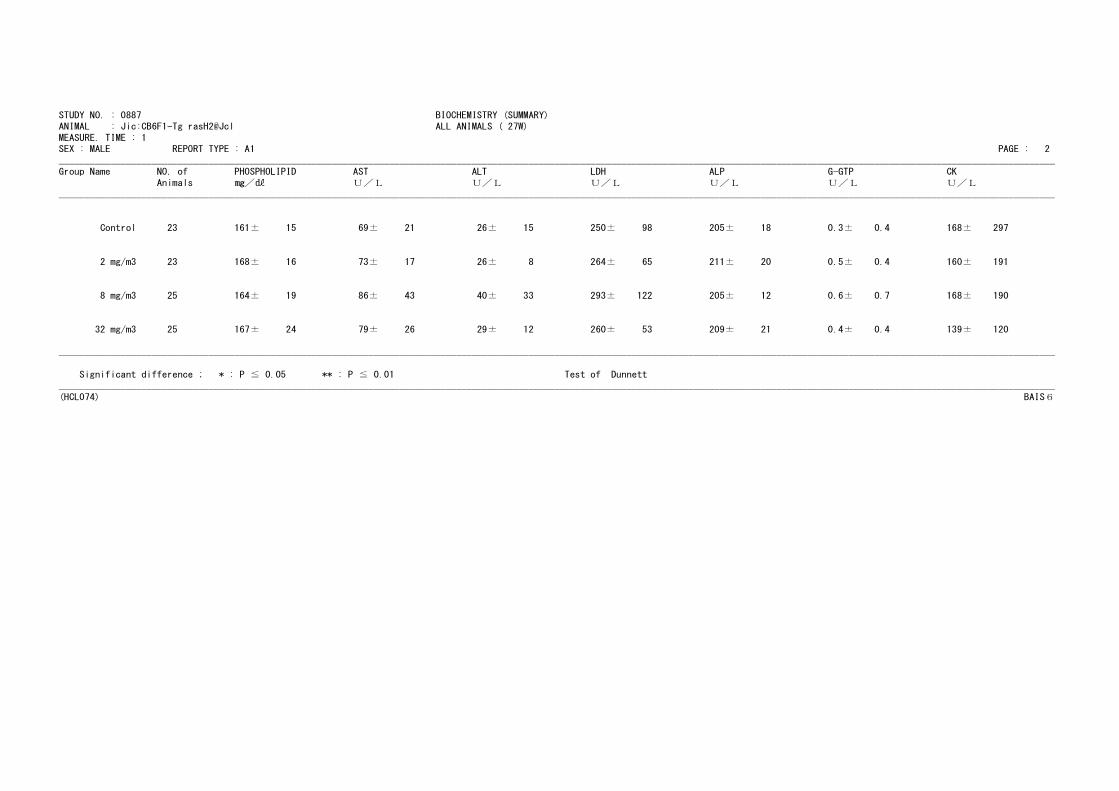
MEASURE. TIME : 1SEX : MALE REPORT TYPE : A1 PAGE : 2
_________________________________________________________________________________________________________________________________________________________________________________________________
Group Name NO. of PHOSPHOLIPID AST ALT LDH ALP G-GTP CK
Animals / U/L U/L U/L U/L U/L U/L_________________________________________________________________________________________________________________________________________________________________________________________________
Control 23 161± 15 69± 21 26± 15 250± 98 205± 18 0.3± 0.4 168± 297
2 mg/m3 23 168± 16 73± 17 26± 8 264± 65 211± 20 0.5± 0.4 160± 191
8 mg/m3 25 164± 19 86± 43 40± 33 293± 122 205± 12 0.6± 0.7 168± 190
32 mg/m3 25 167± 24 79± 26 29± 12 260± 53 209± 21 0.4± 0.4 139± 120
_________________________________________________________________________________________________________________________________________________________________________________________________
Significant difference ; * : P ≦ 0.05 ** : P ≦ 0.01 Test of Dunnett_________________________________________________________________________________________________________________________________________________________________________________________________
(HCL074) BAIS6
STUDY NO. : 0887 BIOCHEMISTRY (SUMMARY)ANIMAL : Jic:CB6F1-Tg rasH2@Jcl ALL ANIMALS ( 27W)
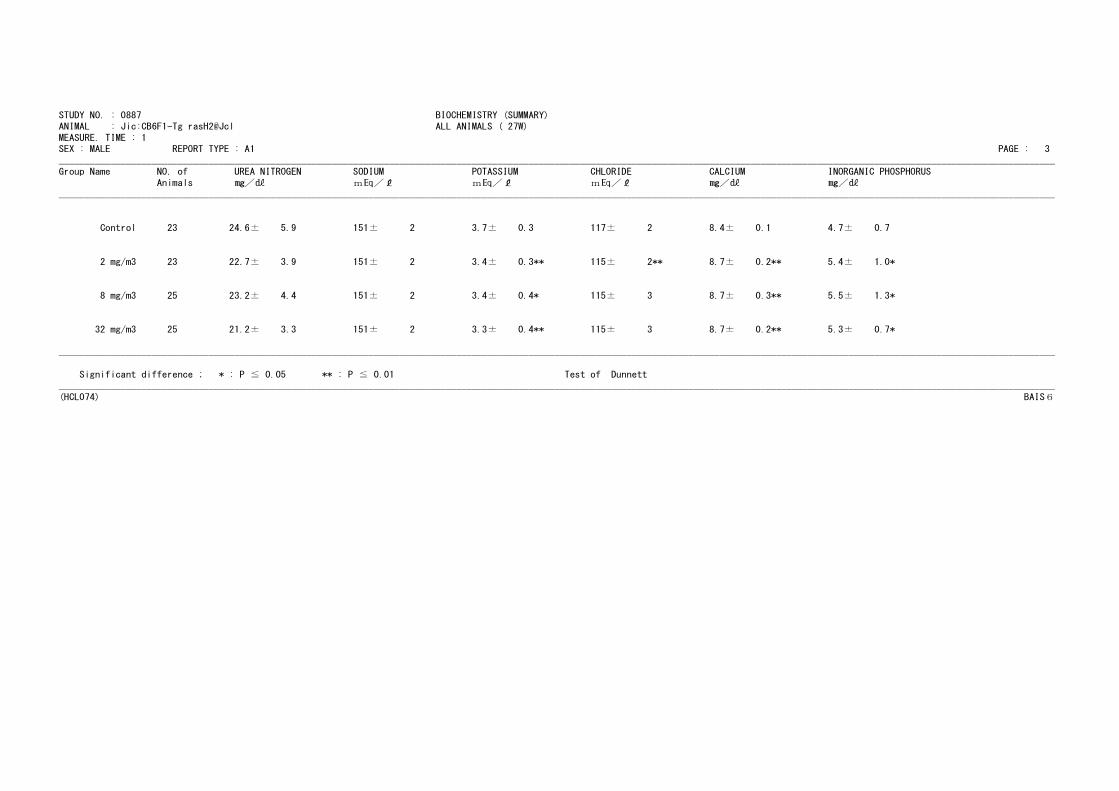
MEASURE. TIME : 1SEX : MALE REPORT TYPE : A1 PAGE : 3
_________________________________________________________________________________________________________________________________________________________________________________________________
Group Name NO. of UREA NITROGEN SODIUM POTASSIUM CHLORIDE CALCIUM INORGANIC PHOSPHORUS
Animals / m / m / m / / / _________________________________________________________________________________________________________________________________________________________________________________________________
Control 23 24.6± 5.9 151± 2 3.7± 0.3 117± 2 8.4± 0.1 4.7± 0.7
2 mg/m3 23 22.7± 3.9 151± 2 3.4± 0.3** 115± 2** 8.7± 0.2** 5.4± 1.0*
8 mg/m3 25 23.2± 4.4 151± 2 3.4± 0.4* 115± 3 8.7± 0.3** 5.5± 1.3*
32 mg/m3 25 21.2± 3.3 151± 2 3.3± 0.4** 115± 3 8.7± 0.2** 5.3± 0.7*
_________________________________________________________________________________________________________________________________________________________________________________________________
Significant difference ; * : P ≦ 0.05 ** : P ≦ 0.01 Test of Dunnett_________________________________________________________________________________________________________________________________________________________________________________________________
(HCL074) BAIS6
TABLE G2
BIOCHEMISTRY : FEMALE
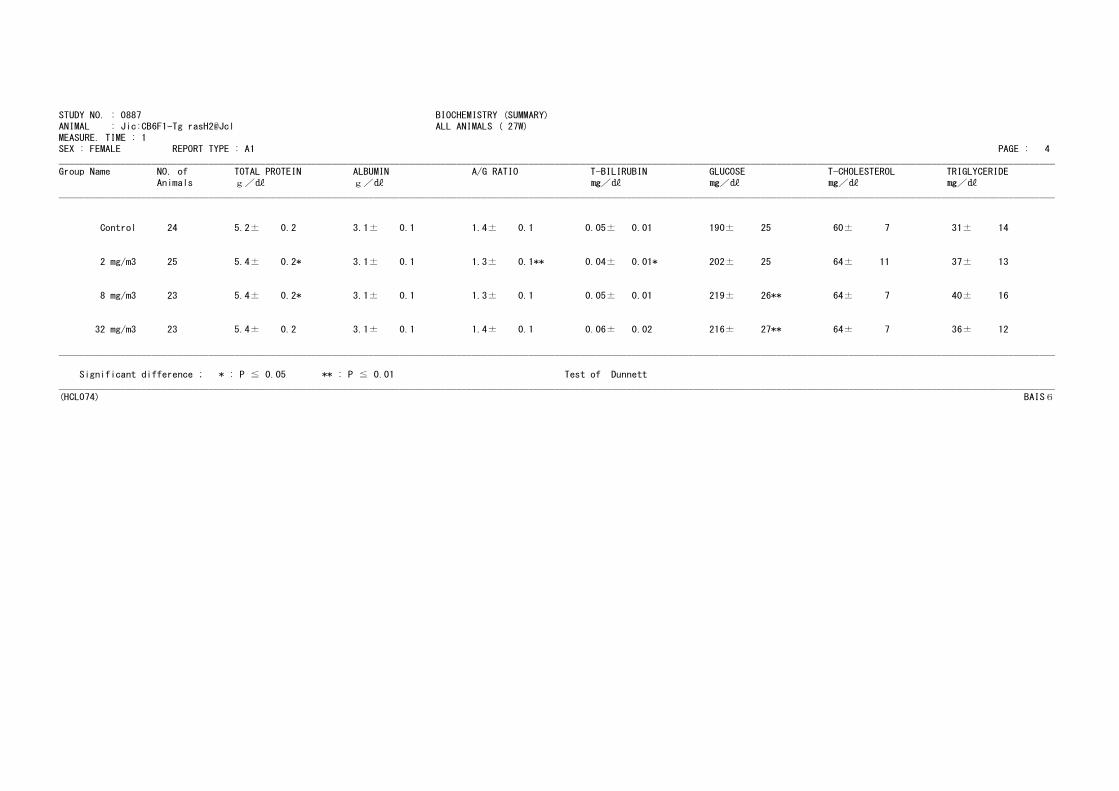
STUDY NO. : 0887 BIOCHEMISTRY (SUMMARY)ANIMAL : Jic:CB6F1-Tg rasH2@Jcl ALL ANIMALS ( 27W)
MEASURE. TIME : 1SEX : FEMALE REPORT TYPE : A1 PAGE : 4
_________________________________________________________________________________________________________________________________________________________________________________________________
Group Name NO. of TOTAL PROTEIN ALBUMIN A/G RATIO T-BILIRUBIN GLUCOSE T-CHOLESTEROL TRIGLYCERIDE
Animals g/ g/ / / / / _________________________________________________________________________________________________________________________________________________________________________________________________
Control 24 5.2± 0.2 3.1± 0.1 1.4± 0.1 0.05± 0.01 190± 25 60± 7 31± 14
2 mg/m3 25 5.4± 0.2* 3.1± 0.1 1.3± 0.1** 0.04± 0.01* 202± 25 64± 11 37± 13
8 mg/m3 23 5.4± 0.2* 3.1± 0.1 1.3± 0.1 0.05± 0.01 219± 26** 64± 7 40± 16
32 mg/m3 23 5.4± 0.2 3.1± 0.1 1.4± 0.1 0.06± 0.02 216± 27** 64± 7 36± 12
_________________________________________________________________________________________________________________________________________________________________________________________________
Significant difference ; * : P ≦ 0.05 ** : P ≦ 0.01 Test of Dunnett_________________________________________________________________________________________________________________________________________________________________________________________________
(HCL074) BAIS6
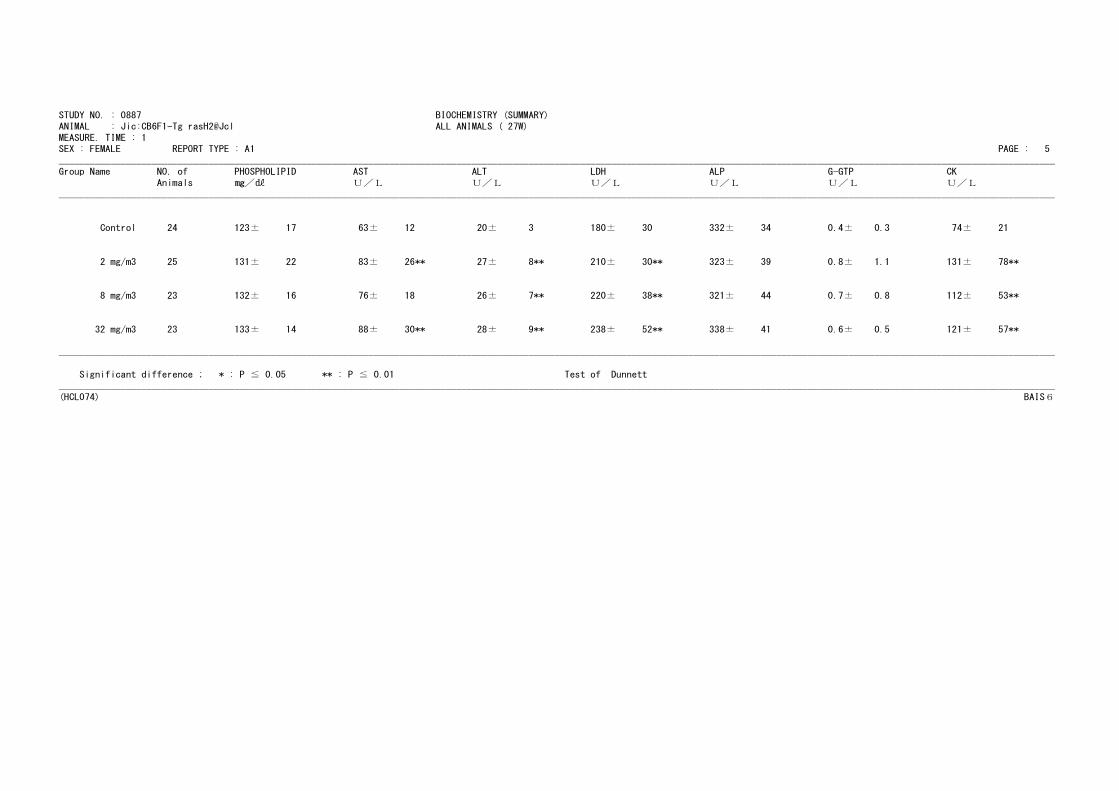
STUDY NO. : 0887 BIOCHEMISTRY (SUMMARY)ANIMAL : Jic:CB6F1-Tg rasH2@Jcl ALL ANIMALS ( 27W)
MEASURE. TIME : 1SEX : FEMALE REPORT TYPE : A1 PAGE : 5
_________________________________________________________________________________________________________________________________________________________________________________________________
Group Name NO. of PHOSPHOLIPID AST ALT LDH ALP G-GTP CK
Animals / U/L U/L U/L U/L U/L U/L_________________________________________________________________________________________________________________________________________________________________________________________________
Control 24 123± 17 63± 12 20± 3 180± 30 332± 34 0.4± 0.3 74± 21
2 mg/m3 25 131± 22 83± 26** 27± 8** 210± 30** 323± 39 0.8± 1.1 131± 78**
8 mg/m3 23 132± 16 76± 18 26± 7** 220± 38** 321± 44 0.7± 0.8 112± 53**
32 mg/m3 23 133± 14 88± 30** 28± 9** 238± 52** 338± 41 0.6± 0.5 121± 57**
_________________________________________________________________________________________________________________________________________________________________________________________________
Significant difference ; * : P ≦ 0.05 ** : P ≦ 0.01 Test of Dunnett_________________________________________________________________________________________________________________________________________________________________________________________________
(HCL074) BAIS6
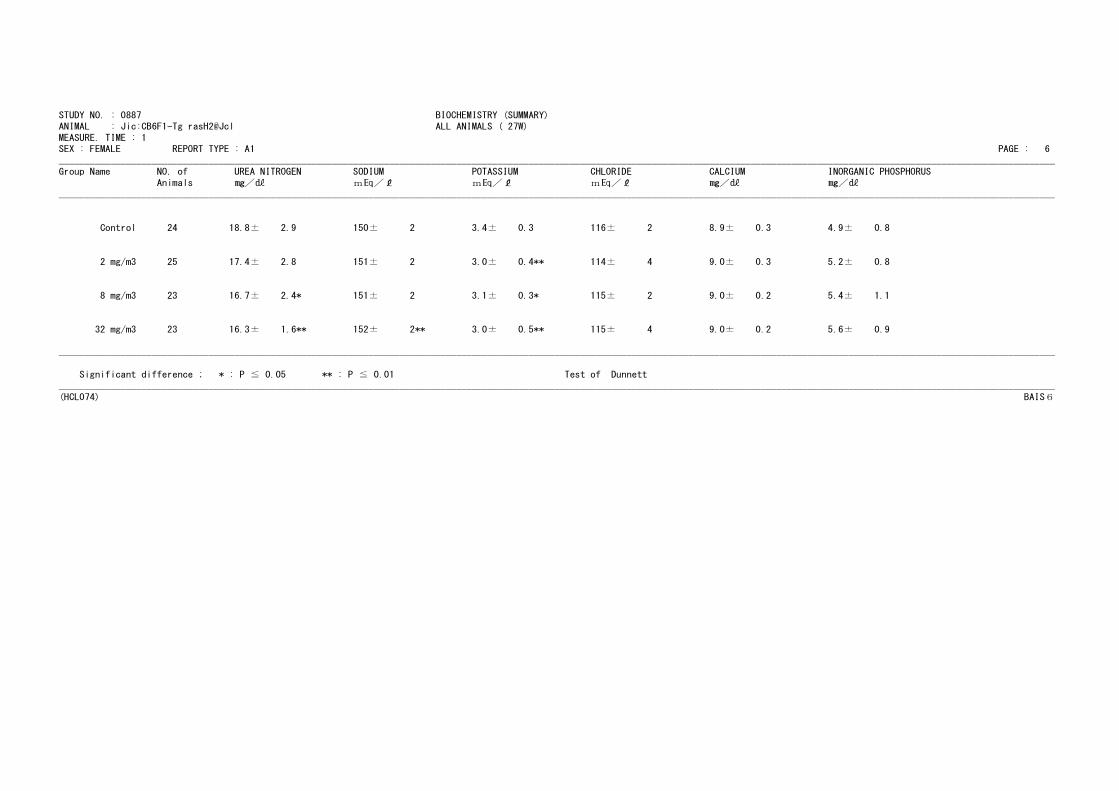
STUDY NO. : 0887 BIOCHEMISTRY (SUMMARY)ANIMAL : Jic:CB6F1-Tg rasH2@Jcl ALL ANIMALS ( 27W)
MEASURE. TIME : 1SEX : FEMALE REPORT TYPE : A1 PAGE : 6
_________________________________________________________________________________________________________________________________________________________________________________________________
Group Name NO. of UREA NITROGEN SODIUM POTASSIUM CHLORIDE CALCIUM INORGANIC PHOSPHORUS
Animals / m / m / m / / / _________________________________________________________________________________________________________________________________________________________________________________________________
Control 24 18.8± 2.9 150± 2 3.4± 0.3 116± 2 8.9± 0.3 4.9± 0.8
2 mg/m3 25 17.4± 2.8 151± 2 3.0± 0.4** 114± 4 9.0± 0.3 5.2± 0.8
8 mg/m3 23 16.7± 2.4* 151± 2 3.1± 0.3* 115± 2 9.0± 0.2 5.4± 1.1
32 mg/m3 23 16.3± 1.6** 152± 2** 3.0± 0.5** 115± 4 9.0± 0.2 5.6± 0.9
_________________________________________________________________________________________________________________________________________________________________________________________________
Significant difference ; * : P ≦ 0.05 ** : P ≦ 0.01 Test of Dunnett_________________________________________________________________________________________________________________________________________________________________________________________________
(HCL074) BAIS6
TABLE H1
GROSS FINDINGS : MALE
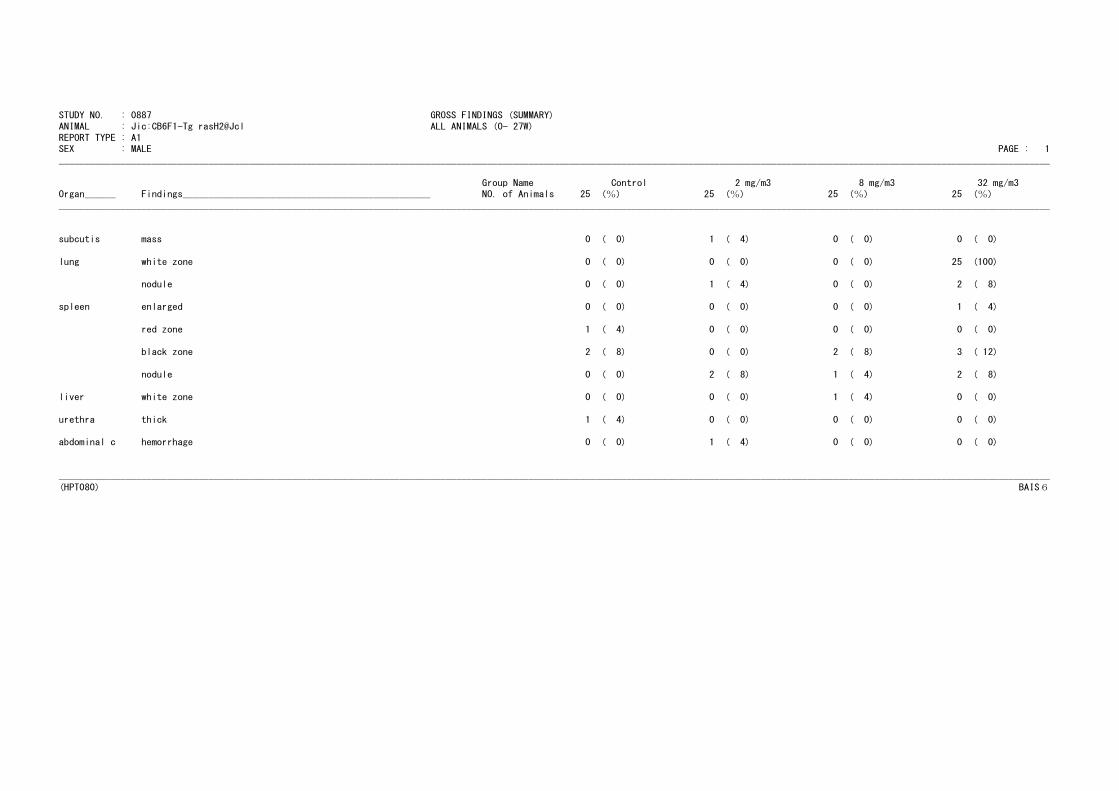
STUDY NO. : 0887 GROSS FINDINGS (SUMMARY)ANIMAL : Jic:CB6F1-Tg rasH2@Jcl ALL ANIMALS (0- 27W)
REPORT TYPE : A1SEX : MALE PAGE : 1
________________________________________________________________________________________________________________________________________________________________________________________________
Group Name Control 2 mg/m3 8 mg/m3 32 mg/m3Organ______ Findings________________________________________________ NO. of Animals 25 (%) 25 (%) 25 (%) 25 (%)________________________________________________________________________________________________________________________________________________________________________________________________
subcutis mass 0 ( 0) 1 ( 4) 0 ( 0) 0 ( 0)
lung white zone 0 ( 0) 0 ( 0) 0 ( 0) 25 (100)
nodule 0 ( 0) 1 ( 4) 0 ( 0) 2 ( 8)
spleen enlarged 0 ( 0) 0 ( 0) 0 ( 0) 1 ( 4)
red zone 1 ( 4) 0 ( 0) 0 ( 0) 0 ( 0)
black zone 2 ( 8) 0 ( 0) 2 ( 8) 3 ( 12)
nodule 0 ( 0) 2 ( 8) 1 ( 4) 2 ( 8)
liver white zone 0 ( 0) 0 ( 0) 1 ( 4) 0 ( 0)
urethra thick 1 ( 4) 0 ( 0) 0 ( 0) 0 ( 0)
abdominal c hemorrhage 0 ( 0) 1 ( 4) 0 ( 0) 0 ( 0)
________________________________________________________________________________________________________________________________________________________________________________________________
(HPT080) BAIS6
TABLE H2
GROSS FINDINGS : FEMALE
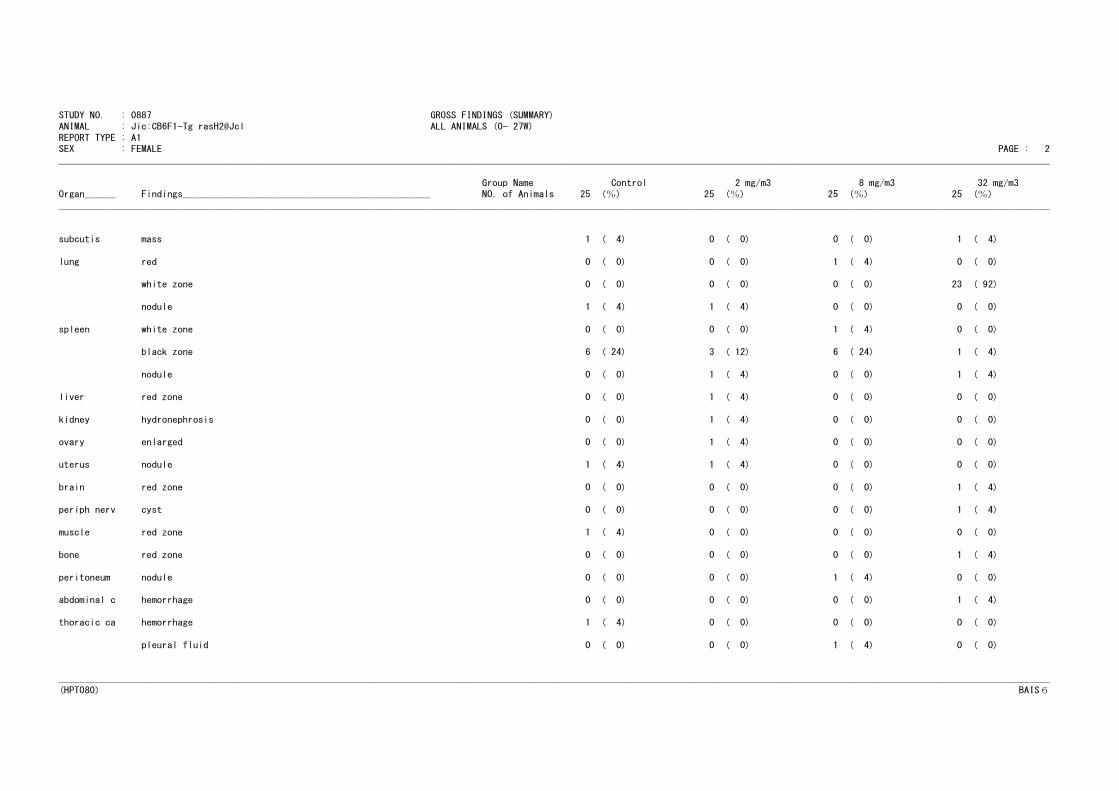
STUDY NO. : 0887 GROSS FINDINGS (SUMMARY)ANIMAL : Jic:CB6F1-Tg rasH2@Jcl ALL ANIMALS (0- 27W)
REPORT TYPE : A1SEX : FEMALE PAGE : 2
________________________________________________________________________________________________________________________________________________________________________________________________
Group Name Control 2 mg/m3 8 mg/m3 32 mg/m3Organ______ Findings________________________________________________ NO. of Animals 25 (%) 25 (%) 25 (%) 25 (%)________________________________________________________________________________________________________________________________________________________________________________________________
subcutis mass 1 ( 4) 0 ( 0) 0 ( 0) 1 ( 4)
lung red 0 ( 0) 0 ( 0) 1 ( 4) 0 ( 0)
white zone 0 ( 0) 0 ( 0) 0 ( 0) 23 ( 92)
nodule 1 ( 4) 1 ( 4) 0 ( 0) 0 ( 0)
spleen white zone 0 ( 0) 0 ( 0) 1 ( 4) 0 ( 0)
black zone 6 ( 24) 3 ( 12) 6 ( 24) 1 ( 4)
nodule 0 ( 0) 1 ( 4) 0 ( 0) 1 ( 4)
liver red zone 0 ( 0) 1 ( 4) 0 ( 0) 0 ( 0)
kidney hydronephrosis 0 ( 0) 1 ( 4) 0 ( 0) 0 ( 0)
ovary enlarged 0 ( 0) 1 ( 4) 0 ( 0) 0 ( 0)
uterus nodule 1 ( 4) 1 ( 4) 0 ( 0) 0 ( 0)
brain red zone 0 ( 0) 0 ( 0) 0 ( 0) 1 ( 4)
periph nerv cyst 0 ( 0) 0 ( 0) 0 ( 0) 1 ( 4)
muscle red zone 1 ( 4) 0 ( 0) 0 ( 0) 0 ( 0)
bone red zone 0 ( 0) 0 ( 0) 0 ( 0) 1 ( 4)
peritoneum nodule 0 ( 0) 0 ( 0) 1 ( 4) 0 ( 0)
abdominal c hemorrhage 0 ( 0) 0 ( 0) 0 ( 0) 1 ( 4)
thoracic ca hemorrhage 1 ( 4) 0 ( 0) 0 ( 0) 0 ( 0)
pleural fluid 0 ( 0) 0 ( 0) 1 ( 4) 0 ( 0)
________________________________________________________________________________________________________________________________________________________________________________________________
(HPT080) BAIS6
TABLE I1
ORGAN WEIGHT, ABSOLUTE : MALE
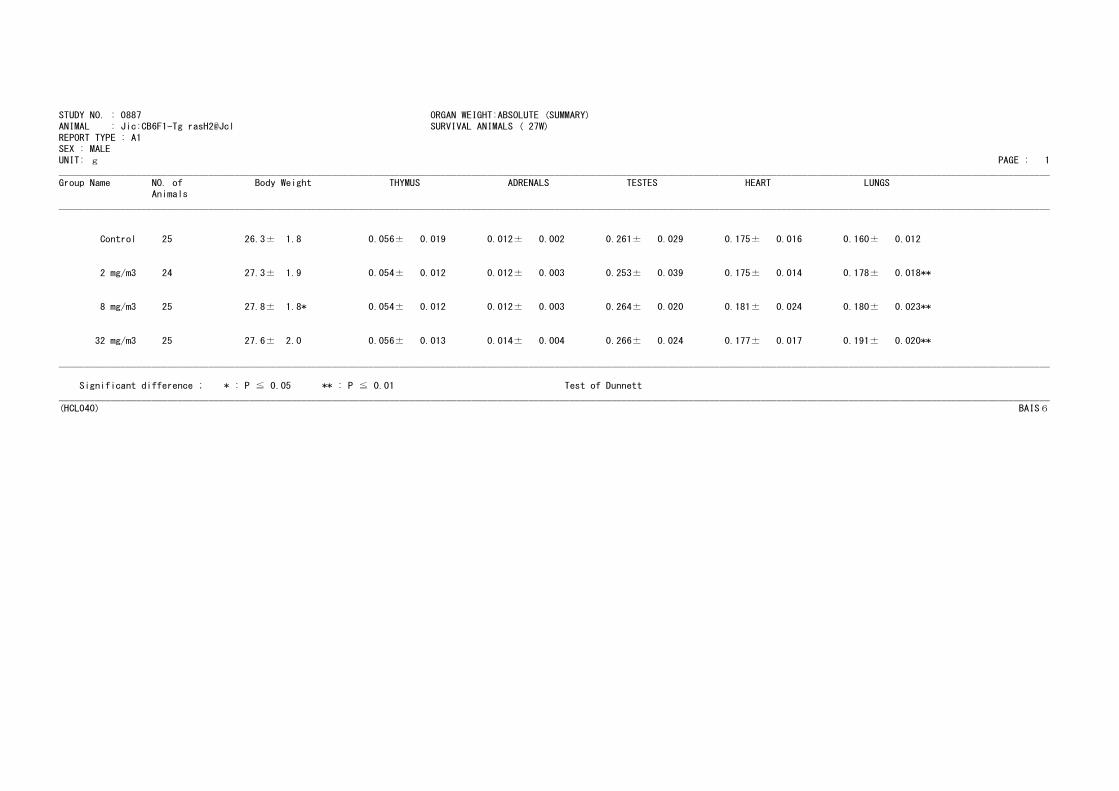
STUDY NO. : 0887 ORGAN WEIGHT:ABSOLUTE (SUMMARY)ANIMAL : Jic:CB6F1-Tg rasH2@Jcl SURVIVAL ANIMALS ( 27W)
REPORT TYPE : A1SEX : MALE
UNIT: g PAGE : 1
________________________________________________________________________________________________________________________________________________________________________________________________
Group Name NO. of Body Weight THYMUS ADRENALS TESTES HEART LUNGSAnimals
________________________________________________________________________________________________________________________________________________________________________________________________
Control 25 26.3± 1.8 0.056± 0.019 0.012± 0.002 0.261± 0.029 0.175± 0.016 0.160± 0.012
2 mg/m3 24 27.3± 1.9 0.054± 0.012 0.012± 0.003 0.253± 0.039 0.175± 0.014 0.178± 0.018**
8 mg/m3 25 27.8± 1.8* 0.054± 0.012 0.012± 0.003 0.264± 0.020 0.181± 0.024 0.180± 0.023**
32 mg/m3 25 27.6± 2.0 0.056± 0.013 0.014± 0.004 0.266± 0.024 0.177± 0.017 0.191± 0.020**
________________________________________________________________________________________________________________________________________________________________________________________________
Significant difference ; * : P ≦ 0.05 ** : P ≦ 0.01 Test of Dunnett
________________________________________________________________________________________________________________________________________________________________________________________________
(HCL040) BAIS6
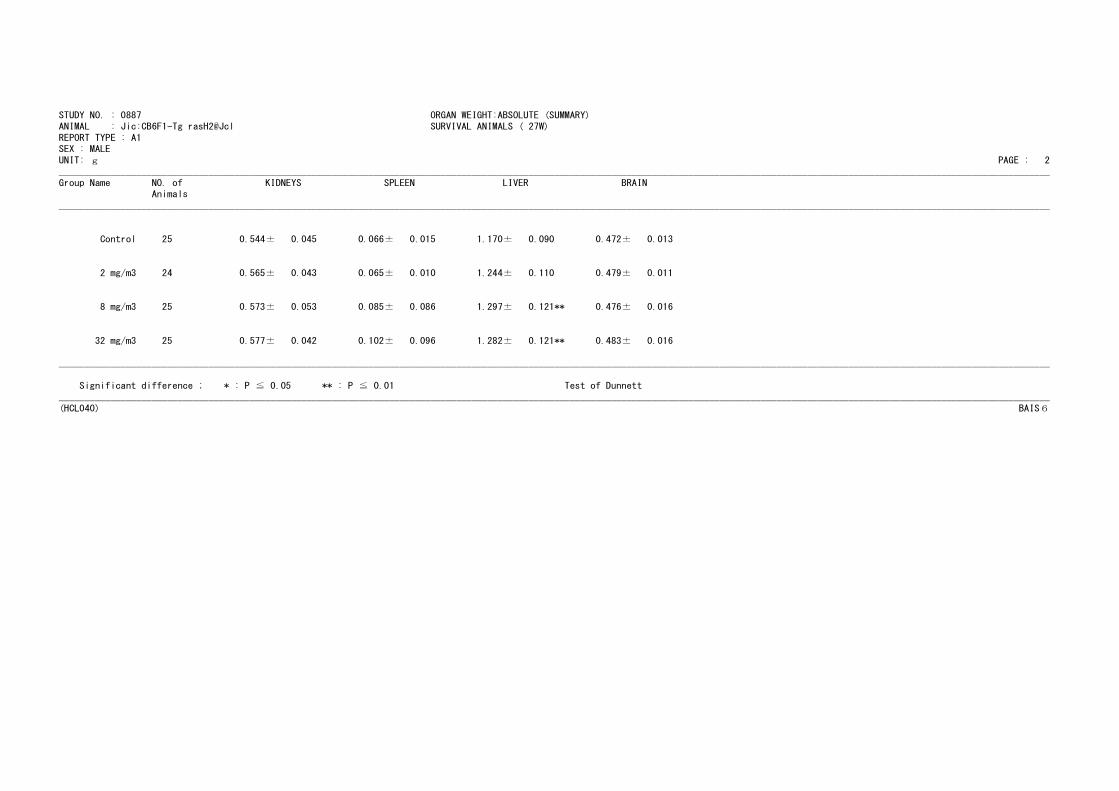
STUDY NO. : 0887 ORGAN WEIGHT:ABSOLUTE (SUMMARY)ANIMAL : Jic:CB6F1-Tg rasH2@Jcl SURVIVAL ANIMALS ( 27W)
REPORT TYPE : A1SEX : MALE
UNIT: g PAGE : 2
________________________________________________________________________________________________________________________________________________________________________________________________
Group Name NO. of KIDNEYS SPLEEN LIVER BRAINAnimals
________________________________________________________________________________________________________________________________________________________________________________________________
Control 25 0.544± 0.045 0.066± 0.015 1.170± 0.090 0.472± 0.013
2 mg/m3 24 0.565± 0.043 0.065± 0.010 1.244± 0.110 0.479± 0.011
8 mg/m3 25 0.573± 0.053 0.085± 0.086 1.297± 0.121** 0.476± 0.016
32 mg/m3 25 0.577± 0.042 0.102± 0.096 1.282± 0.121** 0.483± 0.016
________________________________________________________________________________________________________________________________________________________________________________________________
Significant difference ; * : P ≦ 0.05 ** : P ≦ 0.01 Test of Dunnett
________________________________________________________________________________________________________________________________________________________________________________________________
(HCL040) BAIS6
TABLE I2
ORGAN WEIGHT, ABSOLUTE : FEMALE

STUDY NO. : 0887 ORGAN WEIGHT:ABSOLUTE (SUMMARY)ANIMAL : Jic:CB6F1-Tg rasH2@Jcl SURVIVAL ANIMALS ( 27W)
REPORT TYPE : A1SEX : FEMALE
UNIT: g PAGE : 3
________________________________________________________________________________________________________________________________________________________________________________________________
Group Name NO. of Body Weight THYMUS ADRENALS OVARIES HEART LUNGSAnimals
________________________________________________________________________________________________________________________________________________________________________________________________
Control 24 21.4± 1.1 0.049± 0.013 0.014± 0.003 0.030± 0.006 0.145± 0.011 0.160± 0.010
2 mg/m3 25 22.0± 1.4 0.054± 0.022 0.015± 0.003 0.040± 0.013** 0.149± 0.012 0.176± 0.021**
8 mg/m3 24 22.3± 1.4 0.054± 0.011 0.015± 0.002 0.037± 0.007** 0.143± 0.010 0.173± 0.016**
32 mg/m3 23 22.0± 1.4 0.054± 0.014 0.015± 0.004 0.038± 0.007** 0.141± 0.011 0.177± 0.020**
________________________________________________________________________________________________________________________________________________________________________________________________
Significant difference ; * : P ≦ 0.05 ** : P ≦ 0.01 Test of Dunnett
________________________________________________________________________________________________________________________________________________________________________________________________
(HCL040) BAIS6

STUDY NO. : 0887 ORGAN WEIGHT:ABSOLUTE (SUMMARY)ANIMAL : Jic:CB6F1-Tg rasH2@Jcl SURVIVAL ANIMALS ( 27W)
REPORT TYPE : A1SEX : FEMALE
UNIT: g PAGE : 4
________________________________________________________________________________________________________________________________________________________________________________________________
Group Name NO. of KIDNEYS SPLEEN LIVER BRAINAnimals
________________________________________________________________________________________________________________________________________________________________________________________________
Control 24 0.410± 0.027 0.080± 0.012 1.009± 0.078 0.496± 0.015
2 mg/m3 25 0.431± 0.128 0.087± 0.016 1.071± 0.104 0.502± 0.014
8 mg/m3 24 0.418± 0.029 0.087± 0.016 1.103± 0.093** 0.504± 0.022
32 mg/m3 23 0.407± 0.028 0.081± 0.013 1.071± 0.090 0.498± 0.018
________________________________________________________________________________________________________________________________________________________________________________________________
Significant difference ; * : P ≦ 0.05 ** : P ≦ 0.01 Test of Dunnett
________________________________________________________________________________________________________________________________________________________________________________________________
(HCL040) BAIS6
TABLE J1
ORGAN WEIGHT, RELATIVE : MALE

STUDY NO. : 0887 ORGAN WEIGHT:RELATIVE (SUMMARY)ANIMAL : Jic:CB6F1-Tg rasH2@Jcl SURVIVAL ANIMALS ( 27W)
REPORT TYPE : A1SEX : MALE
UNIT: % PAGE : 1
________________________________________________________________________________________________________________________________________________________________________________________________
Group Name NO. of Body Weight THYMUS ADRENALS TESTES HEART LUNGSAnimals (g)
________________________________________________________________________________________________________________________________________________________________________________________________
Control 25 26.3± 1.8 0.211± 0.069 0.045± 0.009 0.995± 0.130 0.664± 0.053 0.608± 0.042
2 mg/m3 24 27.3± 1.9 0.196± 0.040 0.043± 0.011 0.933± 0.161 0.645± 0.051 0.654± 0.055*
8 mg/m3 25 27.8± 1.8* 0.193± 0.043 0.044± 0.011 0.953± 0.093 0.649± 0.076 0.645± 0.066
32 mg/m3 25 27.6± 2.0 0.201± 0.036 0.049± 0.014 0.971± 0.099 0.645± 0.058 0.696± 0.071**
________________________________________________________________________________________________________________________________________________________________________________________________
Significant difference ; * : P ≦ 0.05 ** : P ≦ 0.01 Test of Dunnett
________________________________________________________________________________________________________________________________________________________________________________________________
(HCL042) BAIS6

STUDY NO. : 0887 ORGAN WEIGHT:RELATIVE (SUMMARY)ANIMAL : Jic:CB6F1-Tg rasH2@Jcl SURVIVAL ANIMALS ( 27W)
REPORT TYPE : A1SEX : MALE
UNIT: % PAGE : 2
________________________________________________________________________________________________________________________________________________________________________________________________
Group Name NO. of KIDNEYS SPLEEN LIVER BRAINAnimals
________________________________________________________________________________________________________________________________________________________________________________________________
Control 25 2.068± 0.138 0.250± 0.057 4.442± 0.154 1.799± 0.106
2 mg/m3 24 2.074± 0.114 0.238± 0.039 4.566± 0.277 1.765± 0.115
8 mg/m3 25 2.063± 0.165 0.304± 0.295 4.661± 0.285** 1.715± 0.105
32 mg/m3 25 2.102± 0.172 0.375± 0.370 4.655± 0.324** 1.760± 0.121
________________________________________________________________________________________________________________________________________________________________________________________________
Significant difference ; * : P ≦ 0.05 ** : P ≦ 0.01 Test of Dunnett
________________________________________________________________________________________________________________________________________________________________________________________________
(HCL042) BAIS6

TABLE J2
ORGAN WEIGHT, RELATIVE : FEMALE
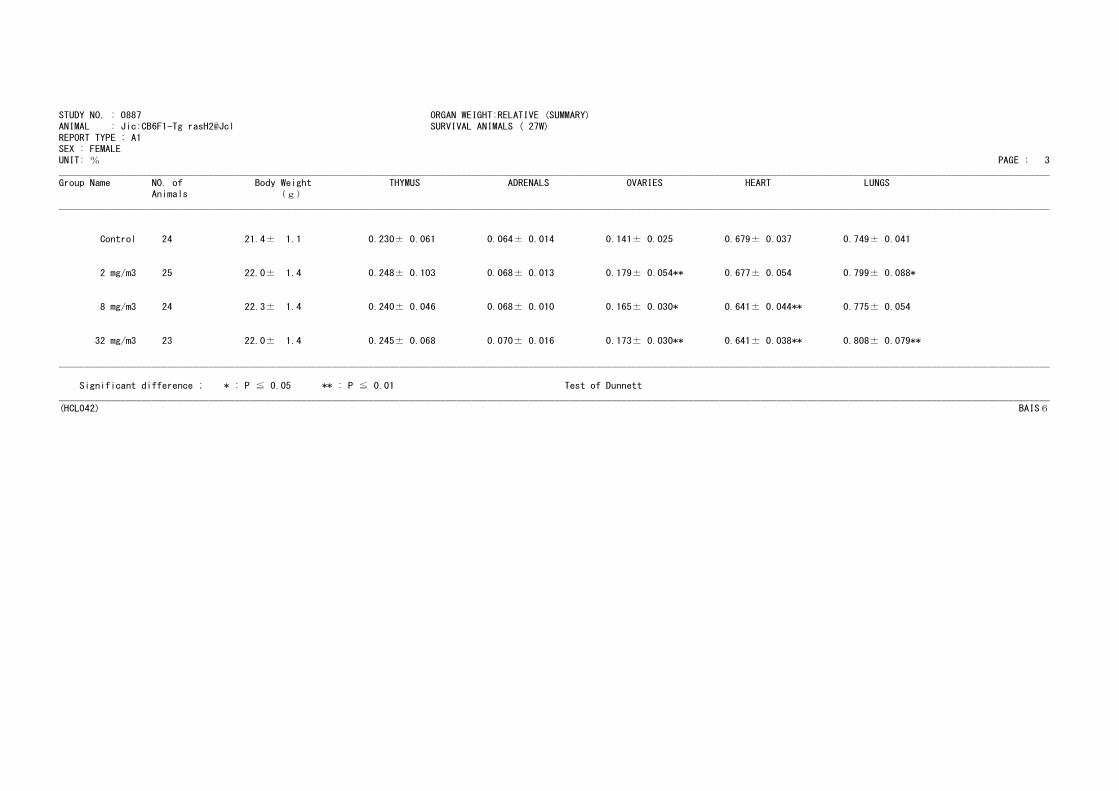
STUDY NO. : 0887 ORGAN WEIGHT:RELATIVE (SUMMARY)ANIMAL : Jic:CB6F1-Tg rasH2@Jcl SURVIVAL ANIMALS ( 27W)
REPORT TYPE : A1SEX : FEMALE
UNIT: % PAGE : 3
________________________________________________________________________________________________________________________________________________________________________________________________
Group Name NO. of Body Weight THYMUS ADRENALS OVARIES HEART LUNGSAnimals (g)
________________________________________________________________________________________________________________________________________________________________________________________________
Control 24 21.4± 1.1 0.230± 0.061 0.064± 0.014 0.141± 0.025 0.679± 0.037 0.749± 0.041
2 mg/m3 25 22.0± 1.4 0.248± 0.103 0.068± 0.013 0.179± 0.054** 0.677± 0.054 0.799± 0.088*
8 mg/m3 24 22.3± 1.4 0.240± 0.046 0.068± 0.010 0.165± 0.030* 0.641± 0.044** 0.775± 0.054
32 mg/m3 23 22.0± 1.4 0.245± 0.068 0.070± 0.016 0.173± 0.030** 0.641± 0.038** 0.808± 0.079**
________________________________________________________________________________________________________________________________________________________________________________________________
Significant difference ; * : P ≦ 0.05 ** : P ≦ 0.01 Test of Dunnett
________________________________________________________________________________________________________________________________________________________________________________________________
(HCL042) BAIS6
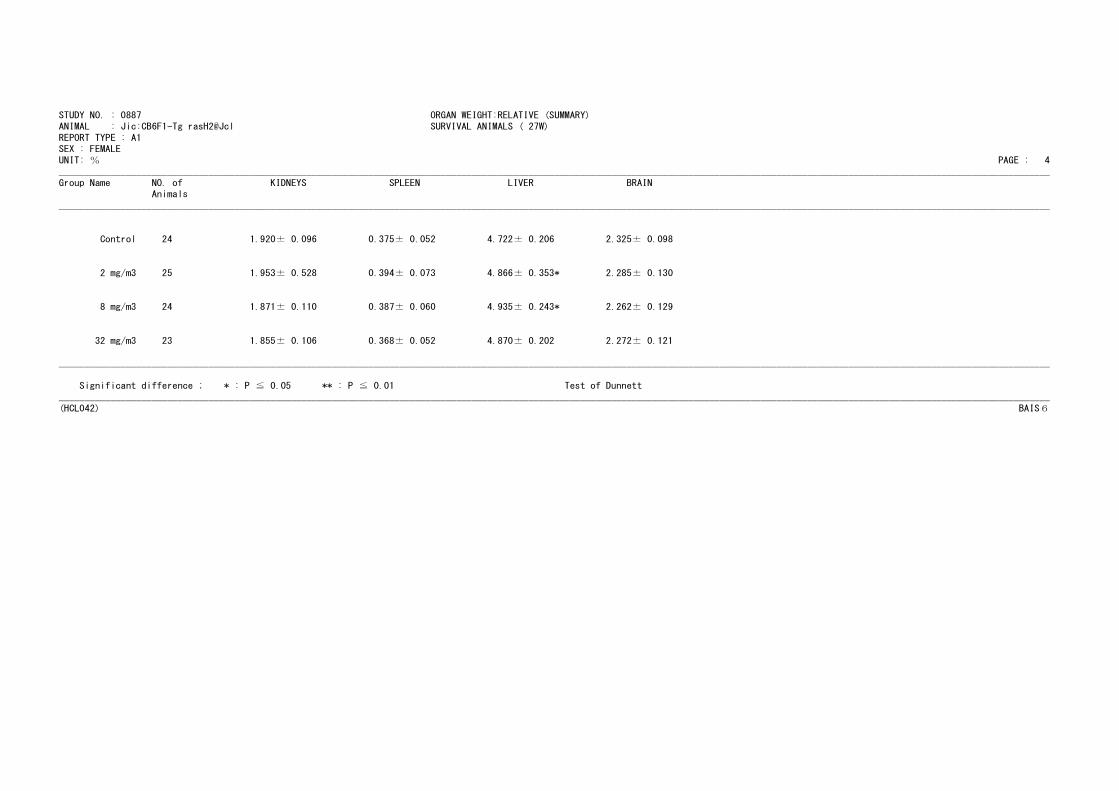
STUDY NO. : 0887 ORGAN WEIGHT:RELATIVE (SUMMARY)ANIMAL : Jic:CB6F1-Tg rasH2@Jcl SURVIVAL ANIMALS ( 27W)
REPORT TYPE : A1SEX : FEMALE
UNIT: % PAGE : 4
________________________________________________________________________________________________________________________________________________________________________________________________
Group Name NO. of KIDNEYS SPLEEN LIVER BRAINAnimals
________________________________________________________________________________________________________________________________________________________________________________________________
Control 24 1.920± 0.096 0.375± 0.052 4.722± 0.206 2.325± 0.098
2 mg/m3 25 1.953± 0.528 0.394± 0.073 4.866± 0.353* 2.285± 0.130
8 mg/m3 24 1.871± 0.110 0.387± 0.060 4.935± 0.243* 2.262± 0.129
32 mg/m3 23 1.855± 0.106 0.368± 0.052 4.870± 0.202 2.272± 0.121
________________________________________________________________________________________________________________________________________________________________________________________________
Significant difference ; * : P ≦ 0.05 ** : P ≦ 0.01 Test of Dunnett
________________________________________________________________________________________________________________________________________________________________________________________________
(HCL042) BAIS6
TABLE K1
HISTOPATHOLOGICAL FINDINGS :
NEOPLASTIC LESIONS : MALE
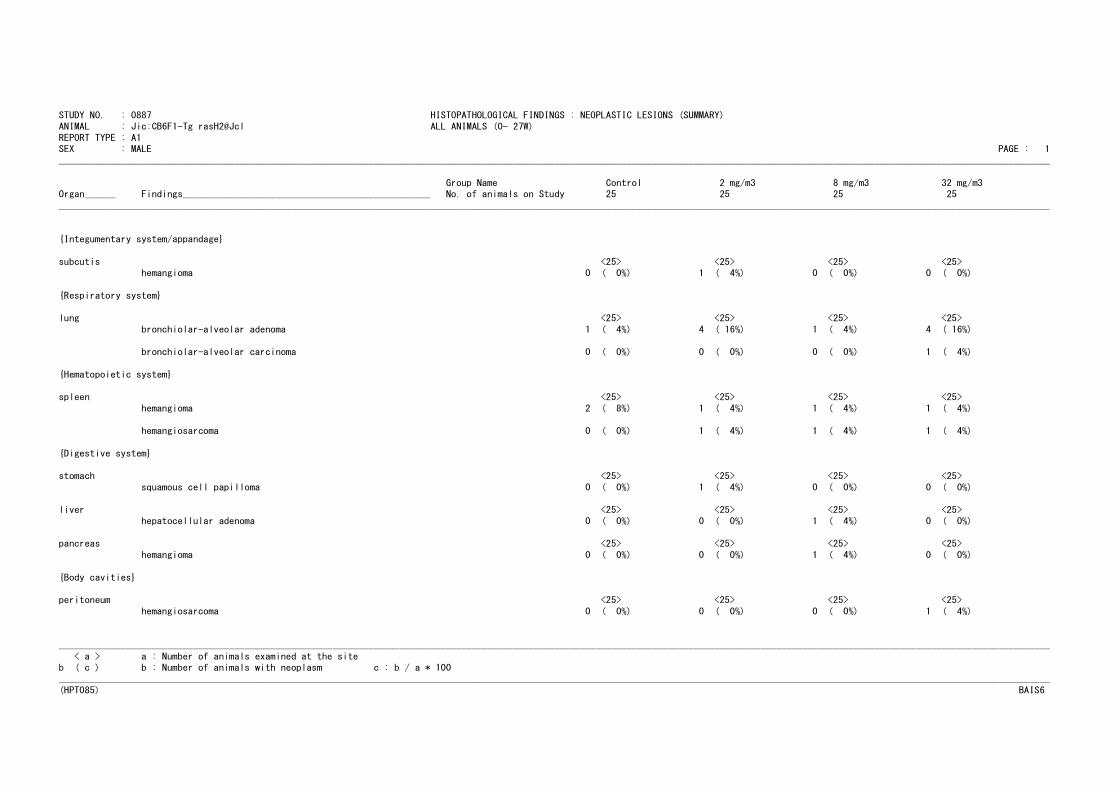
STUDY NO. : 0887 HISTOPATHOLOGICAL FINDINGS : NEOPLASTIC LESIONS (SUMMARY)ANIMAL : Jic:CB6F1-Tg rasH2@Jcl ALL ANIMALS (0- 27W)
REPORT TYPE : A1SEX : MALE PAGE : 1
________________________________________________________________________________________________________________________________________________________________________________________________
Group Name Control 2 mg/m3 8 mg/m3 32 mg/m3Organ______ Findings________________________________________________ No. of animals on Study 25 25 25 25________________________________________________________________________________________________________________________________________________________________________________________________
{Integumentary system/appandage}
subcutis <25> <25> <25> <25>hemangioma 0 ( 0%) 1 ( 4%) 0 ( 0%) 0 ( 0%)
{Respiratory system}
lung <25> <25> <25> <25>
bronchiolar-alveolar adenoma 1 ( 4%) 4 ( 16%) 1 ( 4%) 4 ( 16%)
bronchiolar-alveolar carcinoma 0 ( 0%) 0 ( 0%) 0 ( 0%) 1 ( 4%)
{Hematopoietic system}
spleen <25> <25> <25> <25>
hemangioma 2 ( 8%) 1 ( 4%) 1 ( 4%) 1 ( 4%)
hemangiosarcoma 0 ( 0%) 1 ( 4%) 1 ( 4%) 1 ( 4%)
{Digestive system}
stomach <25> <25> <25> <25>
squamous cell papilloma 0 ( 0%) 1 ( 4%) 0 ( 0%) 0 ( 0%)
liver <25> <25> <25> <25>hepatocellular adenoma 0 ( 0%) 0 ( 0%) 1 ( 4%) 0 ( 0%)
pancreas <25> <25> <25> <25>
hemangioma 0 ( 0%) 0 ( 0%) 1 ( 4%) 0 ( 0%)
{Body cavities}
peritoneum <25> <25> <25> <25>
hemangiosarcoma 0 ( 0%) 0 ( 0%) 0 ( 0%) 1 ( 4%)
________________________________________________________________________________________________________________________________________________________________________________________________
< a > a : Number of animals examined at the siteb ( c ) b : Number of animals with neoplasm c : b / a * 100________________________________________________________________________________________________________________________________________________________________________________________________
(HPT085) BAIS6
TABLE K2
HISTOPATHOLOGICAL FINDINGS :
NEOPLASTIC LESIONS : FEMALE
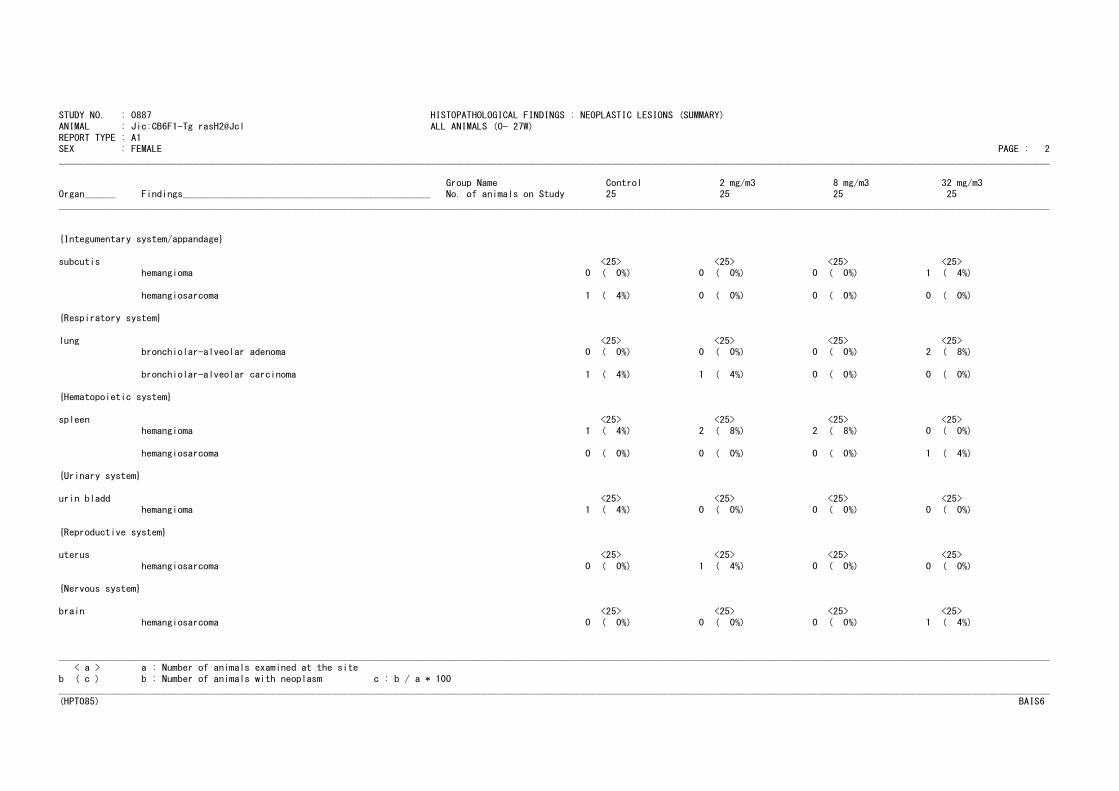
STUDY NO. : 0887 HISTOPATHOLOGICAL FINDINGS : NEOPLASTIC LESIONS (SUMMARY)ANIMAL : Jic:CB6F1-Tg rasH2@Jcl ALL ANIMALS (0- 27W)
REPORT TYPE : A1SEX : FEMALE PAGE : 2
________________________________________________________________________________________________________________________________________________________________________________________________
Group Name Control 2 mg/m3 8 mg/m3 32 mg/m3Organ______ Findings________________________________________________ No. of animals on Study 25 25 25 25________________________________________________________________________________________________________________________________________________________________________________________________
{Integumentary system/appandage}
subcutis <25> <25> <25> <25>hemangioma 0 ( 0%) 0 ( 0%) 0 ( 0%) 1 ( 4%)
hemangiosarcoma 1 ( 4%) 0 ( 0%) 0 ( 0%) 0 ( 0%)
{Respiratory system}
lung <25> <25> <25> <25>bronchiolar-alveolar adenoma 0 ( 0%) 0 ( 0%) 0 ( 0%) 2 ( 8%)
bronchiolar-alveolar carcinoma 1 ( 4%) 1 ( 4%) 0 ( 0%) 0 ( 0%)
{Hematopoietic system}
spleen <25> <25> <25> <25>hemangioma 1 ( 4%) 2 ( 8%) 2 ( 8%) 0 ( 0%)
hemangiosarcoma 0 ( 0%) 0 ( 0%) 0 ( 0%) 1 ( 4%)
{Urinary system}
urin bladd <25> <25> <25> <25>hemangioma 1 ( 4%) 0 ( 0%) 0 ( 0%) 0 ( 0%)
{Reproductive system}
uterus <25> <25> <25> <25>
hemangiosarcoma 0 ( 0%) 1 ( 4%) 0 ( 0%) 0 ( 0%)
{Nervous system}
brain <25> <25> <25> <25>hemangiosarcoma 0 ( 0%) 0 ( 0%) 0 ( 0%) 1 ( 4%)
________________________________________________________________________________________________________________________________________________________________________________________________< a > a : Number of animals examined at the site
b ( c ) b : Number of animals with neoplasm c : b / a * 100
________________________________________________________________________________________________________________________________________________________________________________________________(HPT085) BAIS6
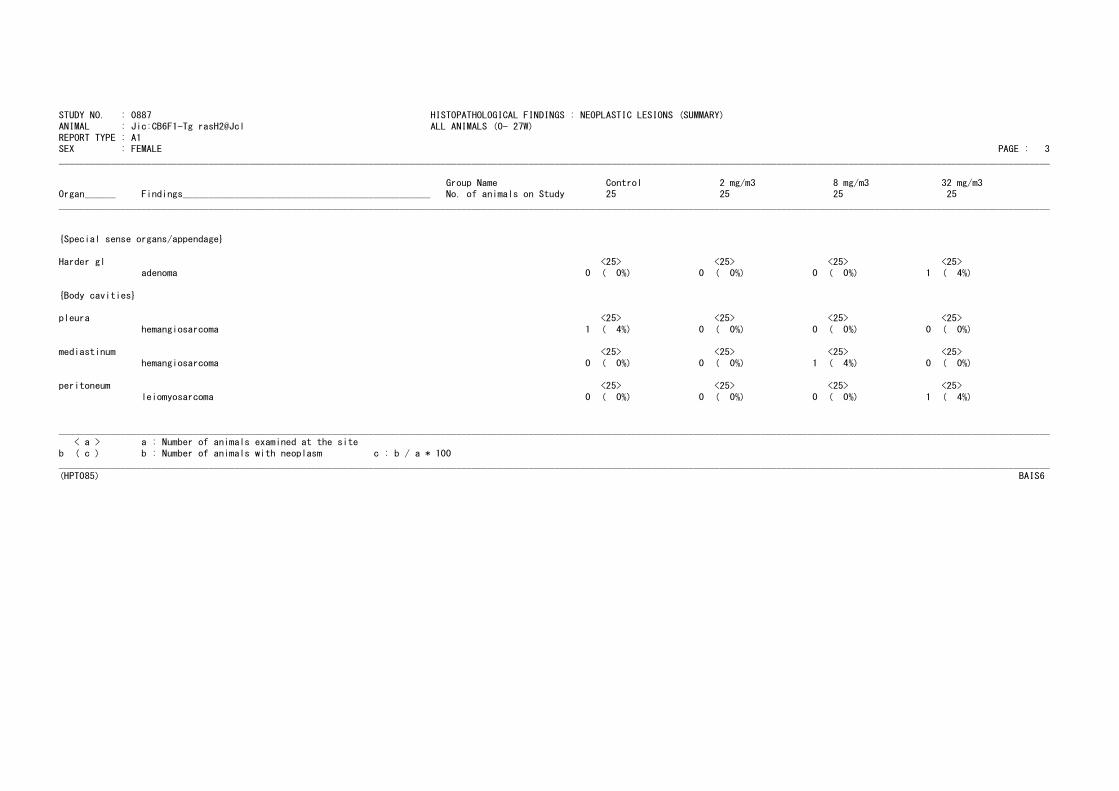
STUDY NO. : 0887 HISTOPATHOLOGICAL FINDINGS : NEOPLASTIC LESIONS (SUMMARY)ANIMAL : Jic:CB6F1-Tg rasH2@Jcl ALL ANIMALS (0- 27W)
REPORT TYPE : A1SEX : FEMALE PAGE : 3
________________________________________________________________________________________________________________________________________________________________________________________________
Group Name Control 2 mg/m3 8 mg/m3 32 mg/m3Organ______ Findings________________________________________________ No. of animals on Study 25 25 25 25________________________________________________________________________________________________________________________________________________________________________________________________
{Special sense organs/appendage}
Harder gl <25> <25> <25> <25>adenoma 0 ( 0%) 0 ( 0%) 0 ( 0%) 1 ( 4%)
{Body cavities}
pleura <25> <25> <25> <25>
hemangiosarcoma 1 ( 4%) 0 ( 0%) 0 ( 0%) 0 ( 0%)
mediastinum <25> <25> <25> <25>hemangiosarcoma 0 ( 0%) 0 ( 0%) 1 ( 4%) 0 ( 0%)
peritoneum <25> <25> <25> <25>
leiomyosarcoma 0 ( 0%) 0 ( 0%) 0 ( 0%) 1 ( 4%)
________________________________________________________________________________________________________________________________________________________________________________________________< a > a : Number of animals examined at the site
b ( c ) b : Number of animals with neoplasm c : b / a * 100________________________________________________________________________________________________________________________________________________________________________________________________
(HPT085) BAIS6
TABLE L1
NEOPLASTIC LESIONS-INCIDENCE AND
STATISTICAL ANALYSIS : MALE

STUDY No. : 0887 NEOPLASTIC LESIONS-INCIDENCE AND STATISTICAL ANALYSISANIMAL : Jic:CB6F1-Tg rasH2@Jcl
SEX : MALE PAGE : 1________________________________________________________________________________________________________________________________________________________________________________________________
Group Name Control 2 mg/m3 8 mg/m3 32 mg/m3
________________________________________________________________________________________________________________________________________________________________________________________________
SITE : lung
TUMOR : bronchiolar-alveolar adenomaTumor rate
Overall rates(a) 1/25( 4.0) 4/25( 16.0) 1/25( 4.0) 4/25( 16.0)
Adjusted rates(b) 4.00 16.00 4.00 16.00
Terminal rates(c) 1/25( 4.0) 3/24( 12.5) 1/25( 4.0) 4/25( 16.0)Statistical analysisPeto test
Standard method(d) P = ------Prevalence method(d) P = 0.1592
Combined analysis(d) P = ------
Cochran-Armitage test(e) P = 0.3082
Fisher Exact test(e) P = 0.1743 P = 0.7551 P = 0.1743________________________________________________________________________________________________________________________________________________________________________________________________
SITE : lungTUMOR : bronchiolar-alveolar adenoma,bronchiolar-alveolar carcinoma
Tumor rate
Overall rates(a) 1/25( 4.0) 4/25( 16.0) 1/25( 4.0) 5/25( 20.0)
Adjusted rates(b) 4.00 16.00 4.00 20.00Terminal rates(c) 1/25( 4.0) 3/24( 12.5) 1/25( 4.0) 5/25( 20.0)
Statistical analysis
Peto testStandard method(d) P = ------
Prevalence method(d) P = 0.0736
Combined analysis(d) P = ------
Cochran-Armitage test(e) P = 0.1296Fisher Exact test(e) P = 0.1743 P = 0.7551 P = 0.0947
________________________________________________________________________________________________________________________________________________________________________________________________
SITE : spleen
TUMOR : hemangioma
Tumor rate
Overall rates(a) 2/25( 8.0) 1/25( 4.0) 1/25( 4.0) 1/25( 4.0)Adjusted rates(b) 8.00 4.17 4.00 4.00Terminal rates(c) 2/25( 8.0) 1/24( 4.2) 1/25( 4.0) 1/25( 4.0)
Statistical analysisPeto test
Standard method(d) P = ------
Prevalence method(d) P = 0.6177
Combined analysis(d) P = ------Cochran-Armitage test(e) P = 0.7057Fisher Exact test(e) P = 0.5000 P = 0.5000 P = 0.5000
________________________________________________________________________________________________________________________________________________________________________________________________(HPT360A) BAIS6
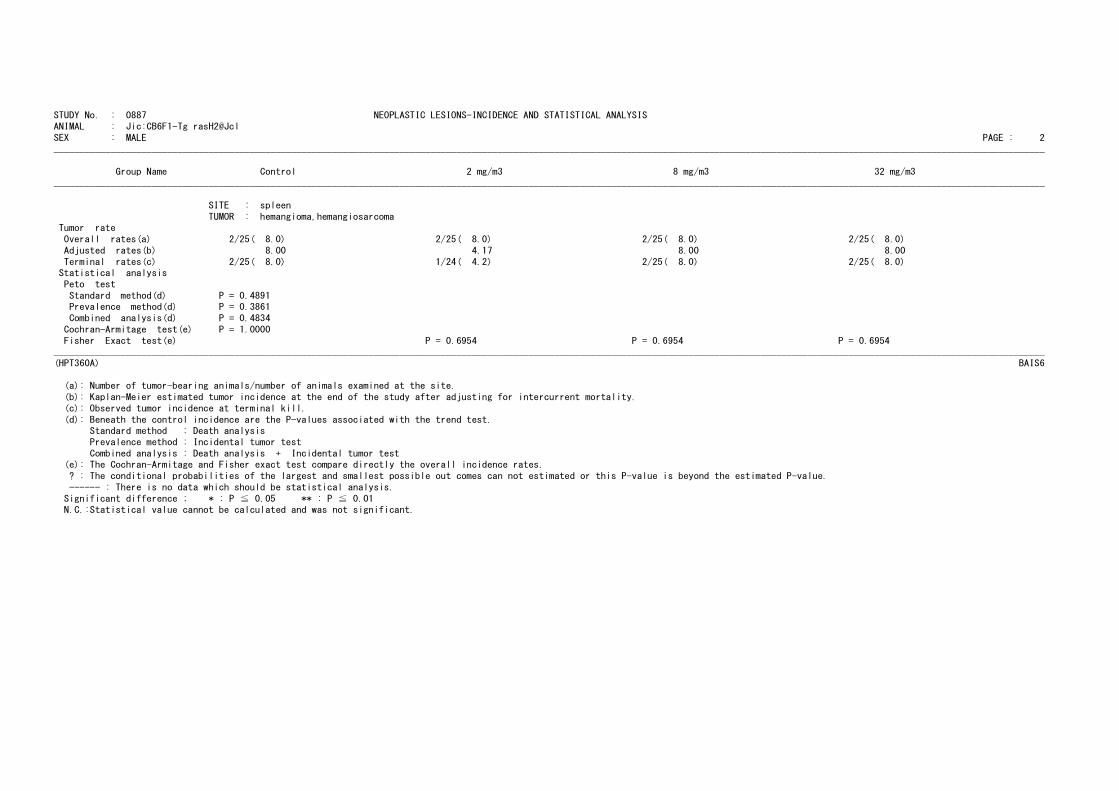
STUDY No. : 0887 NEOPLASTIC LESIONS-INCIDENCE AND STATISTICAL ANALYSISANIMAL : Jic:CB6F1-Tg rasH2@Jcl
SEX : MALE PAGE : 2________________________________________________________________________________________________________________________________________________________________________________________________
Group Name Control 2 mg/m3 8 mg/m3 32 mg/m3
________________________________________________________________________________________________________________________________________________________________________________________________
SITE : spleen
TUMOR : hemangioma,hemangiosarcomaTumor rate
Overall rates(a) 2/25( 8.0) 2/25( 8.0) 2/25( 8.0) 2/25( 8.0)
Adjusted rates(b) 8.00 4.17 8.00 8.00
Terminal rates(c) 2/25( 8.0) 1/24( 4.2) 2/25( 8.0) 2/25( 8.0)Statistical analysisPeto test
Standard method(d) P = 0.4891Prevalence method(d) P = 0.3861
Combined analysis(d) P = 0.4834
Cochran-Armitage test(e) P = 1.0000
Fisher Exact test(e) P = 0.6954 P = 0.6954 P = 0.6954________________________________________________________________________________________________________________________________________________________________________________________________(HPT360A) BAIS6
(a): Number of tumor-bearing animals/number of animals examined at the site.
(b): Kaplan-Meier estimated tumor incidence at the end of the study after adjusting for intercurrent mortality.
(c): Observed tumor incidence at terminal kill.
(d): Beneath the control incidence are the P-values associated with the trend test.Standard method : Death analysisPrevalence method : Incidental tumor test
Combined analysis : Death analysis + Incidental tumor test(e): The Cochran-Armitage and Fisher exact test compare directly the overall incidence rates.
? : The conditional probabilities of the largest and smallest possible out comes can not estimated or this P-value is beyond the estimated P-value.
------ : There is no data which should be statistical analysis.
Significant difference ; * : P ≦ 0.05 ** : P ≦ 0.01N.C.:Statistical value cannot be calculated and was not significant.
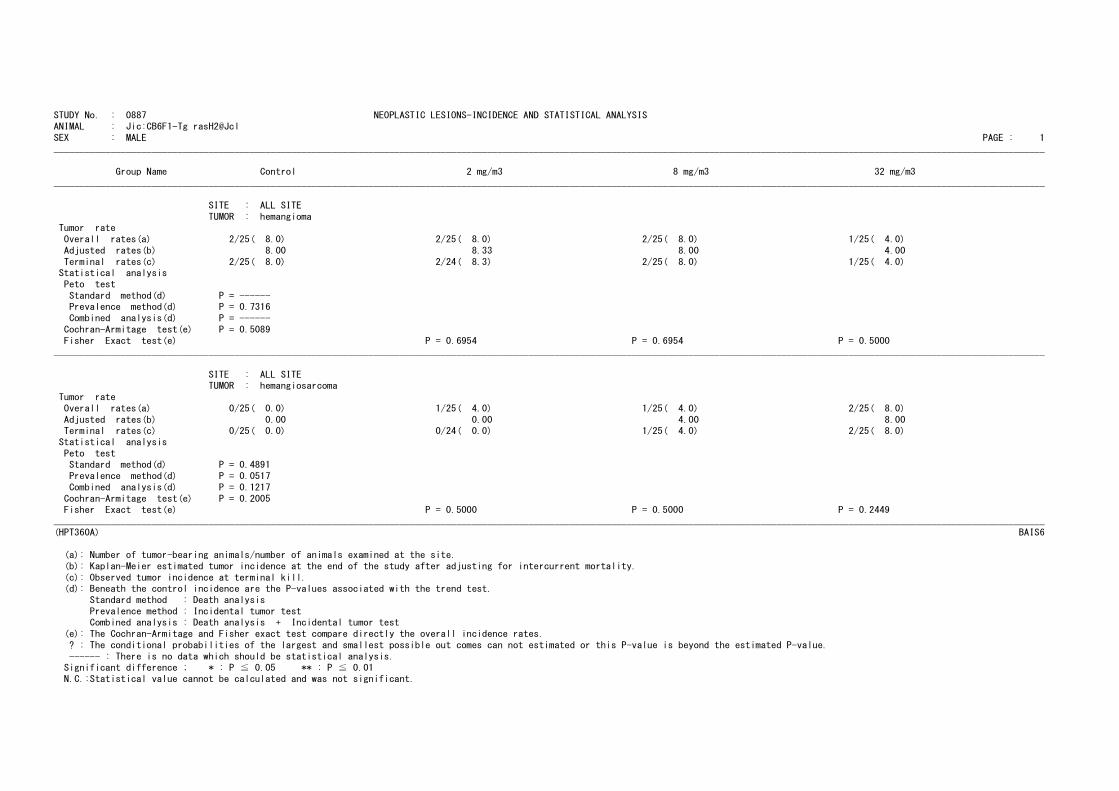
STUDY No. : 0887 NEOPLASTIC LESIONS-INCIDENCE AND STATISTICAL ANALYSISANIMAL : Jic:CB6F1-Tg rasH2@Jcl
SEX : MALE PAGE : 1________________________________________________________________________________________________________________________________________________________________________________________________
Group Name Control 2 mg/m3 8 mg/m3 32 mg/m3
________________________________________________________________________________________________________________________________________________________________________________________________
SITE : ALL SITE
TUMOR : hemangiomaTumor rate
Overall rates(a) 2/25( 8.0) 2/25( 8.0) 2/25( 8.0) 1/25( 4.0)
Adjusted rates(b) 8.00 8.33 8.00 4.00
Terminal rates(c) 2/25( 8.0) 2/24( 8.3) 2/25( 8.0) 1/25( 4.0)Statistical analysisPeto test
Standard method(d) P = ------Prevalence method(d) P = 0.7316
Combined analysis(d) P = ------
Cochran-Armitage test(e) P = 0.5089
Fisher Exact test(e) P = 0.6954 P = 0.6954 P = 0.5000________________________________________________________________________________________________________________________________________________________________________________________________
SITE : ALL SITETUMOR : hemangiosarcoma
Tumor rate
Overall rates(a) 0/25( 0.0) 1/25( 4.0) 1/25( 4.0) 2/25( 8.0)
Adjusted rates(b) 0.00 0.00 4.00 8.00Terminal rates(c) 0/25( 0.0) 0/24( 0.0) 1/25( 4.0) 2/25( 8.0)
Statistical analysis
Peto testStandard method(d) P = 0.4891
Prevalence method(d) P = 0.0517
Combined analysis(d) P = 0.1217
Cochran-Armitage test(e) P = 0.2005Fisher Exact test(e) P = 0.5000 P = 0.5000 P = 0.2449
________________________________________________________________________________________________________________________________________________________________________________________________
(HPT360A) BAIS6
(a): Number of tumor-bearing animals/number of animals examined at the site.
(b): Kaplan-Meier estimated tumor incidence at the end of the study after adjusting for intercurrent mortality.
(c): Observed tumor incidence at terminal kill.(d): Beneath the control incidence are the P-values associated with the trend test.
Standard method : Death analysis
Prevalence method : Incidental tumor testCombined analysis : Death analysis + Incidental tumor test
(e): The Cochran-Armitage and Fisher exact test compare directly the overall incidence rates.
? : The conditional probabilities of the largest and smallest possible out comes can not estimated or this P-value is beyond the estimated P-value.
------ : There is no data which should be statistical analysis.Significant difference ; * : P ≦ 0.05 ** : P ≦ 0.01N.C.:Statistical value cannot be calculated and was not significant.
TABLE L2
NEOPLASTIC LESIONS-INCIDENCE AND
STATISTICAL ANALYSIS : FEMALE
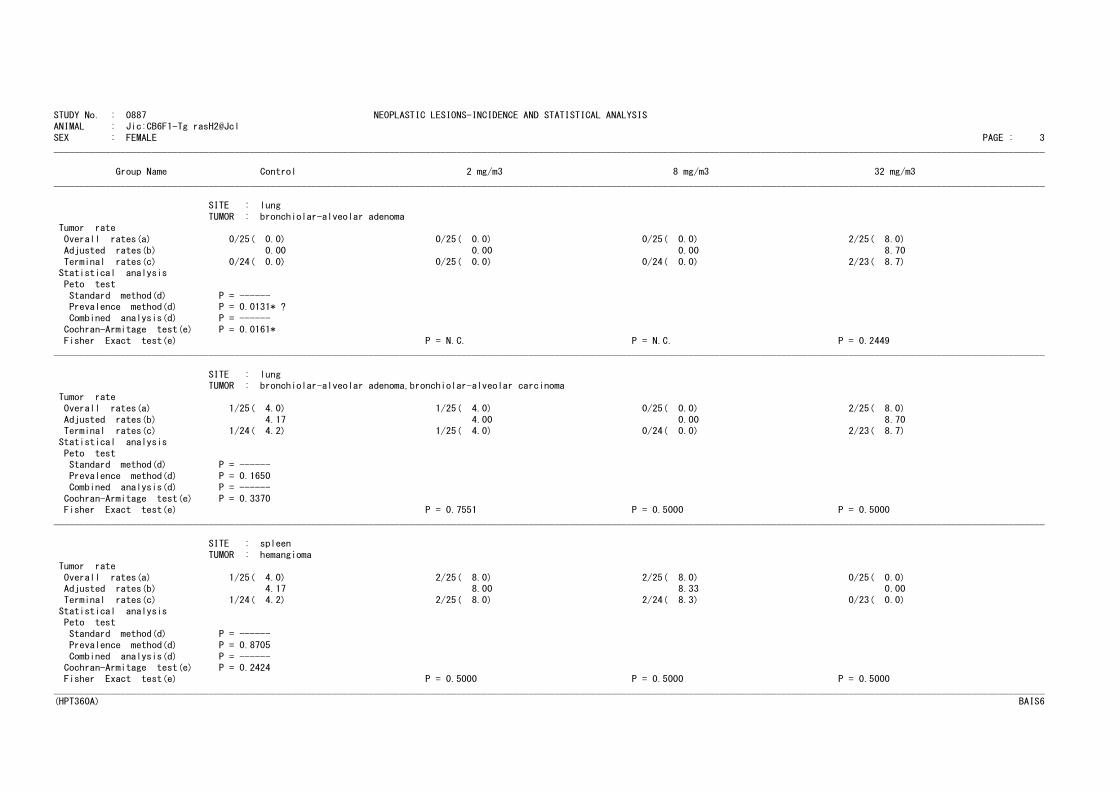
STUDY No. : 0887 NEOPLASTIC LESIONS-INCIDENCE AND STATISTICAL ANALYSISANIMAL : Jic:CB6F1-Tg rasH2@Jcl
SEX : FEMALE PAGE : 3________________________________________________________________________________________________________________________________________________________________________________________________
Group Name Control 2 mg/m3 8 mg/m3 32 mg/m3
________________________________________________________________________________________________________________________________________________________________________________________________
SITE : lung
TUMOR : bronchiolar-alveolar adenomaTumor rate
Overall rates(a) 0/25( 0.0) 0/25( 0.0) 0/25( 0.0) 2/25( 8.0)
Adjusted rates(b) 0.00 0.00 0.00 8.70
Terminal rates(c) 0/24( 0.0) 0/25( 0.0) 0/24( 0.0) 2/23( 8.7)Statistical analysisPeto test
Standard method(d) P = ------Prevalence method(d) P = 0.0131* ?
Combined analysis(d) P = ------
Cochran-Armitage test(e) P = 0.0161*
Fisher Exact test(e) P = N.C. P = N.C. P = 0.2449________________________________________________________________________________________________________________________________________________________________________________________________
SITE : lungTUMOR : bronchiolar-alveolar adenoma,bronchiolar-alveolar carcinoma
Tumor rate
Overall rates(a) 1/25( 4.0) 1/25( 4.0) 0/25( 0.0) 2/25( 8.0)
Adjusted rates(b) 4.17 4.00 0.00 8.70Terminal rates(c) 1/24( 4.2) 1/25( 4.0) 0/24( 0.0) 2/23( 8.7)
Statistical analysis
Peto testStandard method(d) P = ------
Prevalence method(d) P = 0.1650
Combined analysis(d) P = ------
Cochran-Armitage test(e) P = 0.3370Fisher Exact test(e) P = 0.7551 P = 0.5000 P = 0.5000
________________________________________________________________________________________________________________________________________________________________________________________________
SITE : spleen
TUMOR : hemangioma
Tumor rate
Overall rates(a) 1/25( 4.0) 2/25( 8.0) 2/25( 8.0) 0/25( 0.0)Adjusted rates(b) 4.17 8.00 8.33 0.00Terminal rates(c) 1/24( 4.2) 2/25( 8.0) 2/24( 8.3) 0/23( 0.0)
Statistical analysisPeto test
Standard method(d) P = ------
Prevalence method(d) P = 0.8705
Combined analysis(d) P = ------Cochran-Armitage test(e) P = 0.2424Fisher Exact test(e) P = 0.5000 P = 0.5000 P = 0.5000
________________________________________________________________________________________________________________________________________________________________________________________________(HPT360A) BAIS6

STUDY No. : 0887 NEOPLASTIC LESIONS-INCIDENCE AND STATISTICAL ANALYSISANIMAL : Jic:CB6F1-Tg rasH2@Jcl
SEX : FEMALE PAGE : 4________________________________________________________________________________________________________________________________________________________________________________________________
Group Name Control 2 mg/m3 8 mg/m3 32 mg/m3
________________________________________________________________________________________________________________________________________________________________________________________________
SITE : spleen
TUMOR : hemangioma,hemangiosarcomaTumor rate
Overall rates(a) 1/25( 4.0) 2/25( 8.0) 2/25( 8.0) 1/25( 4.0)
Adjusted rates(b) 4.17 8.00 8.33 0.00
Terminal rates(c) 1/24( 4.2) 2/25( 8.0) 2/24( 8.3) 0/23( 0.0)Statistical analysisPeto test
Standard method(d) P = 0.1578Prevalence method(d) P = 0.8705
Combined analysis(d) P = 0.5894
Cochran-Armitage test(e) P = 0.7166
Fisher Exact test(e) P = 0.5000 P = 0.5000 P = 0.7551________________________________________________________________________________________________________________________________________________________________________________________________(HPT360A) BAIS6
(a): Number of tumor-bearing animals/number of animals examined at the site.
(b): Kaplan-Meier estimated tumor incidence at the end of the study after adjusting for intercurrent mortality.
(c): Observed tumor incidence at terminal kill.
(d): Beneath the control incidence are the P-values associated with the trend test.Standard method : Death analysisPrevalence method : Incidental tumor test
Combined analysis : Death analysis + Incidental tumor test(e): The Cochran-Armitage and Fisher exact test compare directly the overall incidence rates.
? : The conditional probabilities of the largest and smallest possible out comes can not estimated or this P-value is beyond the estimated P-value.
------ : There is no data which should be statistical analysis.
Significant difference ; * : P ≦ 0.05 ** : P ≦ 0.01N.C.:Statistical value cannot be calculated and was not significant.
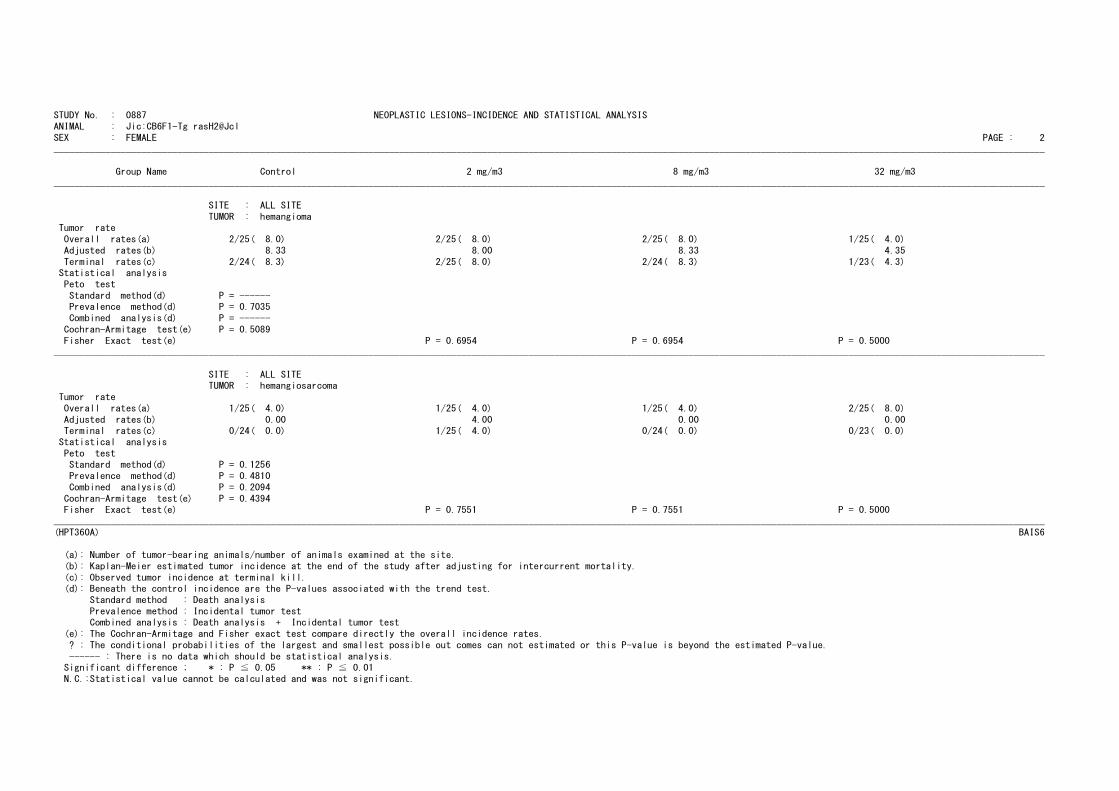
STUDY No. : 0887 NEOPLASTIC LESIONS-INCIDENCE AND STATISTICAL ANALYSISANIMAL : Jic:CB6F1-Tg rasH2@Jcl
SEX : FEMALE PAGE : 2________________________________________________________________________________________________________________________________________________________________________________________________
Group Name Control 2 mg/m3 8 mg/m3 32 mg/m3
________________________________________________________________________________________________________________________________________________________________________________________________
SITE : ALL SITE
TUMOR : hemangiomaTumor rate
Overall rates(a) 2/25( 8.0) 2/25( 8.0) 2/25( 8.0) 1/25( 4.0)
Adjusted rates(b) 8.33 8.00 8.33 4.35
Terminal rates(c) 2/24( 8.3) 2/25( 8.0) 2/24( 8.3) 1/23( 4.3)Statistical analysisPeto test
Standard method(d) P = ------Prevalence method(d) P = 0.7035
Combined analysis(d) P = ------
Cochran-Armitage test(e) P = 0.5089
Fisher Exact test(e) P = 0.6954 P = 0.6954 P = 0.5000________________________________________________________________________________________________________________________________________________________________________________________________
SITE : ALL SITETUMOR : hemangiosarcoma
Tumor rate
Overall rates(a) 1/25( 4.0) 1/25( 4.0) 1/25( 4.0) 2/25( 8.0)
Adjusted rates(b) 0.00 4.00 0.00 0.00Terminal rates(c) 0/24( 0.0) 1/25( 4.0) 0/24( 0.0) 0/23( 0.0)
Statistical analysis
Peto testStandard method(d) P = 0.1256
Prevalence method(d) P = 0.4810
Combined analysis(d) P = 0.2094
Cochran-Armitage test(e) P = 0.4394Fisher Exact test(e) P = 0.7551 P = 0.7551 P = 0.5000
________________________________________________________________________________________________________________________________________________________________________________________________
(HPT360A) BAIS6
(a): Number of tumor-bearing animals/number of animals examined at the site.
(b): Kaplan-Meier estimated tumor incidence at the end of the study after adjusting for intercurrent mortality.
(c): Observed tumor incidence at terminal kill.(d): Beneath the control incidence are the P-values associated with the trend test.
Standard method : Death analysis
Prevalence method : Incidental tumor testCombined analysis : Death analysis + Incidental tumor test
(e): The Cochran-Armitage and Fisher exact test compare directly the overall incidence rates.
? : The conditional probabilities of the largest and smallest possible out comes can not estimated or this P-value is beyond the estimated P-value.
------ : There is no data which should be statistical analysis.Significant difference ; * : P ≦ 0.05 ** : P ≦ 0.01N.C.:Statistical value cannot be calculated and was not significant.
TABLE M1
NUMBER OF ANIMALS WITH TUMORS AND
NUMBER OF TUMORS-TIME RELATED : MALE
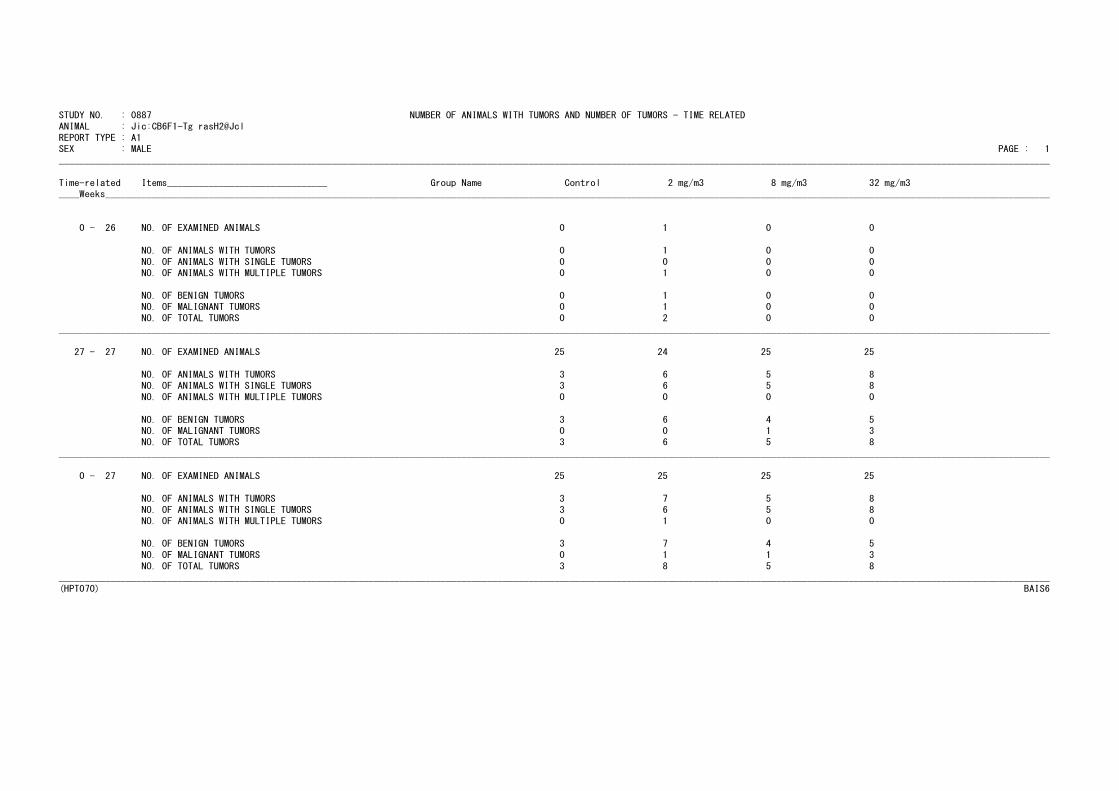
STUDY NO. : 0887 NUMBER OF ANIMALS WITH TUMORS AND NUMBER OF TUMORS - TIME RELATEDANIMAL : Jic:CB6F1-Tg rasH2@Jcl
REPORT TYPE : A1SEX : MALE PAGE : 1
________________________________________________________________________________________________________________________________________________________________________________________________
Time-related Items_______________________________ Group Name Control 2 mg/m3 8 mg/m3 32 mg/m3____Weeks_______________________________________________________________________________________________________________________________________________________________________________________
0 - 26 NO. OF EXAMINED ANIMALS 0 1 0 0
NO. OF ANIMALS WITH TUMORS 0 1 0 0
NO. OF ANIMALS WITH SINGLE TUMORS 0 0 0 0NO. OF ANIMALS WITH MULTIPLE TUMORS 0 1 0 0
NO. OF BENIGN TUMORS 0 1 0 0NO. OF MALIGNANT TUMORS 0 1 0 0
NO. OF TOTAL TUMORS 0 2 0 0
________________________________________________________________________________________________________________________________________________________________________________________________
27 - 27 NO. OF EXAMINED ANIMALS 25 24 25 25
NO. OF ANIMALS WITH TUMORS 3 6 5 8NO. OF ANIMALS WITH SINGLE TUMORS 3 6 5 8
NO. OF ANIMALS WITH MULTIPLE TUMORS 0 0 0 0
NO. OF BENIGN TUMORS 3 6 4 5NO. OF MALIGNANT TUMORS 0 0 1 3NO. OF TOTAL TUMORS 3 6 5 8
________________________________________________________________________________________________________________________________________________________________________________________________
0 - 27 NO. OF EXAMINED ANIMALS 25 25 25 25
NO. OF ANIMALS WITH TUMORS 3 7 5 8NO. OF ANIMALS WITH SINGLE TUMORS 3 6 5 8NO. OF ANIMALS WITH MULTIPLE TUMORS 0 1 0 0
NO. OF BENIGN TUMORS 3 7 4 5
NO. OF MALIGNANT TUMORS 0 1 1 3
NO. OF TOTAL TUMORS 3 8 5 8
________________________________________________________________________________________________________________________________________________________________________________________________(HPT070) BAIS6
TABLE M2
NUMBER OF ANIMALS WITH TUMORS AND
NUMBER OF TUMORS-TIME RELATED : FEMALE

STUDY NO. : 0887 NUMBER OF ANIMALS WITH TUMORS AND NUMBER OF TUMORS - TIME RELATEDANIMAL : Jic:CB6F1-Tg rasH2@Jcl
REPORT TYPE : A1SEX : FEMALE PAGE : 2
________________________________________________________________________________________________________________________________________________________________________________________________
Time-related Items_______________________________ Group Name Control 2 mg/m3 8 mg/m3 32 mg/m3____Weeks_______________________________________________________________________________________________________________________________________________________________________________________
0 - 26 NO. OF EXAMINED ANIMALS 1 0 1 2
NO. OF ANIMALS WITH TUMORS 1 0 1 2
NO. OF ANIMALS WITH SINGLE TUMORS 0 0 1 2NO. OF ANIMALS WITH MULTIPLE TUMORS 1 0 0 0
NO. OF BENIGN TUMORS 0 0 0 0NO. OF MALIGNANT TUMORS 2 0 1 2
NO. OF TOTAL TUMORS 2 0 1 2
________________________________________________________________________________________________________________________________________________________________________________________________
27 - 27 NO. OF EXAMINED ANIMALS 24 25 24 23
NO. OF ANIMALS WITH TUMORS 3 4 2 5NO. OF ANIMALS WITH SINGLE TUMORS 3 4 2 5
NO. OF ANIMALS WITH MULTIPLE TUMORS 0 0 0 0
NO. OF BENIGN TUMORS 2 2 2 4NO. OF MALIGNANT TUMORS 1 2 0 1NO. OF TOTAL TUMORS 3 4 2 5
________________________________________________________________________________________________________________________________________________________________________________________________
0 - 27 NO. OF EXAMINED ANIMALS 25 25 25 25
NO. OF ANIMALS WITH TUMORS 4 4 3 7NO. OF ANIMALS WITH SINGLE TUMORS 3 4 3 7NO. OF ANIMALS WITH MULTIPLE TUMORS 1 0 0 0
NO. OF BENIGN TUMORS 2 2 2 4
NO. OF MALIGNANT TUMORS 3 2 1 3
NO. OF TOTAL TUMORS 5 4 3 7
________________________________________________________________________________________________________________________________________________________________________________________________(HPT070) BAIS6
TABLE N
HISTOPATHOLOGICAL FINDINGS :
METASTASIS OF TUMOR : FEMALE
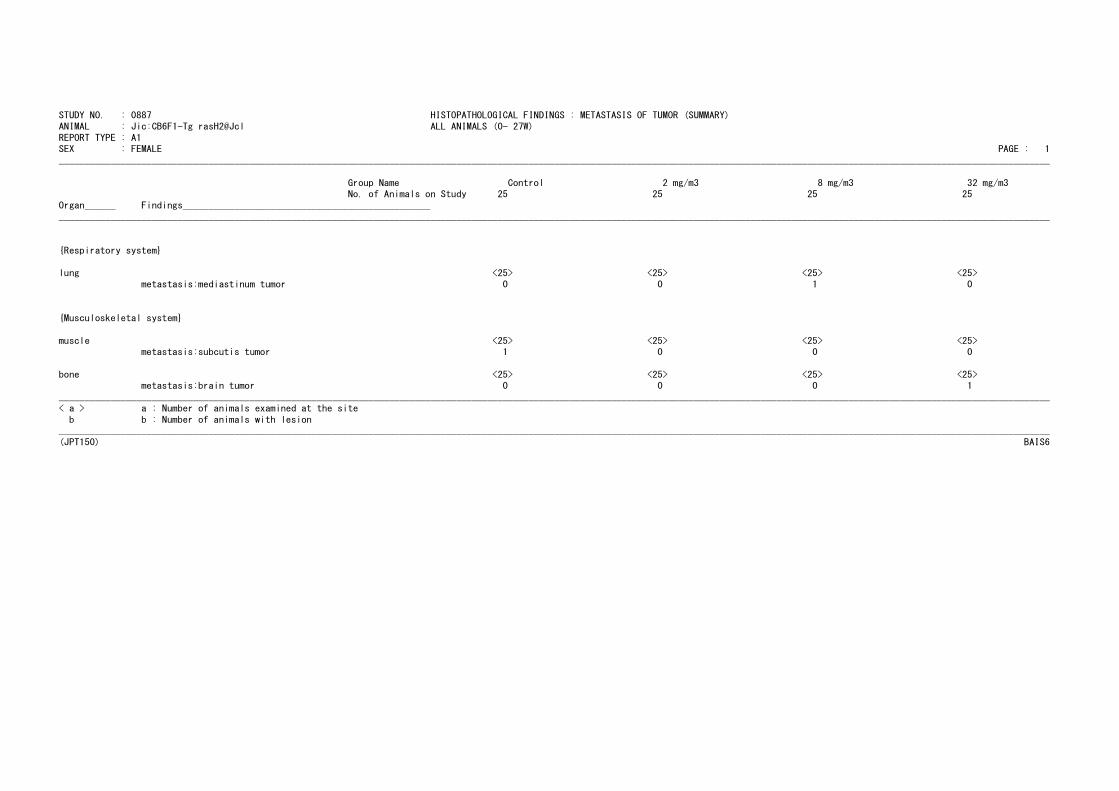
STUDY NO. : 0887 HISTOPATHOLOGICAL FINDINGS : METASTASIS OF TUMOR (SUMMARY)ANIMAL : Jic:CB6F1-Tg rasH2@Jcl ALL ANIMALS (0- 27W)
REPORT TYPE : A1SEX : FEMALE PAGE : 1
________________________________________________________________________________________________________________________________________________________________________________________________
Group Name Control 2 mg/m3 8 mg/m3 32 mg/m3No. of Animals on Study 25 25 25 25
Organ______ Findings________________________________________________
________________________________________________________________________________________________________________________________________________________________________________________________
{Respiratory system}
lung <25> <25> <25> <25>metastasis:mediastinum tumor 0 0 1 0
{Musculoskeletal system}
muscle <25> <25> <25> <25>metastasis:subcutis tumor 1 0 0 0
bone <25> <25> <25> <25>metastasis:brain tumor 0 0 0 1
________________________________________________________________________________________________________________________________________________________________________________________________
< a > a : Number of animals examined at the site
b b : Number of animals with lesion________________________________________________________________________________________________________________________________________________________________________________________________(JPT150) BAIS6
TABLE O1
HISTOPATHOLOGICAL FINDINGS :
NON-NEOPLASTIC LESIONS : MALE

STUDY NO. : 0887 HISTOPATHOLOGICAL FINDINGS :NON-NEOPLASTIC LESIONS (SUMMARY)
ANIMAL : Jic:CB6F1-Tg rasH2@Jcl ALL ANIMALS (0- 27W)REPORT TYPE : A1
SEX : MALE PAGE : 1________________________________________________________________________________________________________________________________________________________________________________________________
Group Name Control 2 mg/m3 8 mg/m3 32 mg/m3
No. of Animals on Study 25 25 25 25Grade 1+ 2+ 3+ 4+ 1+ 2+ 3+ 4+ 1+ 2+ 3+ 4+ 1+ 2+ 3+ 4+
Organ______ Findings________________________________________________ (%) (%) (%) (%) (%) (%) (%) (%) (%) (%) (%) (%) (%) (%) (%) (%)
________________________________________________________________________________________________________________________________________________________________________________________________
{Respiratory system}
nasal cavit <25> <25> <25> <25>exudate 0 0 0 0 0 0 0 0 1 0 0 0 3 0 0 0
( 0) ( 0) ( 0) ( 0) ( 0) ( 0) ( 0) ( 0) ( 4) ( 0) ( 0) ( 0) ( 12) ( 0) ( 0) ( 0)
eosinophilic change:olfactory epithelium 13 0 0 0 9 0 0 0 18 0 0 0 15 0 0 0
( 52) ( 0) ( 0) ( 0) ( 36) ( 0) ( 0) ( 0) ( 72) ( 0) ( 0) ( 0) ( 60) ( 0) ( 0) ( 0)
eosinophilic change:respiratory epithelium 19 0 0 0 13 0 0 0 23 0 0 0 23 0 0 0( 76) ( 0) ( 0) ( 0) ( 52) ( 0) ( 0) ( 0) ( 92) ( 0) ( 0) ( 0) ( 92) ( 0) ( 0) ( 0)
respiratory metaplasia:gland 0 0 0 0 0 0 0 0 0 0 0 0 0 0 1 0( 0) ( 0) ( 0) ( 0) ( 0) ( 0) ( 0) ( 0) ( 0) ( 0) ( 0) ( 0) ( 0) ( 0) ( 4) ( 0)
respiratory metaplasia:nasal gland 25 0 0 0 15 0 0 0 ** 21 0 0 0 24 0 0 0
(100) ( 0) ( 0) ( 0) ( 60) ( 0) ( 0) ( 0) ( 84) ( 0) ( 0) ( 0) ( 96) ( 0) ( 0) ( 0)
lung <25> <25> <25> <25>inflammatory cell infiltration:focal 0 0 0 0 0 0 0 0 0 0 0 0 25 0 0 0 **
( 0) ( 0) ( 0) ( 0) ( 0) ( 0) ( 0) ( 0) ( 0) ( 0) ( 0) ( 0) (100) ( 0) ( 0) ( 0)
deposit of particle 0 0 0 0 25 0 0 0 ** 0 25 0 0 ** 0 0 25 0 **
( 0) ( 0) ( 0) ( 0) (100) ( 0) ( 0) ( 0) ( 0) (100) ( 0) ( 0) ( 0) ( 0) (100) ( 0)
{Hematopoietic system}
lymph node <25> <25> <25> <25>
deposit of particle:mediastinum 0 0 0 0 0 0 0 0 0 0 0 0 0 13 0 0 **( 0) ( 0) ( 0) ( 0) ( 0) ( 0) ( 0) ( 0) ( 0) ( 0) ( 0) ( 0) ( 0) ( 52) ( 0) ( 0)
________________________________________________________________________________________________________________________________________________________________________________________________Grade 1+ : Slight 2+ : Moderate 3+ : Marked 4+ : Severe
< a > a : Number of animals examined at the site
b b : Number of animals with lesion
( c ) c : b / a * 100Significant difference ; * : P ≦ 0.05 ** : P ≦ 0.01 Test of Chi Square________________________________________________________________________________________________________________________________________________________________________________________________
(HPT150) BAIS6
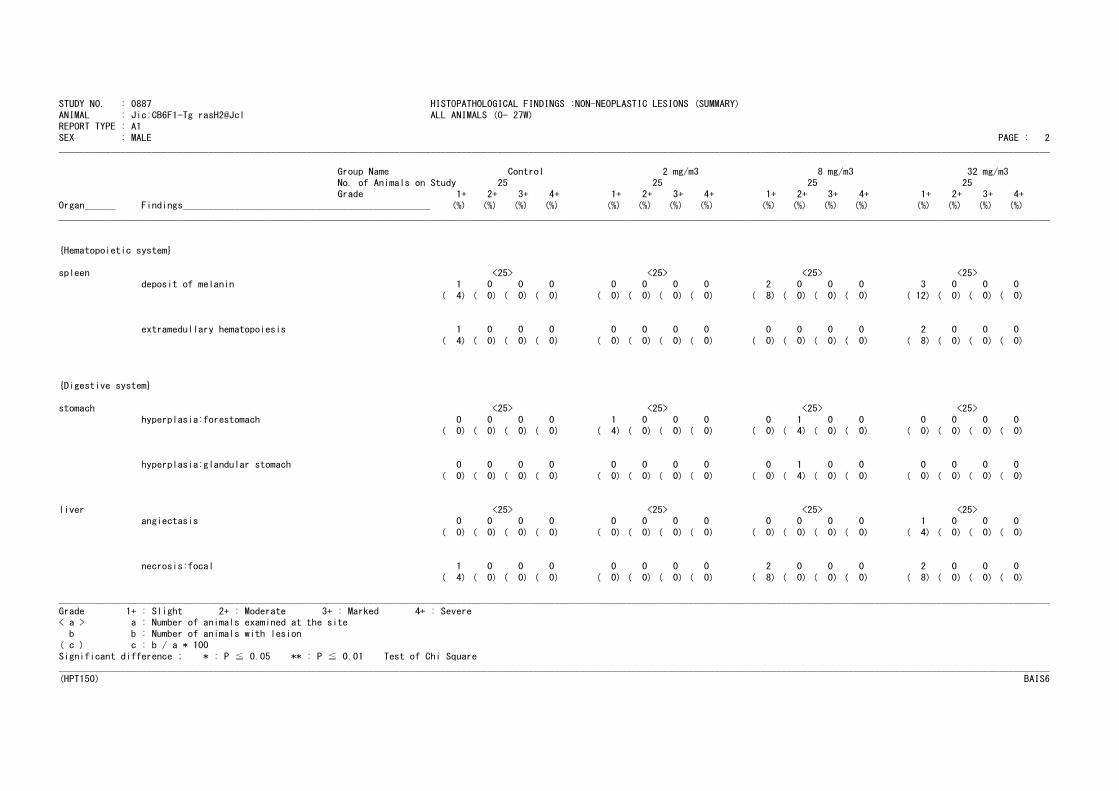
STUDY NO. : 0887 HISTOPATHOLOGICAL FINDINGS :NON-NEOPLASTIC LESIONS (SUMMARY)
ANIMAL : Jic:CB6F1-Tg rasH2@Jcl ALL ANIMALS (0- 27W)REPORT TYPE : A1
SEX : MALE PAGE : 2________________________________________________________________________________________________________________________________________________________________________________________________
Group Name Control 2 mg/m3 8 mg/m3 32 mg/m3
No. of Animals on Study 25 25 25 25Grade 1+ 2+ 3+ 4+ 1+ 2+ 3+ 4+ 1+ 2+ 3+ 4+ 1+ 2+ 3+ 4+
Organ______ Findings________________________________________________ (%) (%) (%) (%) (%) (%) (%) (%) (%) (%) (%) (%) (%) (%) (%) (%)
________________________________________________________________________________________________________________________________________________________________________________________________
{Hematopoietic system}
spleen <25> <25> <25> <25>deposit of melanin 1 0 0 0 0 0 0 0 2 0 0 0 3 0 0 0
( 4) ( 0) ( 0) ( 0) ( 0) ( 0) ( 0) ( 0) ( 8) ( 0) ( 0) ( 0) ( 12) ( 0) ( 0) ( 0)
extramedullary hematopoiesis 1 0 0 0 0 0 0 0 0 0 0 0 2 0 0 0
( 4) ( 0) ( 0) ( 0) ( 0) ( 0) ( 0) ( 0) ( 0) ( 0) ( 0) ( 0) ( 8) ( 0) ( 0) ( 0)
{Digestive system}
stomach <25> <25> <25> <25>
hyperplasia:forestomach 0 0 0 0 1 0 0 0 0 1 0 0 0 0 0 0( 0) ( 0) ( 0) ( 0) ( 4) ( 0) ( 0) ( 0) ( 0) ( 4) ( 0) ( 0) ( 0) ( 0) ( 0) ( 0)
hyperplasia:glandular stomach 0 0 0 0 0 0 0 0 0 1 0 0 0 0 0 0
( 0) ( 0) ( 0) ( 0) ( 0) ( 0) ( 0) ( 0) ( 0) ( 4) ( 0) ( 0) ( 0) ( 0) ( 0) ( 0)
liver <25> <25> <25> <25>angiectasis 0 0 0 0 0 0 0 0 0 0 0 0 1 0 0 0
( 0) ( 0) ( 0) ( 0) ( 0) ( 0) ( 0) ( 0) ( 0) ( 0) ( 0) ( 0) ( 4) ( 0) ( 0) ( 0)
necrosis:focal 1 0 0 0 0 0 0 0 2 0 0 0 2 0 0 0
( 4) ( 0) ( 0) ( 0) ( 0) ( 0) ( 0) ( 0) ( 8) ( 0) ( 0) ( 0) ( 8) ( 0) ( 0) ( 0)
________________________________________________________________________________________________________________________________________________________________________________________________
Grade 1+ : Slight 2+ : Moderate 3+ : Marked 4+ : Severe< a > a : Number of animals examined at the site
b b : Number of animals with lesion
( c ) c : b / a * 100
Significant difference ; * : P ≦ 0.05 ** : P ≦ 0.01 Test of Chi Square________________________________________________________________________________________________________________________________________________________________________________________________(HPT150) BAIS6
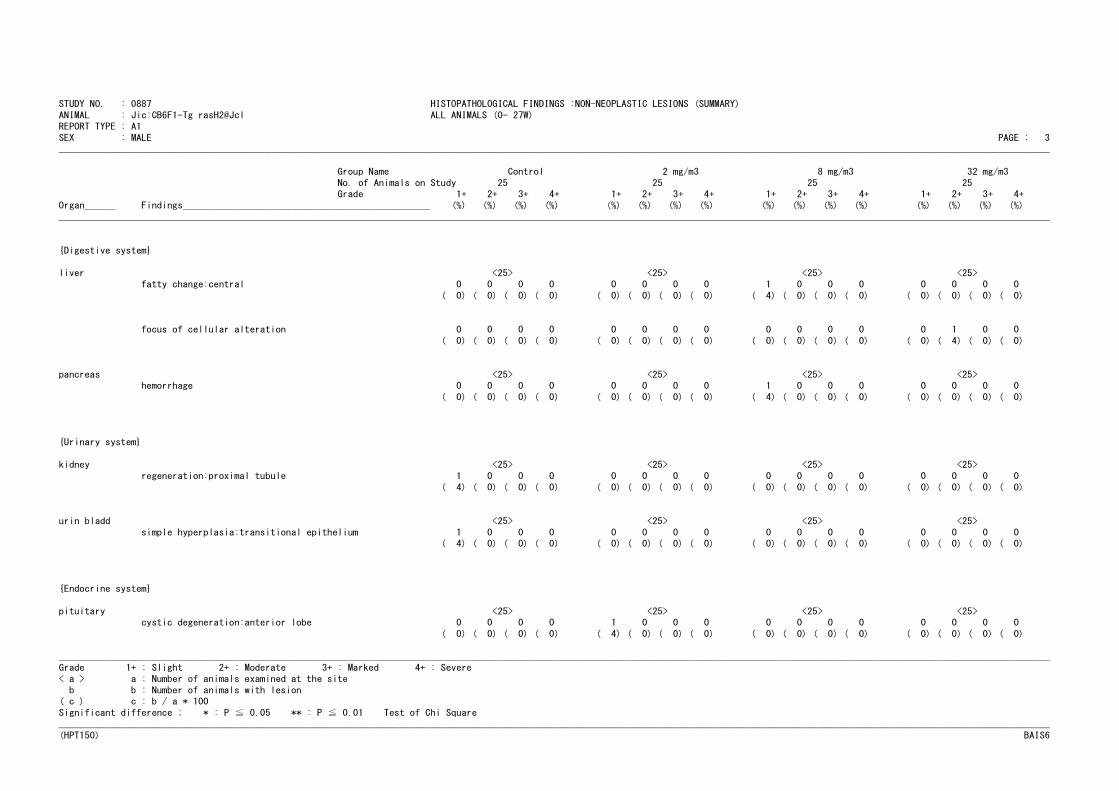
STUDY NO. : 0887 HISTOPATHOLOGICAL FINDINGS :NON-NEOPLASTIC LESIONS (SUMMARY)
ANIMAL : Jic:CB6F1-Tg rasH2@Jcl ALL ANIMALS (0- 27W)REPORT TYPE : A1
SEX : MALE PAGE : 3________________________________________________________________________________________________________________________________________________________________________________________________
Group Name Control 2 mg/m3 8 mg/m3 32 mg/m3
No. of Animals on Study 25 25 25 25Grade 1+ 2+ 3+ 4+ 1+ 2+ 3+ 4+ 1+ 2+ 3+ 4+ 1+ 2+ 3+ 4+
Organ______ Findings________________________________________________ (%) (%) (%) (%) (%) (%) (%) (%) (%) (%) (%) (%) (%) (%) (%) (%)
________________________________________________________________________________________________________________________________________________________________________________________________
{Digestive system}
liver <25> <25> <25> <25>fatty change:central 0 0 0 0 0 0 0 0 1 0 0 0 0 0 0 0
( 0) ( 0) ( 0) ( 0) ( 0) ( 0) ( 0) ( 0) ( 4) ( 0) ( 0) ( 0) ( 0) ( 0) ( 0) ( 0)
focus of cellular alteration 0 0 0 0 0 0 0 0 0 0 0 0 0 1 0 0
( 0) ( 0) ( 0) ( 0) ( 0) ( 0) ( 0) ( 0) ( 0) ( 0) ( 0) ( 0) ( 0) ( 4) ( 0) ( 0)
pancreas <25> <25> <25> <25>hemorrhage 0 0 0 0 0 0 0 0 1 0 0 0 0 0 0 0
( 0) ( 0) ( 0) ( 0) ( 0) ( 0) ( 0) ( 0) ( 4) ( 0) ( 0) ( 0) ( 0) ( 0) ( 0) ( 0)
{Urinary system}
kidney <25> <25> <25> <25>
regeneration:proximal tubule 1 0 0 0 0 0 0 0 0 0 0 0 0 0 0 0
( 4) ( 0) ( 0) ( 0) ( 0) ( 0) ( 0) ( 0) ( 0) ( 0) ( 0) ( 0) ( 0) ( 0) ( 0) ( 0)
urin bladd <25> <25> <25> <25>
simple hyperplasia:transitional epithelium 1 0 0 0 0 0 0 0 0 0 0 0 0 0 0 0( 4) ( 0) ( 0) ( 0) ( 0) ( 0) ( 0) ( 0) ( 0) ( 0) ( 0) ( 0) ( 0) ( 0) ( 0) ( 0)
{Endocrine system}
pituitary <25> <25> <25> <25>cystic degeneration:anterior lobe 0 0 0 0 1 0 0 0 0 0 0 0 0 0 0 0
( 0) ( 0) ( 0) ( 0) ( 4) ( 0) ( 0) ( 0) ( 0) ( 0) ( 0) ( 0) ( 0) ( 0) ( 0) ( 0)
________________________________________________________________________________________________________________________________________________________________________________________________Grade 1+ : Slight 2+ : Moderate 3+ : Marked 4+ : Severe< a > a : Number of animals examined at the site
b b : Number of animals with lesion( c ) c : b / a * 100
Significant difference ; * : P ≦ 0.05 ** : P ≦ 0.01 Test of Chi Square
________________________________________________________________________________________________________________________________________________________________________________________________
(HPT150) BAIS6
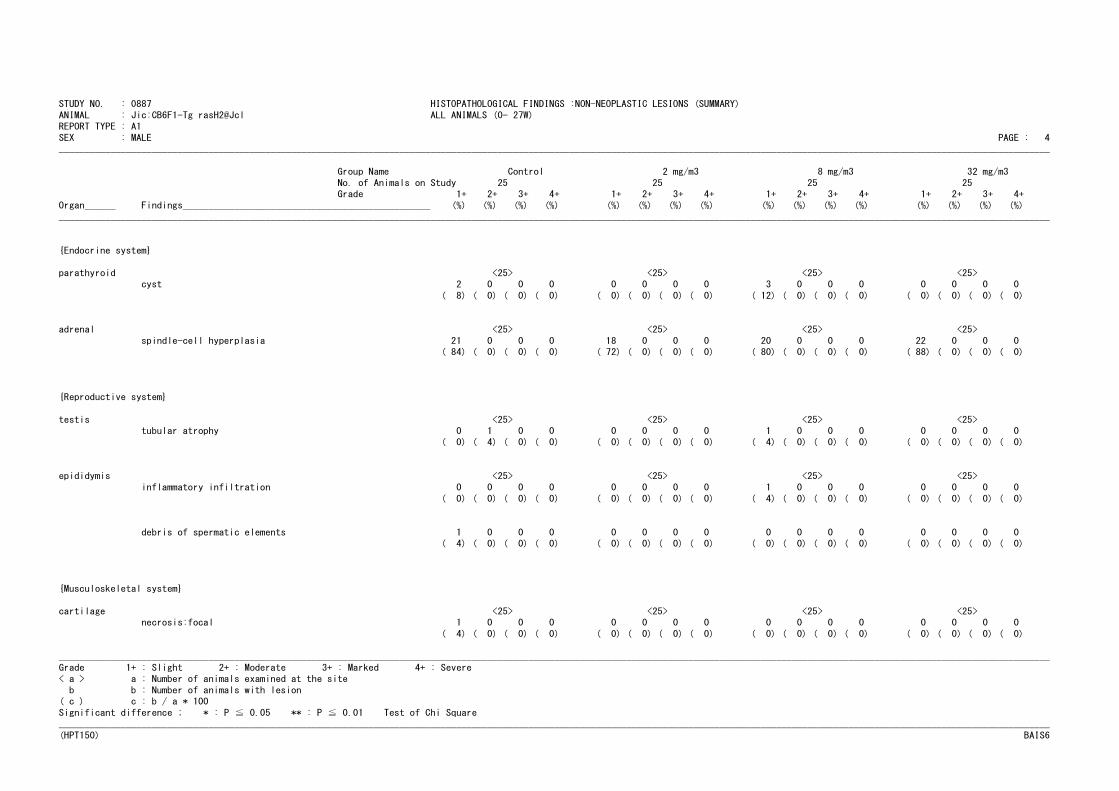
STUDY NO. : 0887 HISTOPATHOLOGICAL FINDINGS :NON-NEOPLASTIC LESIONS (SUMMARY)
ANIMAL : Jic:CB6F1-Tg rasH2@Jcl ALL ANIMALS (0- 27W)REPORT TYPE : A1
SEX : MALE PAGE : 4________________________________________________________________________________________________________________________________________________________________________________________________
Group Name Control 2 mg/m3 8 mg/m3 32 mg/m3
No. of Animals on Study 25 25 25 25Grade 1+ 2+ 3+ 4+ 1+ 2+ 3+ 4+ 1+ 2+ 3+ 4+ 1+ 2+ 3+ 4+
Organ______ Findings________________________________________________ (%) (%) (%) (%) (%) (%) (%) (%) (%) (%) (%) (%) (%) (%) (%) (%)
________________________________________________________________________________________________________________________________________________________________________________________________
{Endocrine system}
parathyroid <25> <25> <25> <25>cyst 2 0 0 0 0 0 0 0 3 0 0 0 0 0 0 0
( 8) ( 0) ( 0) ( 0) ( 0) ( 0) ( 0) ( 0) ( 12) ( 0) ( 0) ( 0) ( 0) ( 0) ( 0) ( 0)
adrenal <25> <25> <25> <25>
spindle-cell hyperplasia 21 0 0 0 18 0 0 0 20 0 0 0 22 0 0 0( 84) ( 0) ( 0) ( 0) ( 72) ( 0) ( 0) ( 0) ( 80) ( 0) ( 0) ( 0) ( 88) ( 0) ( 0) ( 0)
{Reproductive system}
testis <25> <25> <25> <25>tubular atrophy 0 1 0 0 0 0 0 0 1 0 0 0 0 0 0 0
( 0) ( 4) ( 0) ( 0) ( 0) ( 0) ( 0) ( 0) ( 4) ( 0) ( 0) ( 0) ( 0) ( 0) ( 0) ( 0)
epididymis <25> <25> <25> <25>
inflammatory infiltration 0 0 0 0 0 0 0 0 1 0 0 0 0 0 0 0
( 0) ( 0) ( 0) ( 0) ( 0) ( 0) ( 0) ( 0) ( 4) ( 0) ( 0) ( 0) ( 0) ( 0) ( 0) ( 0)
debris of spermatic elements 1 0 0 0 0 0 0 0 0 0 0 0 0 0 0 0( 4) ( 0) ( 0) ( 0) ( 0) ( 0) ( 0) ( 0) ( 0) ( 0) ( 0) ( 0) ( 0) ( 0) ( 0) ( 0)
{Musculoskeletal system}
cartilage <25> <25> <25> <25>necrosis:focal 1 0 0 0 0 0 0 0 0 0 0 0 0 0 0 0
( 4) ( 0) ( 0) ( 0) ( 0) ( 0) ( 0) ( 0) ( 0) ( 0) ( 0) ( 0) ( 0) ( 0) ( 0) ( 0)
________________________________________________________________________________________________________________________________________________________________________________________________Grade 1+ : Slight 2+ : Moderate 3+ : Marked 4+ : Severe< a > a : Number of animals examined at the site
b b : Number of animals with lesion( c ) c : b / a * 100
Significant difference ; * : P ≦ 0.05 ** : P ≦ 0.01 Test of Chi Square
________________________________________________________________________________________________________________________________________________________________________________________________
(HPT150) BAIS6
TABLE O2
HISTOPATHOLOGICAL FINDINGS :
NON-NEOPLASTIC LESIONS : FEMALE
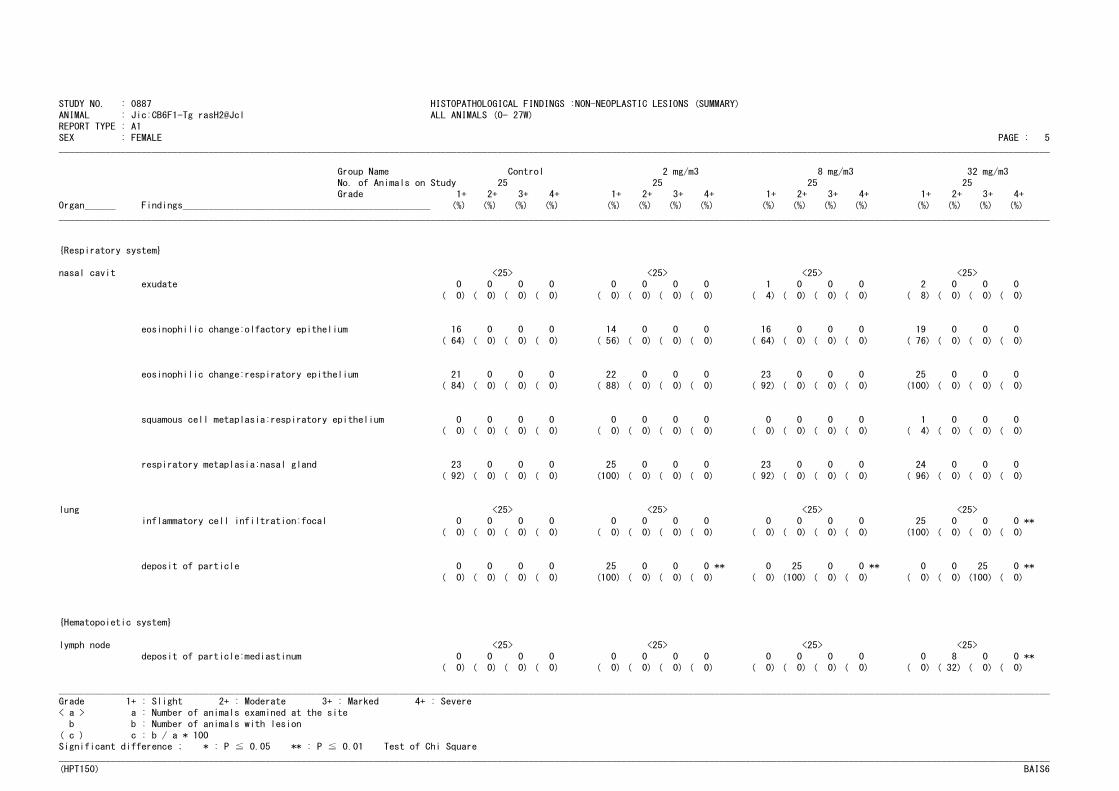
STUDY NO. : 0887 HISTOPATHOLOGICAL FINDINGS :NON-NEOPLASTIC LESIONS (SUMMARY)
ANIMAL : Jic:CB6F1-Tg rasH2@Jcl ALL ANIMALS (0- 27W)REPORT TYPE : A1
SEX : FEMALE PAGE : 5________________________________________________________________________________________________________________________________________________________________________________________________
Group Name Control 2 mg/m3 8 mg/m3 32 mg/m3
No. of Animals on Study 25 25 25 25Grade 1+ 2+ 3+ 4+ 1+ 2+ 3+ 4+ 1+ 2+ 3+ 4+ 1+ 2+ 3+ 4+
Organ______ Findings________________________________________________ (%) (%) (%) (%) (%) (%) (%) (%) (%) (%) (%) (%) (%) (%) (%) (%)
________________________________________________________________________________________________________________________________________________________________________________________________
{Respiratory system}
nasal cavit <25> <25> <25> <25>exudate 0 0 0 0 0 0 0 0 1 0 0 0 2 0 0 0
( 0) ( 0) ( 0) ( 0) ( 0) ( 0) ( 0) ( 0) ( 4) ( 0) ( 0) ( 0) ( 8) ( 0) ( 0) ( 0)
eosinophilic change:olfactory epithelium 16 0 0 0 14 0 0 0 16 0 0 0 19 0 0 0
( 64) ( 0) ( 0) ( 0) ( 56) ( 0) ( 0) ( 0) ( 64) ( 0) ( 0) ( 0) ( 76) ( 0) ( 0) ( 0)
eosinophilic change:respiratory epithelium 21 0 0 0 22 0 0 0 23 0 0 0 25 0 0 0( 84) ( 0) ( 0) ( 0) ( 88) ( 0) ( 0) ( 0) ( 92) ( 0) ( 0) ( 0) (100) ( 0) ( 0) ( 0)
squamous cell metaplasia:respiratory epithelium 0 0 0 0 0 0 0 0 0 0 0 0 1 0 0 0( 0) ( 0) ( 0) ( 0) ( 0) ( 0) ( 0) ( 0) ( 0) ( 0) ( 0) ( 0) ( 4) ( 0) ( 0) ( 0)
respiratory metaplasia:nasal gland 23 0 0 0 25 0 0 0 23 0 0 0 24 0 0 0
( 92) ( 0) ( 0) ( 0) (100) ( 0) ( 0) ( 0) ( 92) ( 0) ( 0) ( 0) ( 96) ( 0) ( 0) ( 0)
lung <25> <25> <25> <25>inflammatory cell infiltration:focal 0 0 0 0 0 0 0 0 0 0 0 0 25 0 0 0 **
( 0) ( 0) ( 0) ( 0) ( 0) ( 0) ( 0) ( 0) ( 0) ( 0) ( 0) ( 0) (100) ( 0) ( 0) ( 0)
deposit of particle 0 0 0 0 25 0 0 0 ** 0 25 0 0 ** 0 0 25 0 **
( 0) ( 0) ( 0) ( 0) (100) ( 0) ( 0) ( 0) ( 0) (100) ( 0) ( 0) ( 0) ( 0) (100) ( 0)
{Hematopoietic system}
lymph node <25> <25> <25> <25>
deposit of particle:mediastinum 0 0 0 0 0 0 0 0 0 0 0 0 0 8 0 0 **( 0) ( 0) ( 0) ( 0) ( 0) ( 0) ( 0) ( 0) ( 0) ( 0) ( 0) ( 0) ( 0) ( 32) ( 0) ( 0)
________________________________________________________________________________________________________________________________________________________________________________________________Grade 1+ : Slight 2+ : Moderate 3+ : Marked 4+ : Severe
< a > a : Number of animals examined at the site
b b : Number of animals with lesion
( c ) c : b / a * 100Significant difference ; * : P ≦ 0.05 ** : P ≦ 0.01 Test of Chi Square________________________________________________________________________________________________________________________________________________________________________________________________
(HPT150) BAIS6
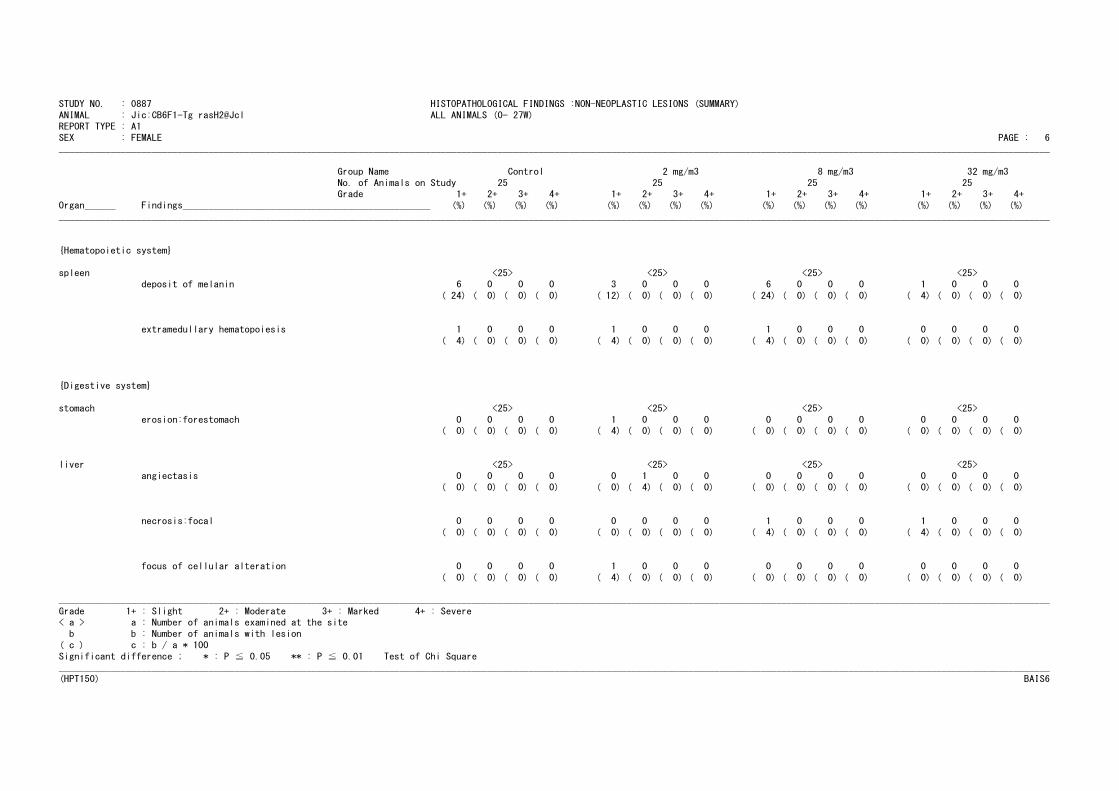
STUDY NO. : 0887 HISTOPATHOLOGICAL FINDINGS :NON-NEOPLASTIC LESIONS (SUMMARY)
ANIMAL : Jic:CB6F1-Tg rasH2@Jcl ALL ANIMALS (0- 27W)REPORT TYPE : A1
SEX : FEMALE PAGE : 6________________________________________________________________________________________________________________________________________________________________________________________________
Group Name Control 2 mg/m3 8 mg/m3 32 mg/m3
No. of Animals on Study 25 25 25 25Grade 1+ 2+ 3+ 4+ 1+ 2+ 3+ 4+ 1+ 2+ 3+ 4+ 1+ 2+ 3+ 4+
Organ______ Findings________________________________________________ (%) (%) (%) (%) (%) (%) (%) (%) (%) (%) (%) (%) (%) (%) (%) (%)
________________________________________________________________________________________________________________________________________________________________________________________________
{Hematopoietic system}
spleen <25> <25> <25> <25>deposit of melanin 6 0 0 0 3 0 0 0 6 0 0 0 1 0 0 0
( 24) ( 0) ( 0) ( 0) ( 12) ( 0) ( 0) ( 0) ( 24) ( 0) ( 0) ( 0) ( 4) ( 0) ( 0) ( 0)
extramedullary hematopoiesis 1 0 0 0 1 0 0 0 1 0 0 0 0 0 0 0
( 4) ( 0) ( 0) ( 0) ( 4) ( 0) ( 0) ( 0) ( 4) ( 0) ( 0) ( 0) ( 0) ( 0) ( 0) ( 0)
{Digestive system}
stomach <25> <25> <25> <25>
erosion:forestomach 0 0 0 0 1 0 0 0 0 0 0 0 0 0 0 0( 0) ( 0) ( 0) ( 0) ( 4) ( 0) ( 0) ( 0) ( 0) ( 0) ( 0) ( 0) ( 0) ( 0) ( 0) ( 0)
liver <25> <25> <25> <25>
angiectasis 0 0 0 0 0 1 0 0 0 0 0 0 0 0 0 0
( 0) ( 0) ( 0) ( 0) ( 0) ( 4) ( 0) ( 0) ( 0) ( 0) ( 0) ( 0) ( 0) ( 0) ( 0) ( 0)
necrosis:focal 0 0 0 0 0 0 0 0 1 0 0 0 1 0 0 0
( 0) ( 0) ( 0) ( 0) ( 0) ( 0) ( 0) ( 0) ( 4) ( 0) ( 0) ( 0) ( 4) ( 0) ( 0) ( 0)
focus of cellular alteration 0 0 0 0 1 0 0 0 0 0 0 0 0 0 0 0
( 0) ( 0) ( 0) ( 0) ( 4) ( 0) ( 0) ( 0) ( 0) ( 0) ( 0) ( 0) ( 0) ( 0) ( 0) ( 0)
________________________________________________________________________________________________________________________________________________________________________________________________
Grade 1+ : Slight 2+ : Moderate 3+ : Marked 4+ : Severe< a > a : Number of animals examined at the site
b b : Number of animals with lesion
( c ) c : b / a * 100
Significant difference ; * : P ≦ 0.05 ** : P ≦ 0.01 Test of Chi Square________________________________________________________________________________________________________________________________________________________________________________________________(HPT150) BAIS6
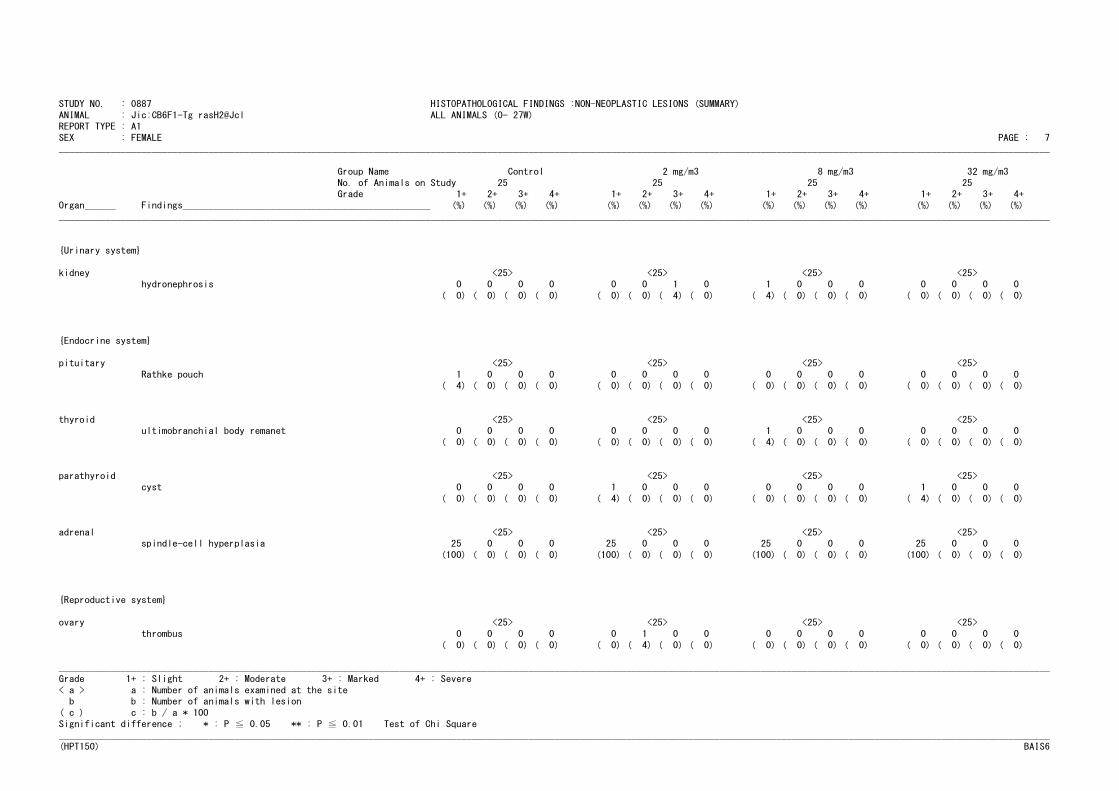
STUDY NO. : 0887 HISTOPATHOLOGICAL FINDINGS :NON-NEOPLASTIC LESIONS (SUMMARY)
ANIMAL : Jic:CB6F1-Tg rasH2@Jcl ALL ANIMALS (0- 27W)REPORT TYPE : A1
SEX : FEMALE PAGE : 7________________________________________________________________________________________________________________________________________________________________________________________________
Group Name Control 2 mg/m3 8 mg/m3 32 mg/m3
No. of Animals on Study 25 25 25 25Grade 1+ 2+ 3+ 4+ 1+ 2+ 3+ 4+ 1+ 2+ 3+ 4+ 1+ 2+ 3+ 4+
Organ______ Findings________________________________________________ (%) (%) (%) (%) (%) (%) (%) (%) (%) (%) (%) (%) (%) (%) (%) (%)
________________________________________________________________________________________________________________________________________________________________________________________________
{Urinary system}
kidney <25> <25> <25> <25>hydronephrosis 0 0 0 0 0 0 1 0 1 0 0 0 0 0 0 0
( 0) ( 0) ( 0) ( 0) ( 0) ( 0) ( 4) ( 0) ( 4) ( 0) ( 0) ( 0) ( 0) ( 0) ( 0) ( 0)
{Endocrine system}
pituitary <25> <25> <25> <25>
Rathke pouch 1 0 0 0 0 0 0 0 0 0 0 0 0 0 0 0( 4) ( 0) ( 0) ( 0) ( 0) ( 0) ( 0) ( 0) ( 0) ( 0) ( 0) ( 0) ( 0) ( 0) ( 0) ( 0)
thyroid <25> <25> <25> <25>ultimobranchial body remanet 0 0 0 0 0 0 0 0 1 0 0 0 0 0 0 0
( 0) ( 0) ( 0) ( 0) ( 0) ( 0) ( 0) ( 0) ( 4) ( 0) ( 0) ( 0) ( 0) ( 0) ( 0) ( 0)
parathyroid <25> <25> <25> <25>
cyst 0 0 0 0 1 0 0 0 0 0 0 0 1 0 0 0
( 0) ( 0) ( 0) ( 0) ( 4) ( 0) ( 0) ( 0) ( 0) ( 0) ( 0) ( 0) ( 4) ( 0) ( 0) ( 0)
adrenal <25> <25> <25> <25>spindle-cell hyperplasia 25 0 0 0 25 0 0 0 25 0 0 0 25 0 0 0
(100) ( 0) ( 0) ( 0) (100) ( 0) ( 0) ( 0) (100) ( 0) ( 0) ( 0) (100) ( 0) ( 0) ( 0)
{Reproductive system}
ovary <25> <25> <25> <25>
thrombus 0 0 0 0 0 1 0 0 0 0 0 0 0 0 0 0
( 0) ( 0) ( 0) ( 0) ( 0) ( 4) ( 0) ( 0) ( 0) ( 0) ( 0) ( 0) ( 0) ( 0) ( 0) ( 0)
________________________________________________________________________________________________________________________________________________________________________________________________Grade 1+ : Slight 2+ : Moderate 3+ : Marked 4+ : Severe
< a > a : Number of animals examined at the siteb b : Number of animals with lesion
( c ) c : b / a * 100
Significant difference ; * : P ≦ 0.05 ** : P ≦ 0.01 Test of Chi Square
________________________________________________________________________________________________________________________________________________________________________________________________(HPT150) BAIS6
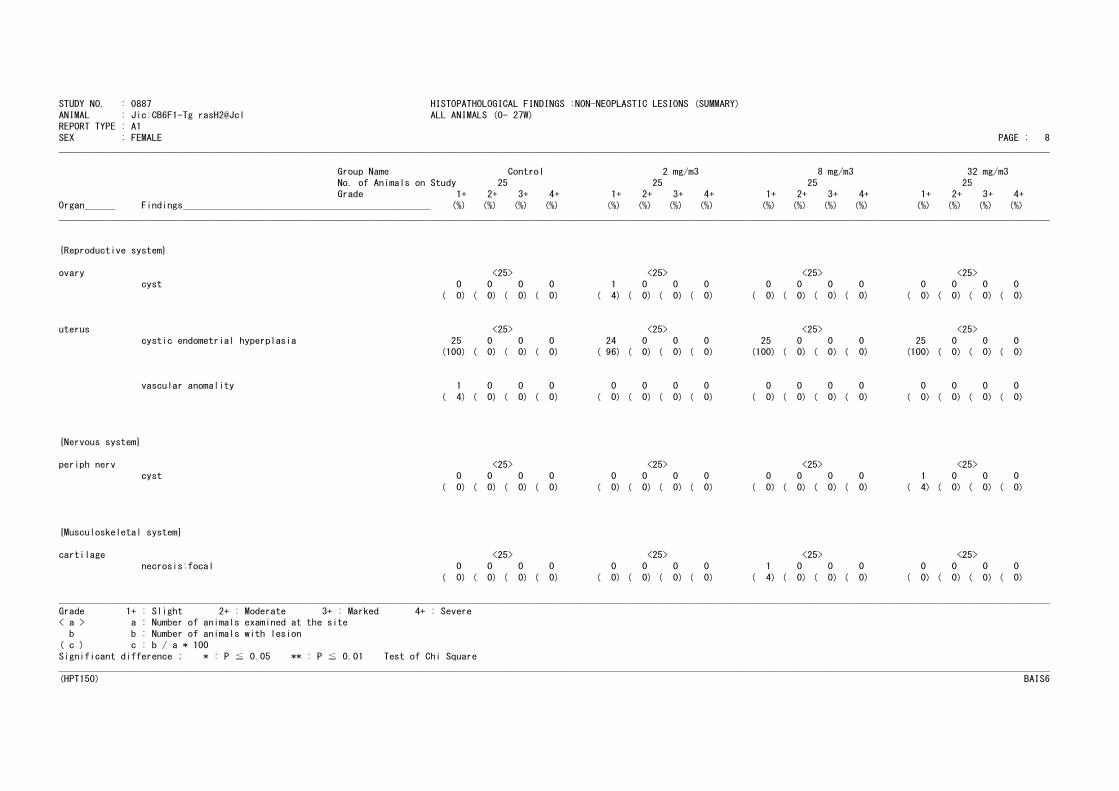
STUDY NO. : 0887 HISTOPATHOLOGICAL FINDINGS :NON-NEOPLASTIC LESIONS (SUMMARY)
ANIMAL : Jic:CB6F1-Tg rasH2@Jcl ALL ANIMALS (0- 27W)REPORT TYPE : A1
SEX : FEMALE PAGE : 8________________________________________________________________________________________________________________________________________________________________________________________________
Group Name Control 2 mg/m3 8 mg/m3 32 mg/m3
No. of Animals on Study 25 25 25 25Grade 1+ 2+ 3+ 4+ 1+ 2+ 3+ 4+ 1+ 2+ 3+ 4+ 1+ 2+ 3+ 4+
Organ______ Findings________________________________________________ (%) (%) (%) (%) (%) (%) (%) (%) (%) (%) (%) (%) (%) (%) (%) (%)
________________________________________________________________________________________________________________________________________________________________________________________________
{Reproductive system}
ovary <25> <25> <25> <25>cyst 0 0 0 0 1 0 0 0 0 0 0 0 0 0 0 0
( 0) ( 0) ( 0) ( 0) ( 4) ( 0) ( 0) ( 0) ( 0) ( 0) ( 0) ( 0) ( 0) ( 0) ( 0) ( 0)
uterus <25> <25> <25> <25>
cystic endometrial hyperplasia 25 0 0 0 24 0 0 0 25 0 0 0 25 0 0 0(100) ( 0) ( 0) ( 0) ( 96) ( 0) ( 0) ( 0) (100) ( 0) ( 0) ( 0) (100) ( 0) ( 0) ( 0)
vascular anomality 1 0 0 0 0 0 0 0 0 0 0 0 0 0 0 0
( 4) ( 0) ( 0) ( 0) ( 0) ( 0) ( 0) ( 0) ( 0) ( 0) ( 0) ( 0) ( 0) ( 0) ( 0) ( 0)
{Nervous system}
periph nerv <25> <25> <25> <25>
cyst 0 0 0 0 0 0 0 0 0 0 0 0 1 0 0 0
( 0) ( 0) ( 0) ( 0) ( 0) ( 0) ( 0) ( 0) ( 0) ( 0) ( 0) ( 0) ( 4) ( 0) ( 0) ( 0)
{Musculoskeletal system}
cartilage <25> <25> <25> <25>
necrosis:focal 0 0 0 0 0 0 0 0 1 0 0 0 0 0 0 0
( 0) ( 0) ( 0) ( 0) ( 0) ( 0) ( 0) ( 0) ( 4) ( 0) ( 0) ( 0) ( 0) ( 0) ( 0) ( 0)
________________________________________________________________________________________________________________________________________________________________________________________________
Grade 1+ : Slight 2+ : Moderate 3+ : Marked 4+ : Severe< a > a : Number of animals examined at the site
b b : Number of animals with lesion
( c ) c : b / a * 100
Significant difference ; * : P ≦ 0.05 ** : P ≦ 0.01 Test of Chi Square________________________________________________________________________________________________________________________________________________________________________________________________(HPT150) BAIS6
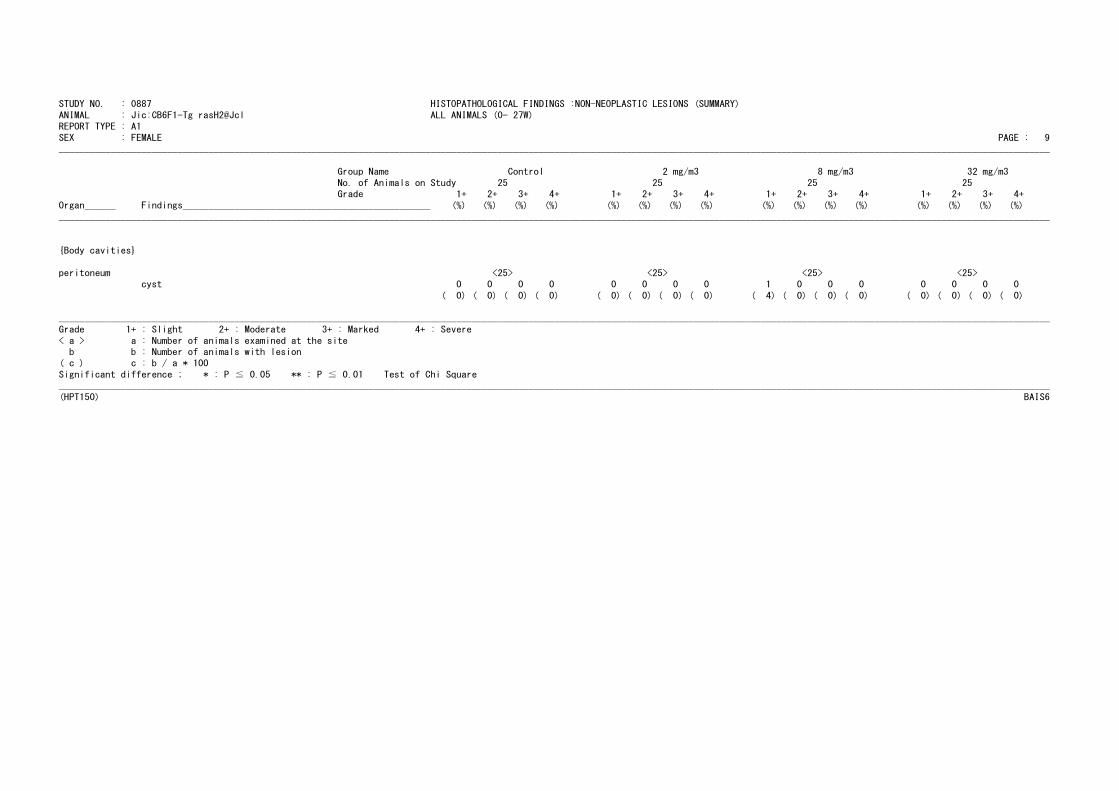
STUDY NO. : 0887 HISTOPATHOLOGICAL FINDINGS :NON-NEOPLASTIC LESIONS (SUMMARY)
ANIMAL : Jic:CB6F1-Tg rasH2@Jcl ALL ANIMALS (0- 27W)REPORT TYPE : A1
SEX : FEMALE PAGE : 9________________________________________________________________________________________________________________________________________________________________________________________________
Group Name Control 2 mg/m3 8 mg/m3 32 mg/m3
No. of Animals on Study 25 25 25 25Grade 1+ 2+ 3+ 4+ 1+ 2+ 3+ 4+ 1+ 2+ 3+ 4+ 1+ 2+ 3+ 4+
Organ______ Findings________________________________________________ (%) (%) (%) (%) (%) (%) (%) (%) (%) (%) (%) (%) (%) (%) (%) (%)
________________________________________________________________________________________________________________________________________________________________________________________________
{Body cavities}
peritoneum <25> <25> <25> <25>cyst 0 0 0 0 0 0 0 0 1 0 0 0 0 0 0 0
( 0) ( 0) ( 0) ( 0) ( 0) ( 0) ( 0) ( 0) ( 4) ( 0) ( 0) ( 0) ( 0) ( 0) ( 0) ( 0)
________________________________________________________________________________________________________________________________________________________________________________________________
Grade 1+ : Slight 2+ : Moderate 3+ : Marked 4+ : Severe
< a > a : Number of animals examined at the siteb b : Number of animals with lesion
( c ) c : b / a * 100
Significant difference ; * : P ≦ 0.05 ** : P ≦ 0.01 Test of Chi Square________________________________________________________________________________________________________________________________________________________________________________________________
(HPT150) BAIS6
TABLE P1
CAUSE OF DEATH : MALE
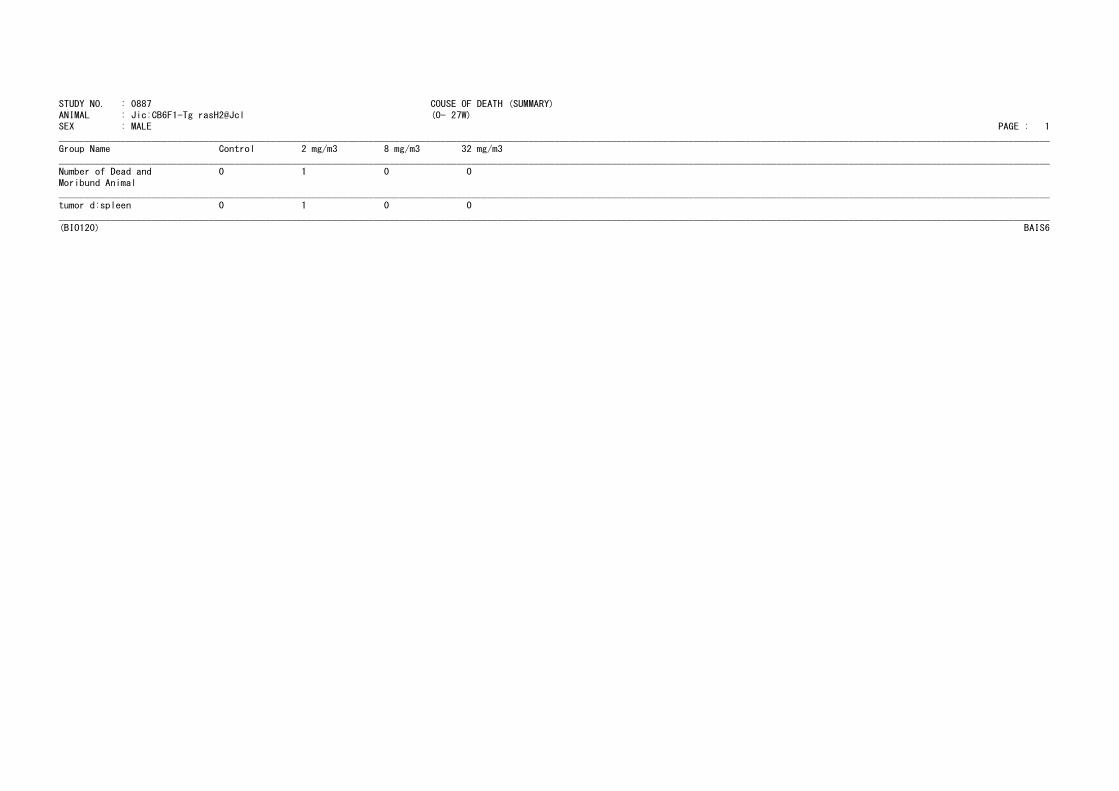
STUDY NO. : 0887 COUSE OF DEATH (SUMMARY)
ANIMAL : Jic:CB6F1-Tg rasH2@Jcl (0- 27W)SEX : MALE PAGE : 1
________________________________________________________________________________________________________________________________________________________________________________________________Group Name Control 2 mg/m3 8 mg/m3 32 mg/m3
________________________________________________________________________________________________________________________________________________________________________________________________
Number of Dead and 0 1 0 0
Moribund Animal________________________________________________________________________________________________________________________________________________________________________________________________tumor d:spleen 0 1 0 0
________________________________________________________________________________________________________________________________________________________________________________________________(BIO120) BAIS6
TABLE P2
CAUSE OF DEATH : FEMALE
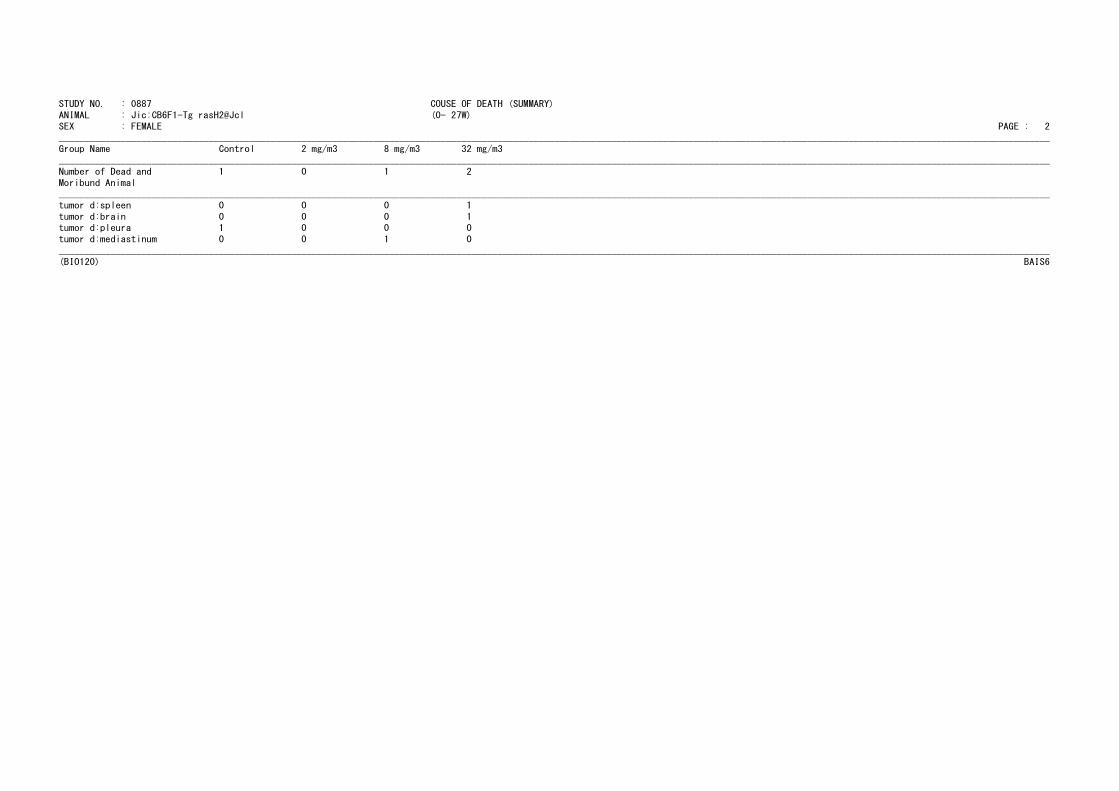
STUDY NO. : 0887 COUSE OF DEATH (SUMMARY)
ANIMAL : Jic:CB6F1-Tg rasH2@Jcl (0- 27W)SEX : FEMALE PAGE : 2
________________________________________________________________________________________________________________________________________________________________________________________________Group Name Control 2 mg/m3 8 mg/m3 32 mg/m3
________________________________________________________________________________________________________________________________________________________________________________________________
Number of Dead and 1 0 1 2
Moribund Animal________________________________________________________________________________________________________________________________________________________________________________________________tumor d:spleen 0 0 0 1
tumor d:brain 0 0 0 1tumor d:pleura 1 0 0 0
tumor d:mediastinum 0 0 1 0
________________________________________________________________________________________________________________________________________________________________________________________________
(BIO120) BAIS6